
OR Manager
2020 Career & Salary Survey


Pandemic raises OR nurse recruitment, management challenges


The COVID-19 pandemic continues to wreak havoc on OR managers’ lives, according to the 2020 annual OR Manager Salary/Career Survey. Many new developments related to the pandemic have occurred and continue to evolve since the spring and early summer, when the survey was deployed. However, the concerns stated by many respondents are still valid and likely are similar to those of many of their peers nationwide.
When asked how the pandemic has affected facilities and staffs, respondents put staffing-related issues (for example, furloughs, redeployment) and decreased surgical volume at the top of the list (sidebar, “COVID-19 effects”). In addition, 30% of managers reported lower surgical volume in the past 12 months, versus 18% in 2019. That 30% figure is not far from the 36% reporting lower volume in 2010, which reflected the effects of the 2008 recession.
Despite decreased surgical volume and upheavals in staffing caused by the pandemic, the survey also reveals some positive trends. Compensation has improved: 78% of managers earn salaries of $100,000 or more annually, up from 65% in 2019, and 46% report total compensation of at least $150,000 or more, compared to 36% last year. And although stress levels are high, OR leaders remain a satisfied group, with 77% viewing their jobs favorably (vs 70% in 2019).
More survey highlights
Other key findings of the survey include:
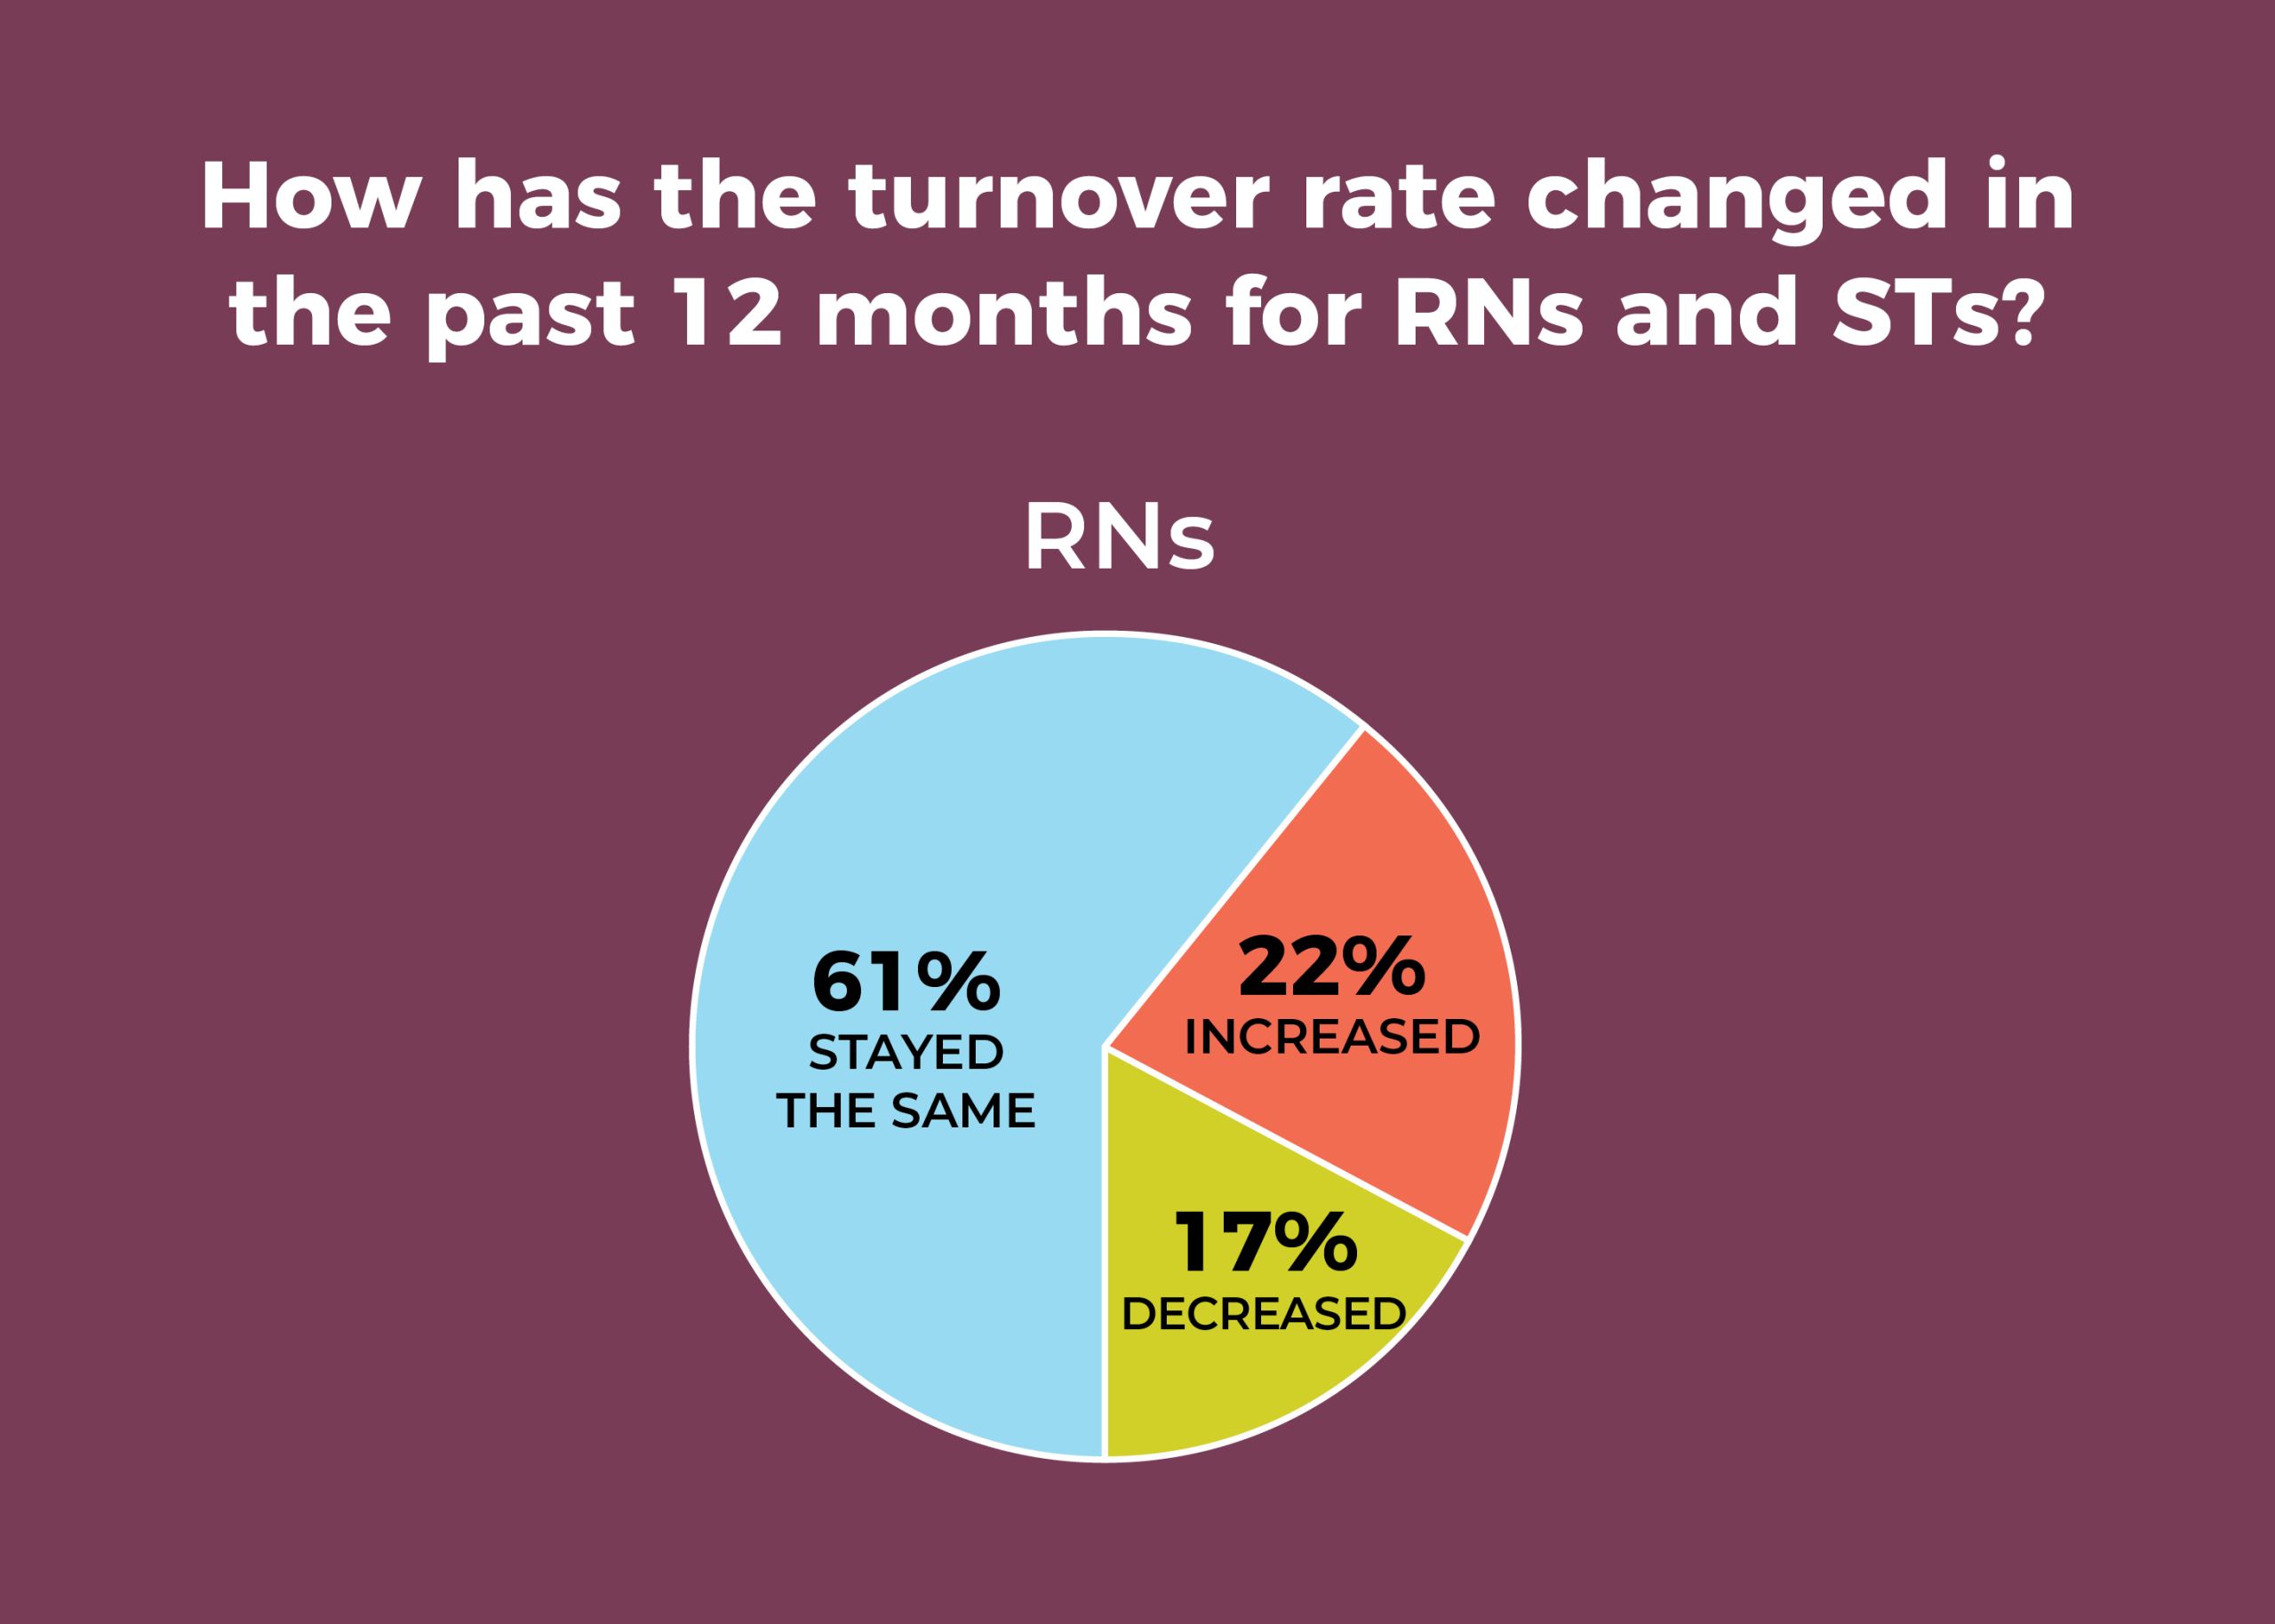
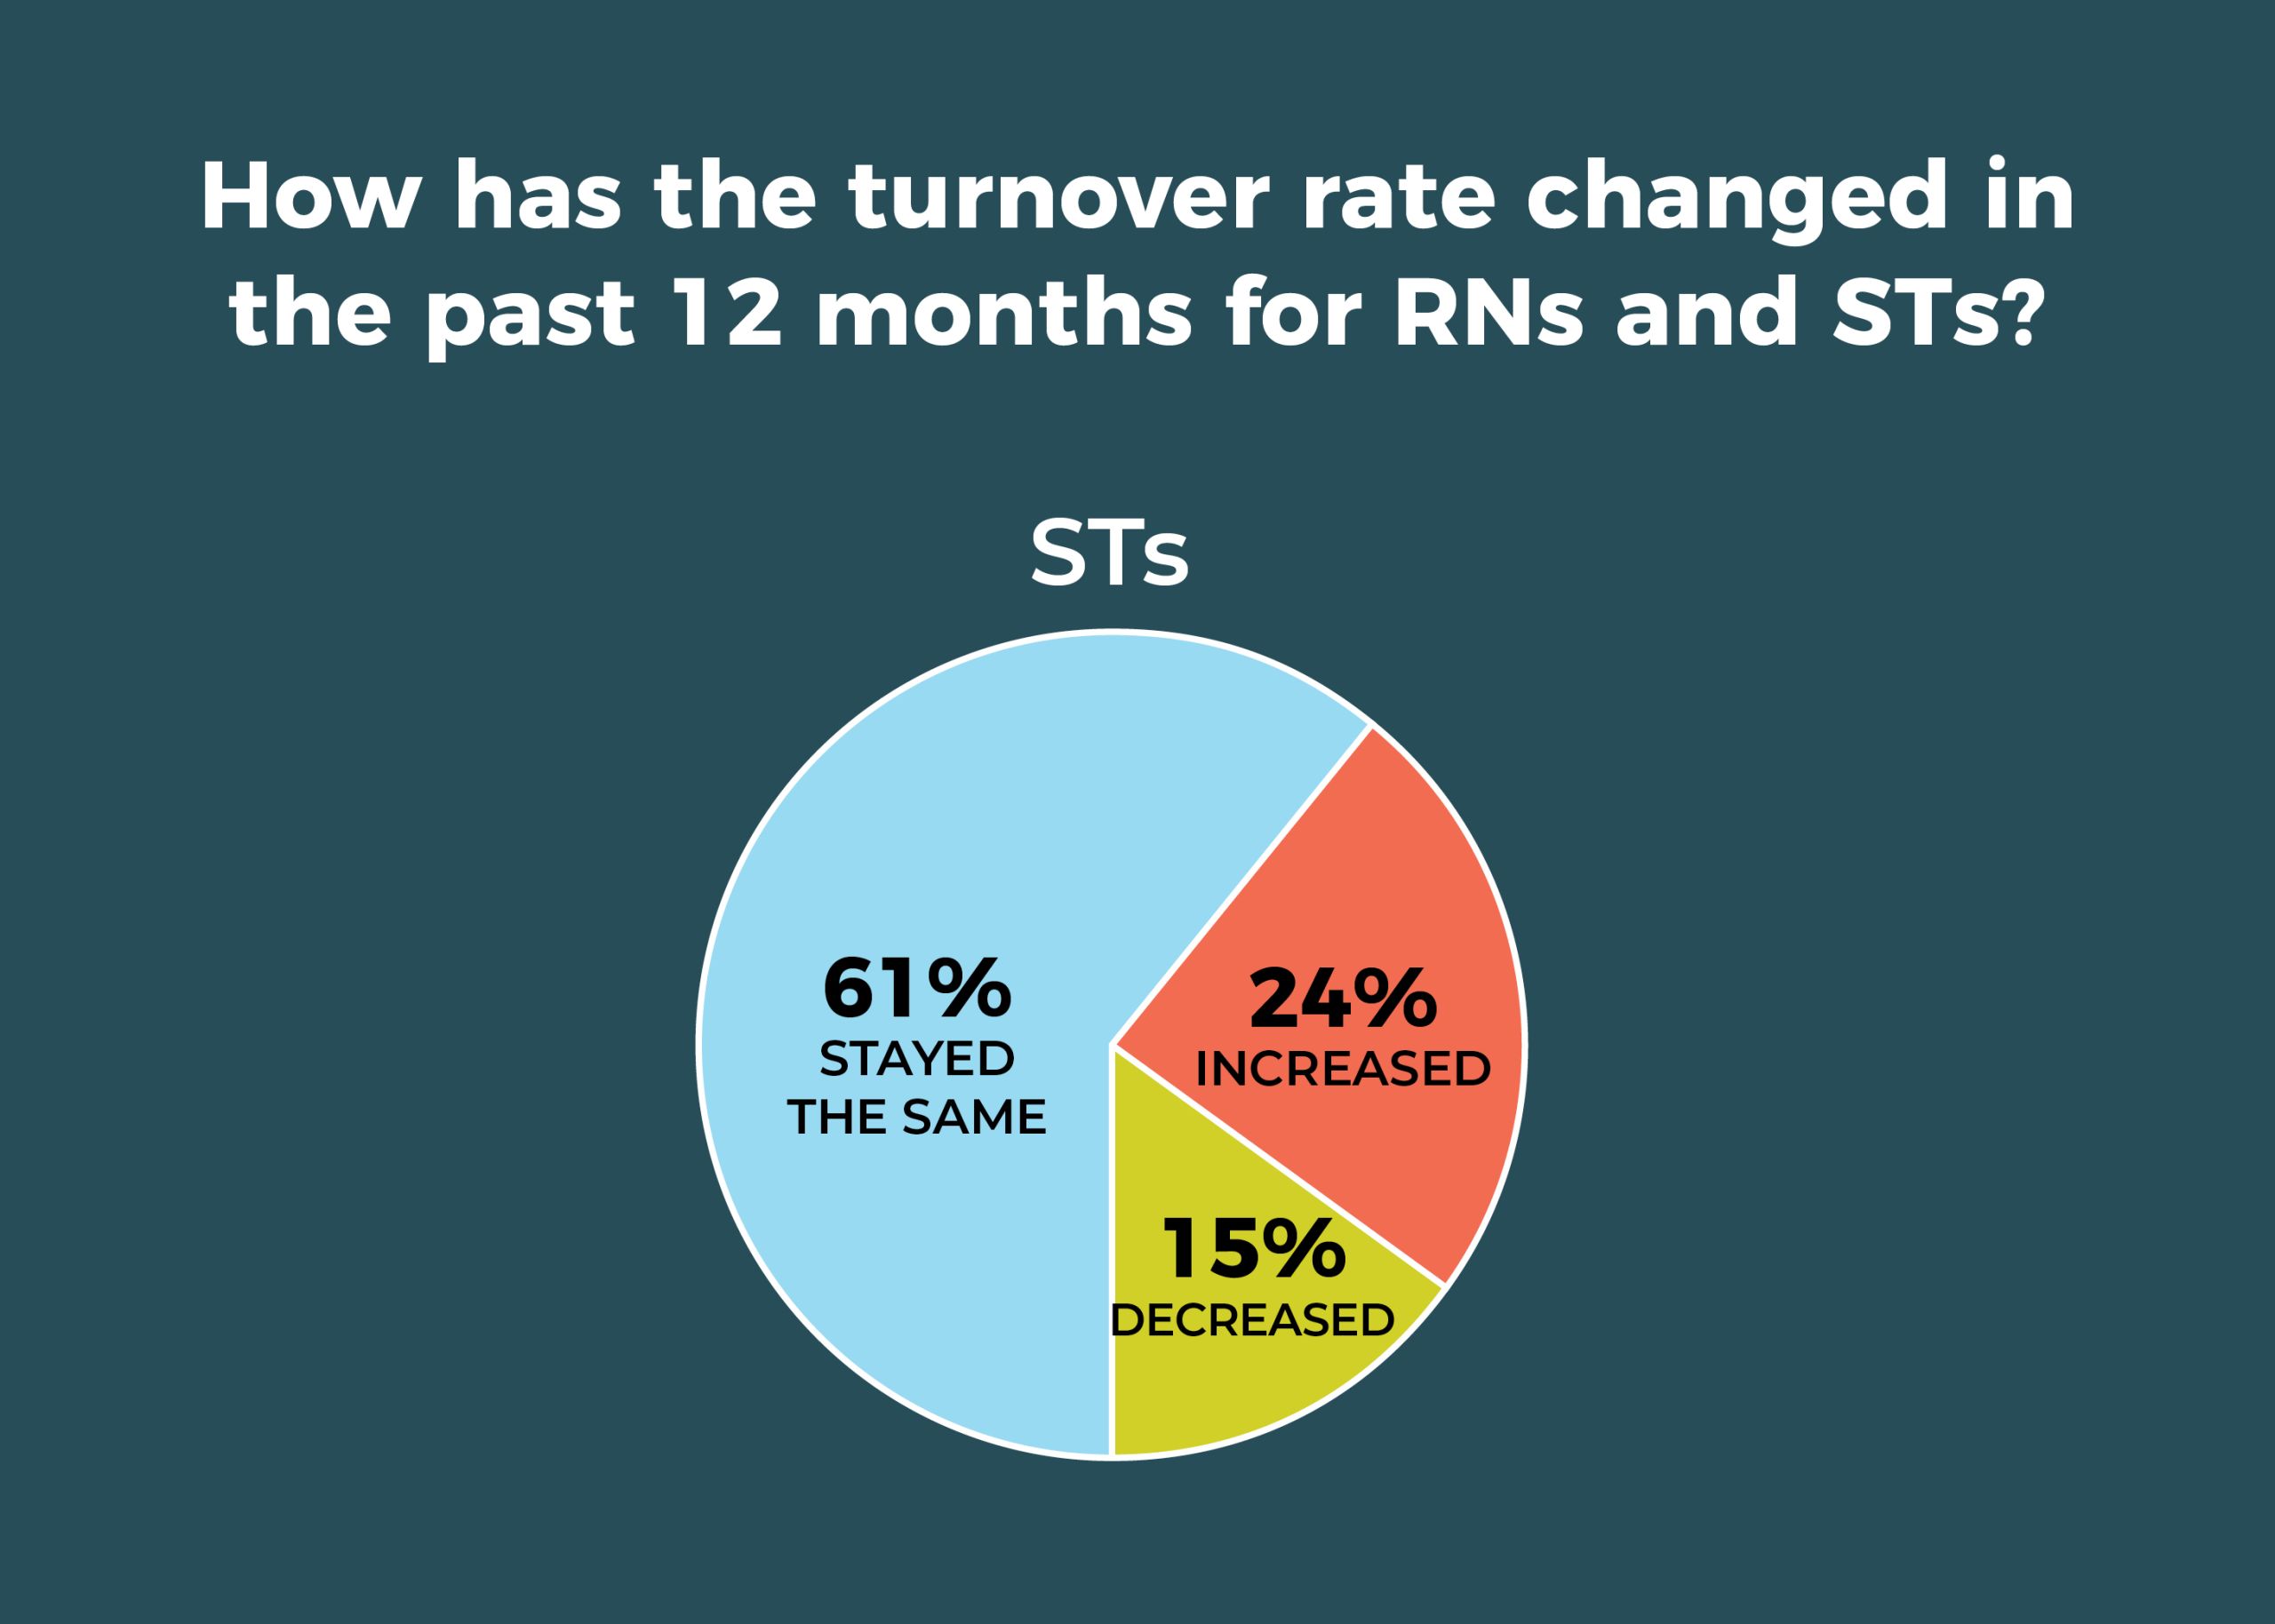
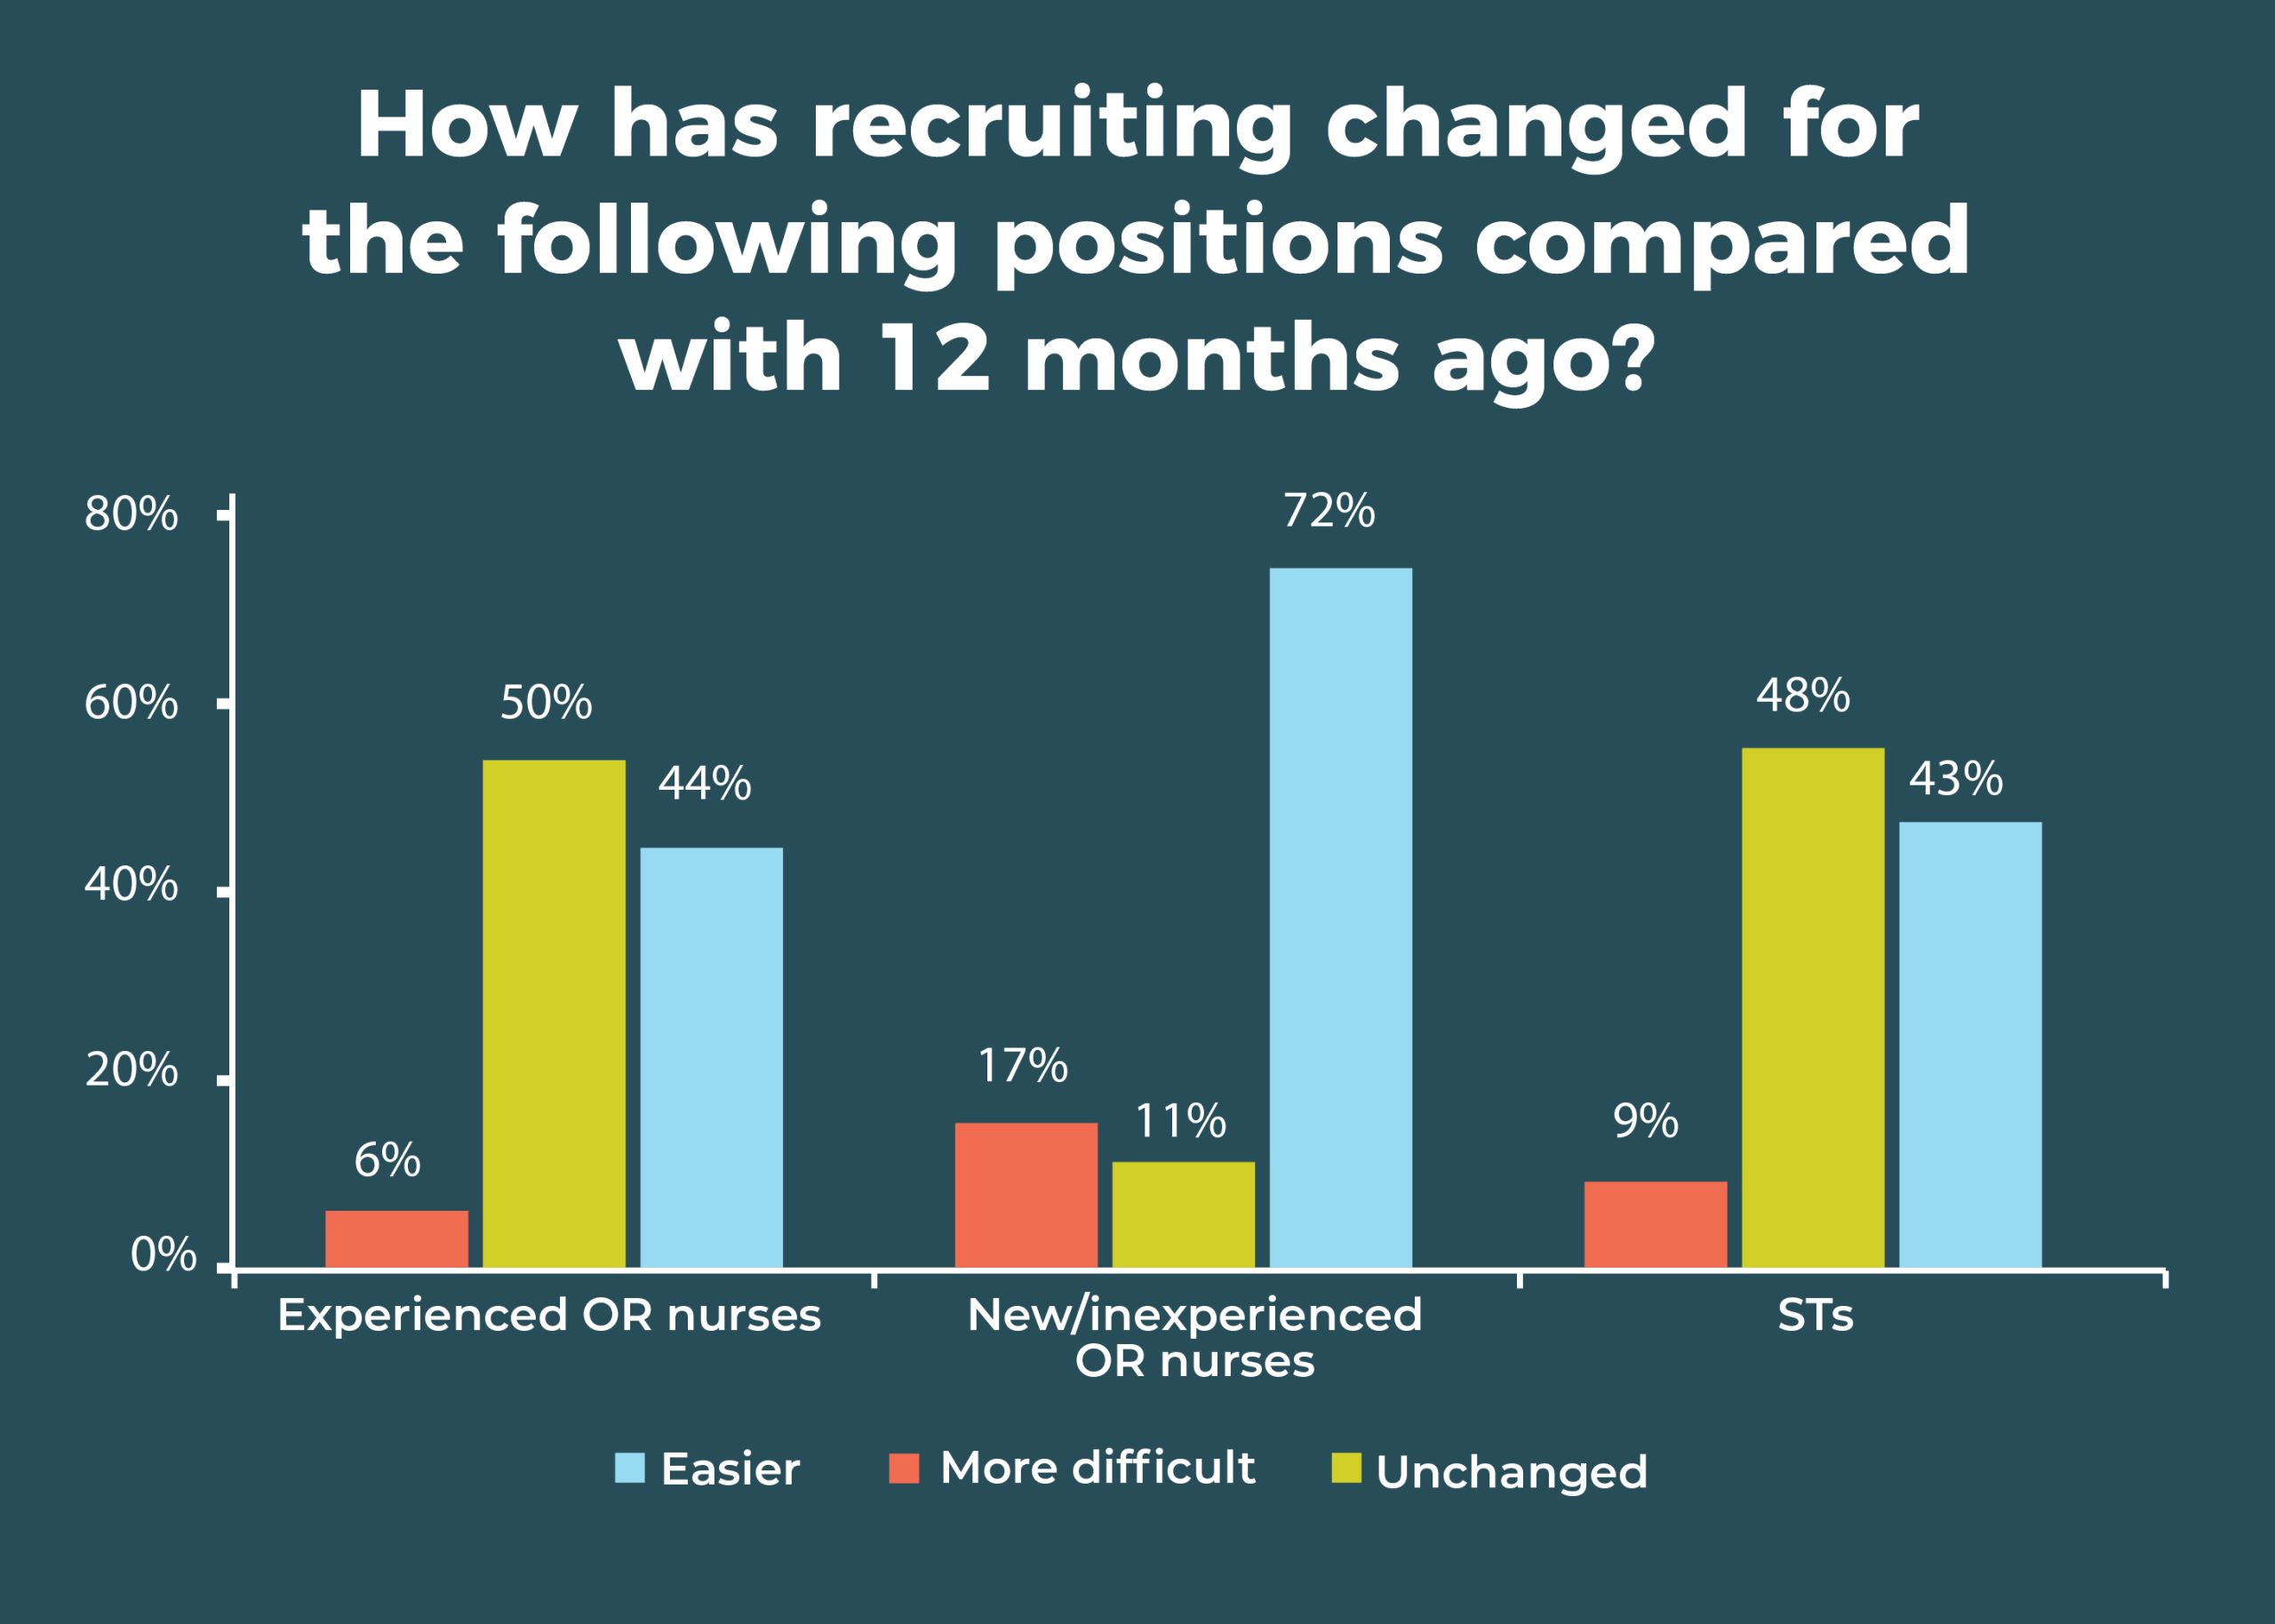
- Staff may be slightly less mobile. For example, RN and surgical technologist (ST) turnover for the past 12 months has stayed the same for 61% of OR leaders. In 2019, just 50% of leaders reported such stability for RNs and 53% for STs. That’s good news, given that 63% (vs 67% in 2019) of respondents are having more difficulty recruiting experienced RNs, and 56% (vs 51% in 2019) are finding recruiting STs to be more difficult.
- More than half (52%) of OR leaders use data analytics to help with surgery scheduling.
- The adoption of care models has yet to gain momentum, with 42% reporting that none of the care model options listed in the survey, including Enhanced Recovery After Surgery (ERAS) and the Perioperative Surgical Home (PSH), have been implemented or are planned to be implemented in the next 6 months. ERAS remains the most popular model, with 46% reporting adoption or planned adoption.
- Only 20% plan to add ORs within the next year.
Here is a closer look at other findings, including data showing trends over the past decade.


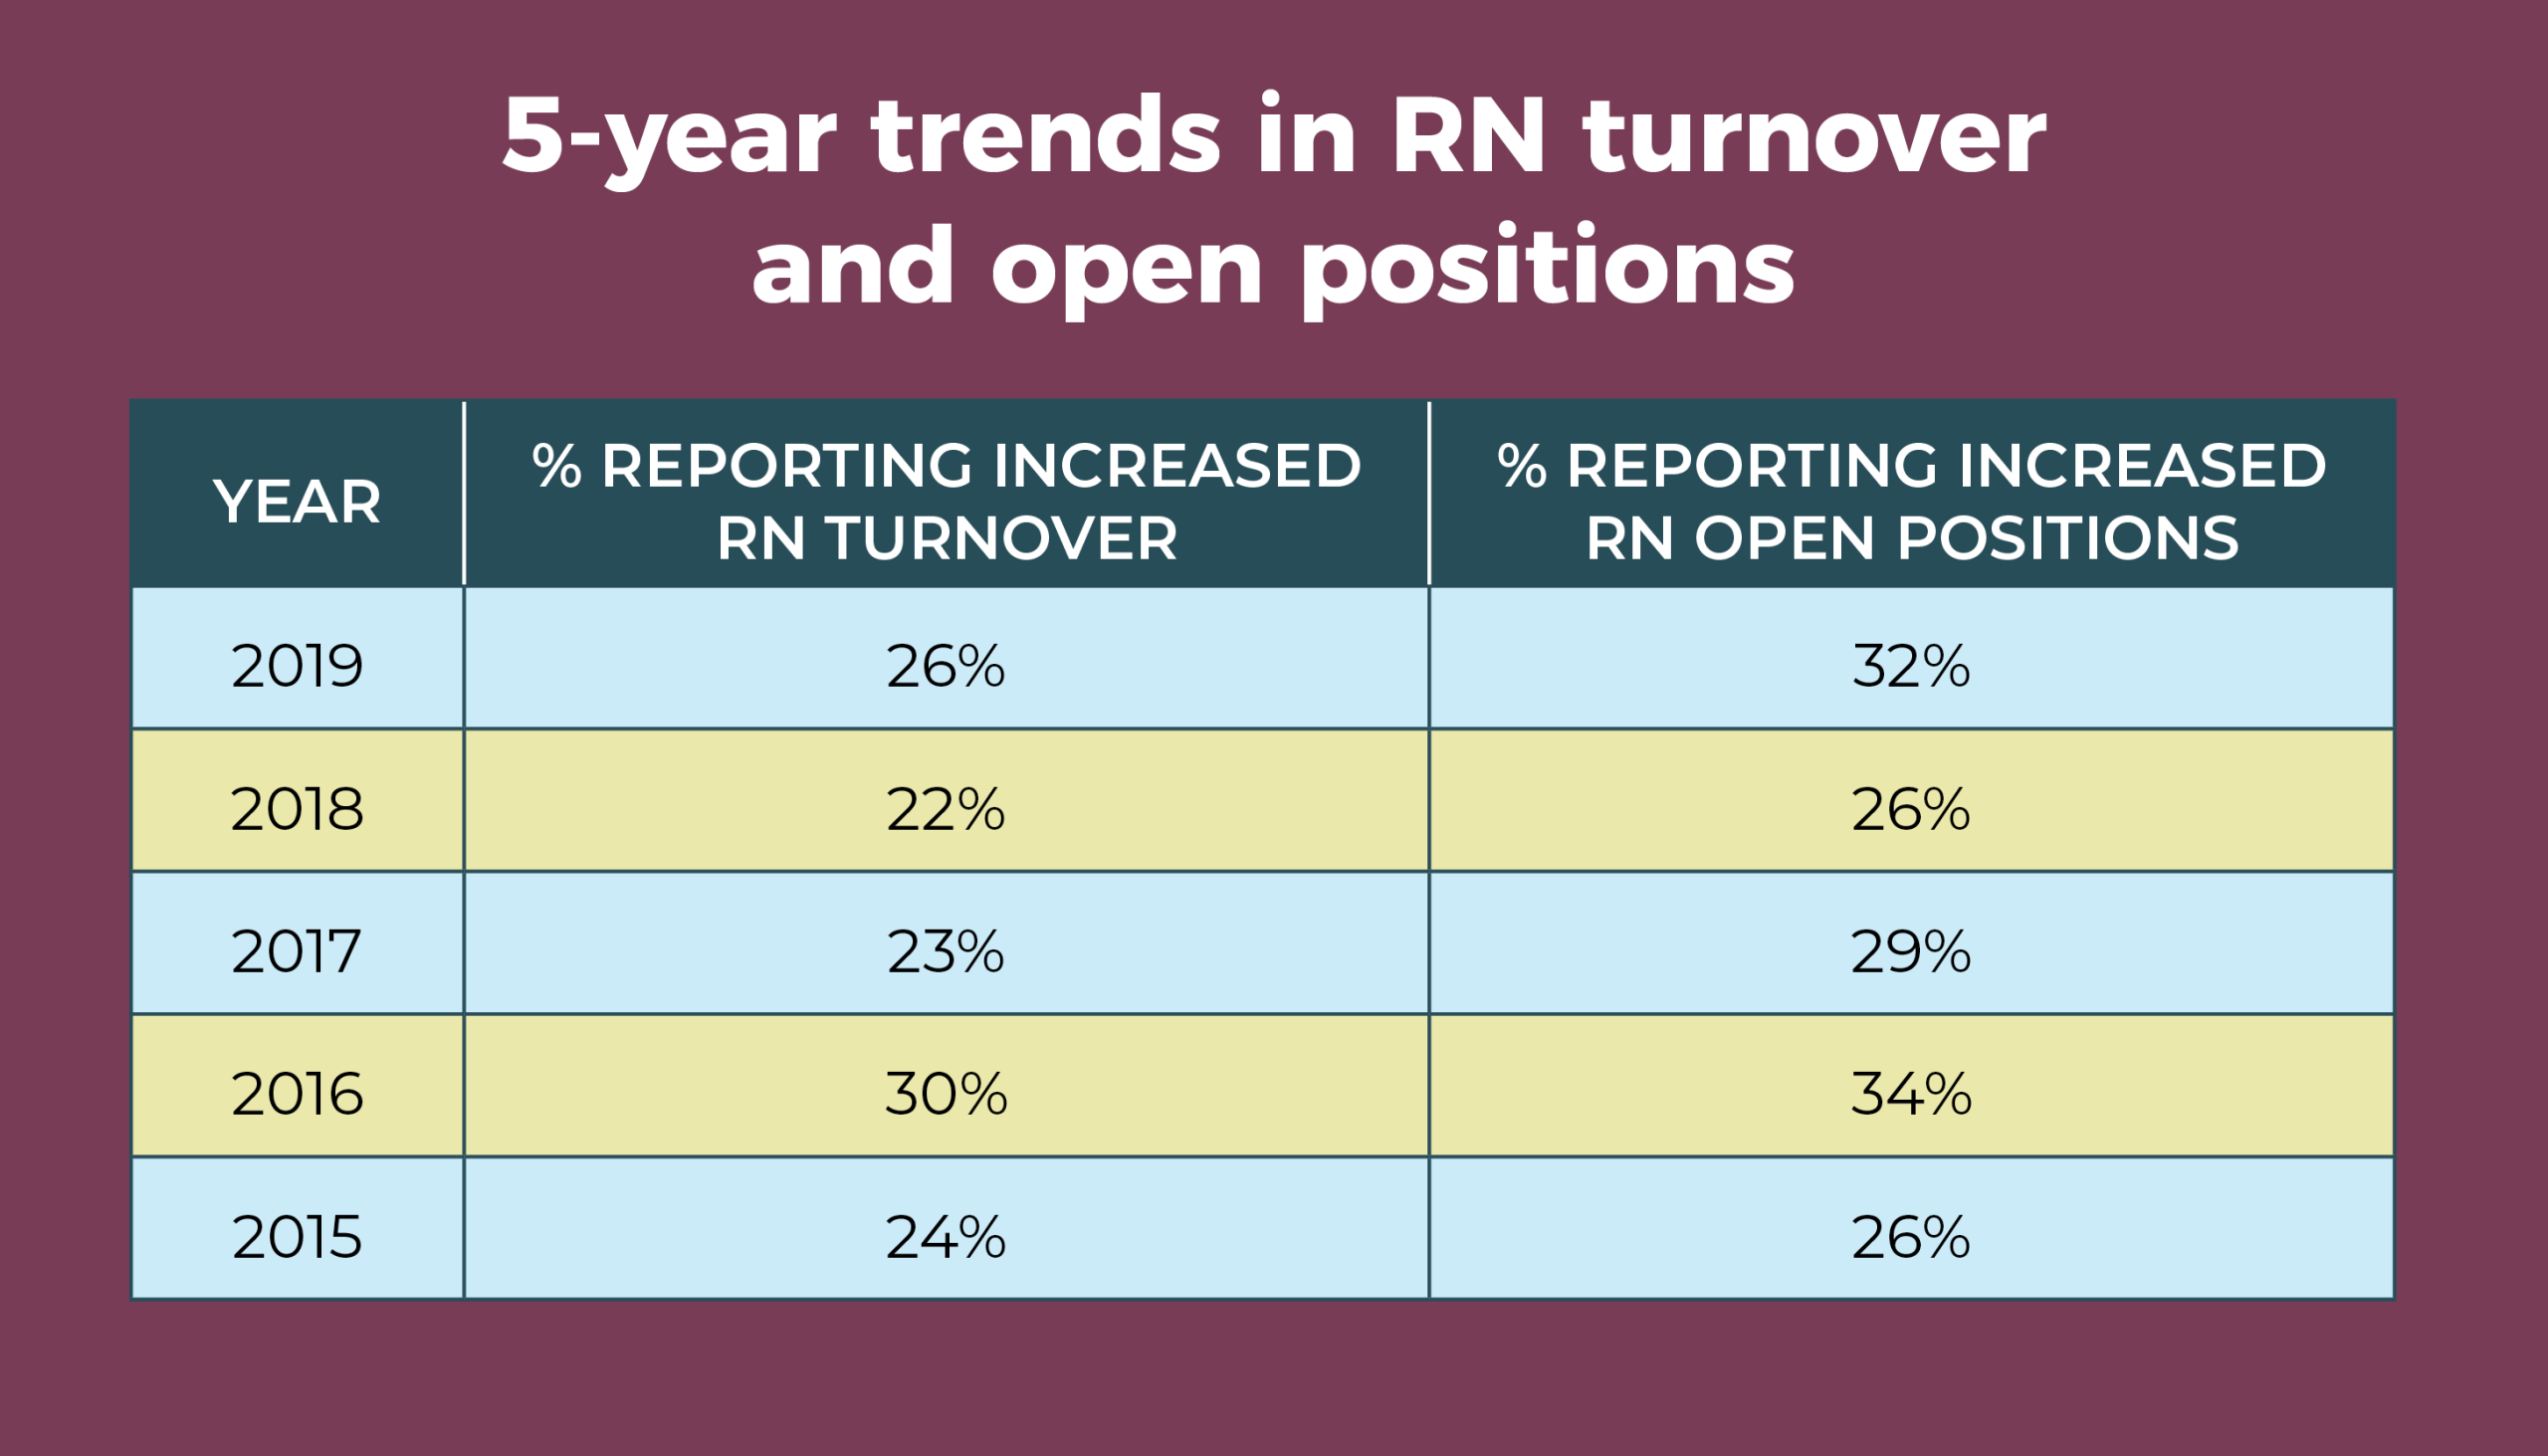
Despite a reduction in overall mobility, staff transitions plague nearly one-fourth of OR leaders, with 22% reporting increased RN turnover in the past 12 months (vs 34% in 2019), and 24% reporting increased ST turnover (vs 29% in 2019). The average turnover rate was 8% for RNs and 7% for STs.
These numbers are strikingly different from a decade ago, when only 7% of respondents experienced increased RN turnover and 10% reported increased ST turnover. In 2010, the average turnover rate was 7% for both RNs and STs.
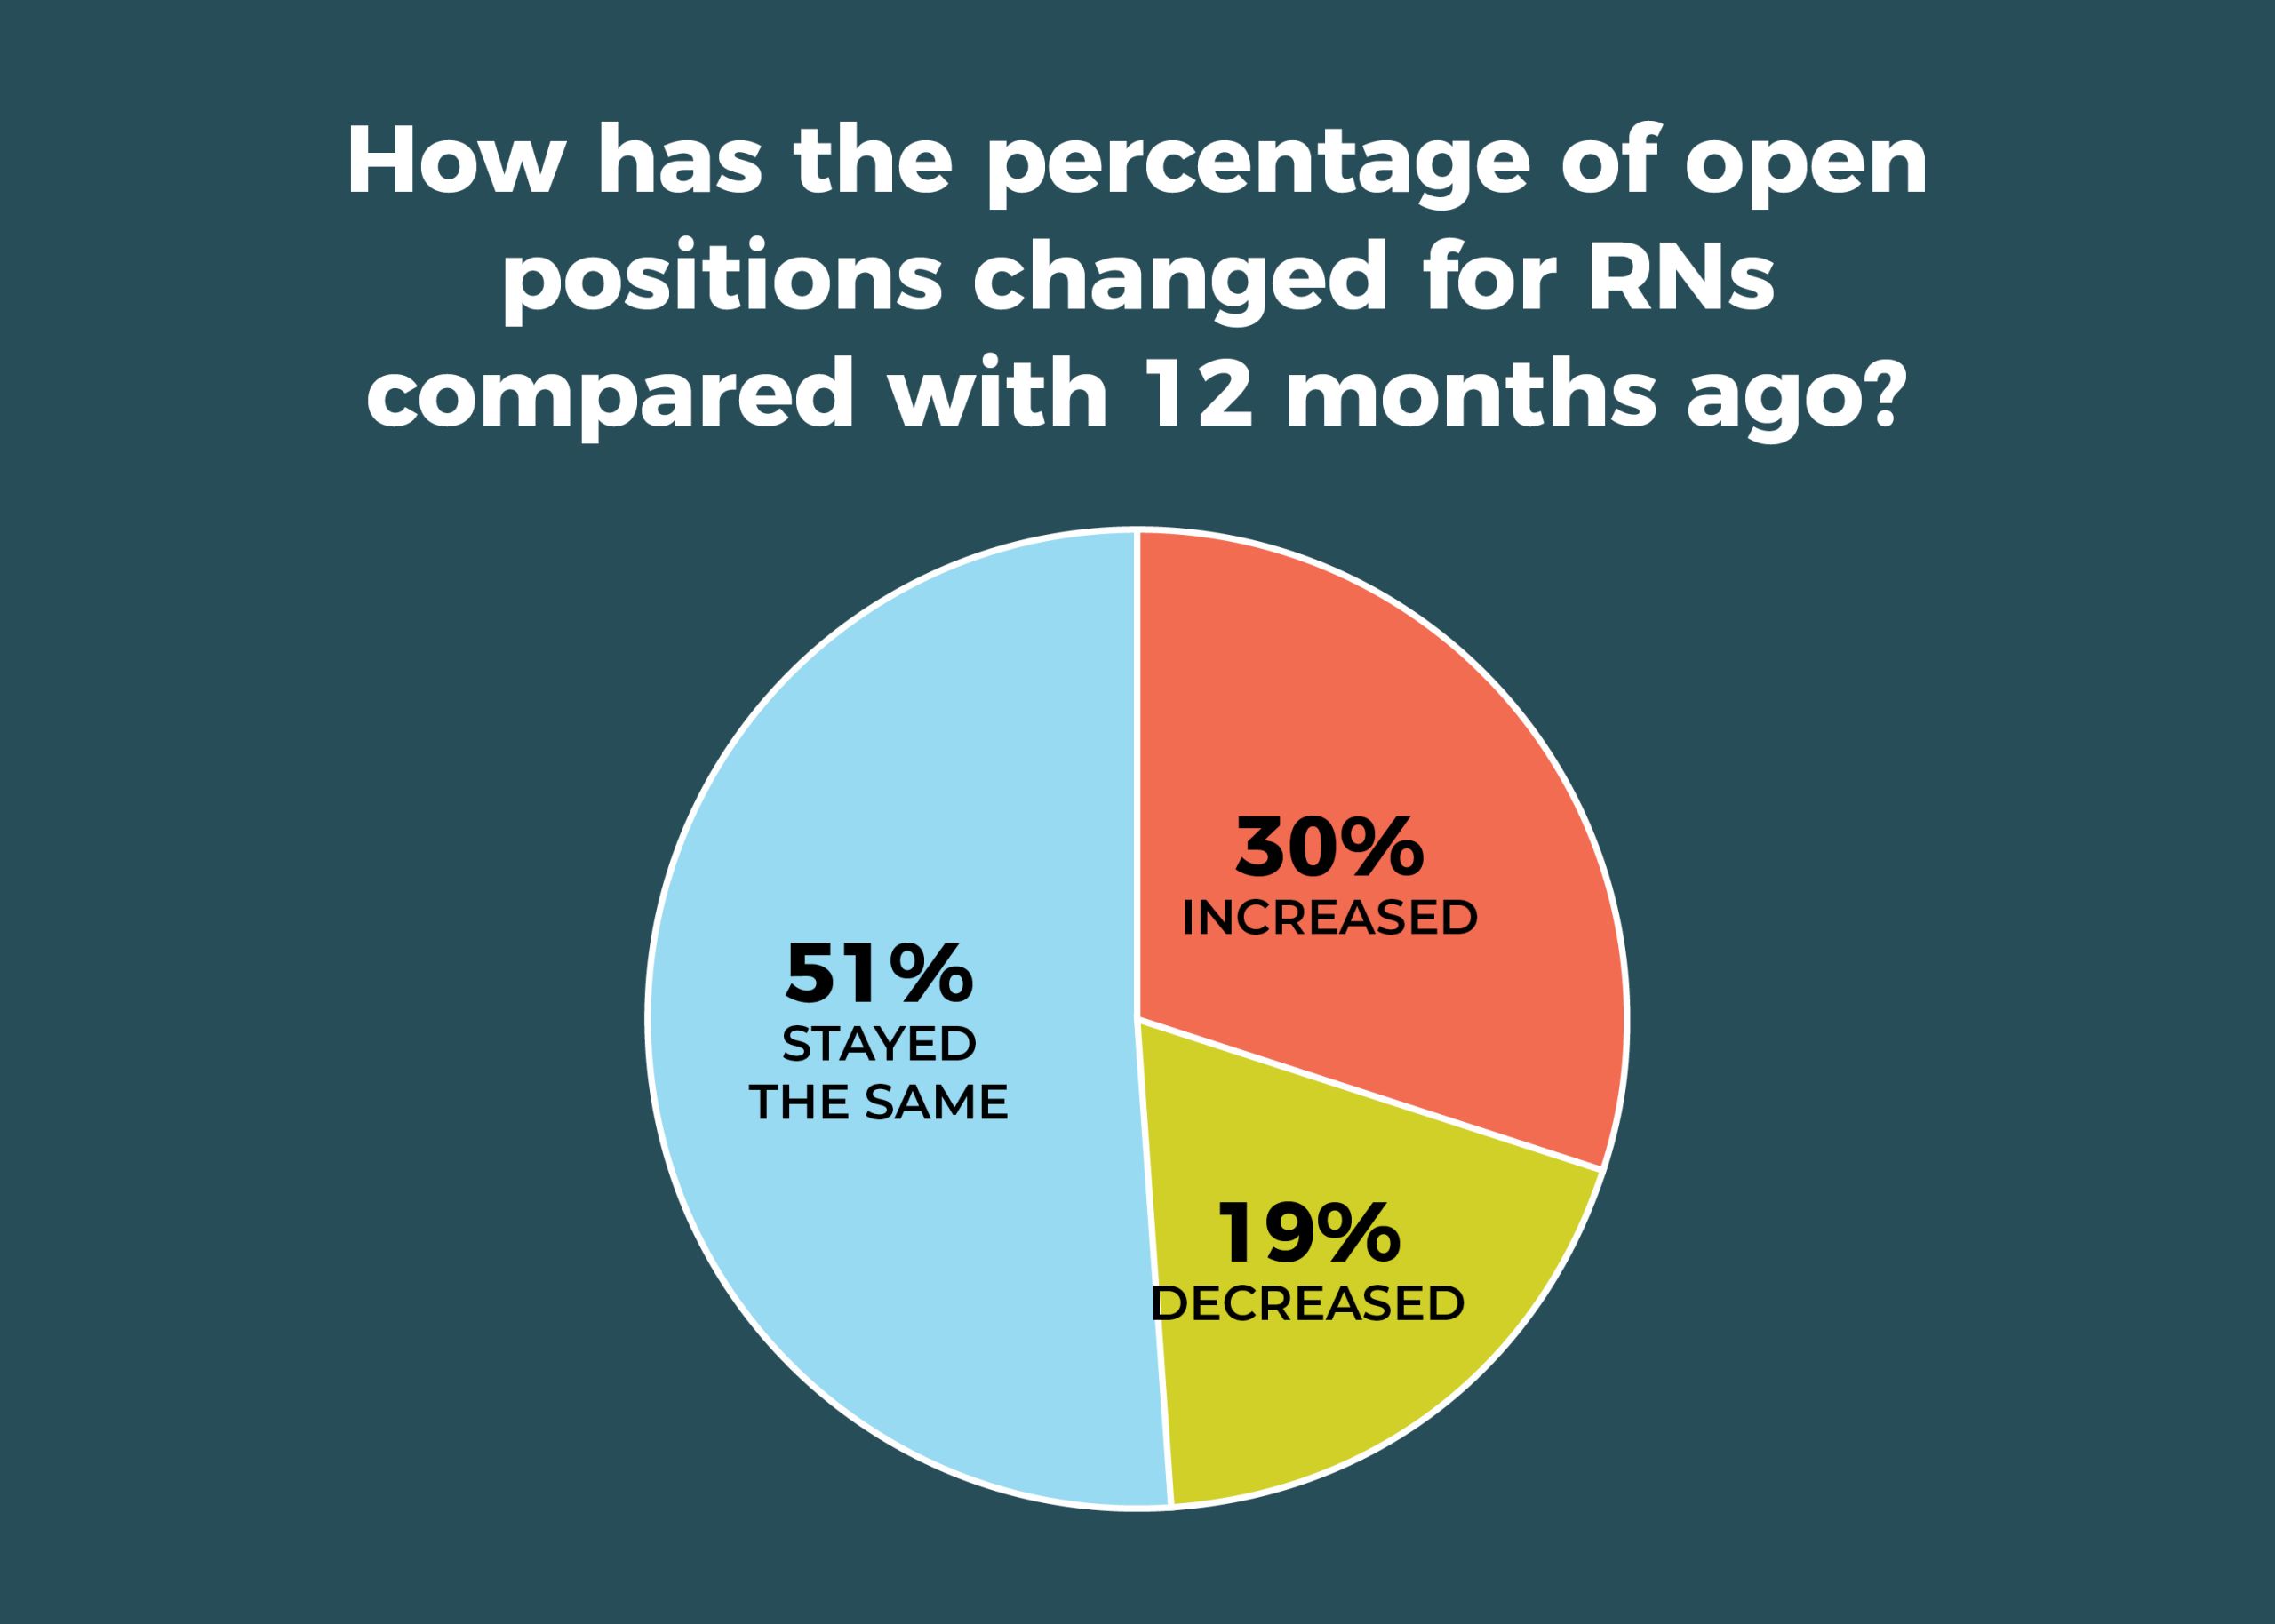
The percentage of open full-time equivalent (FTE) positions for RNs in the past 12 months increased for 30% of respondents, down from 37% last year; the number of open positions stayed the same for 51%, up from 41% last year. In all, 23% reported no open RN positions, compared to 27% last year. The average number of currently open RN positions was 6.
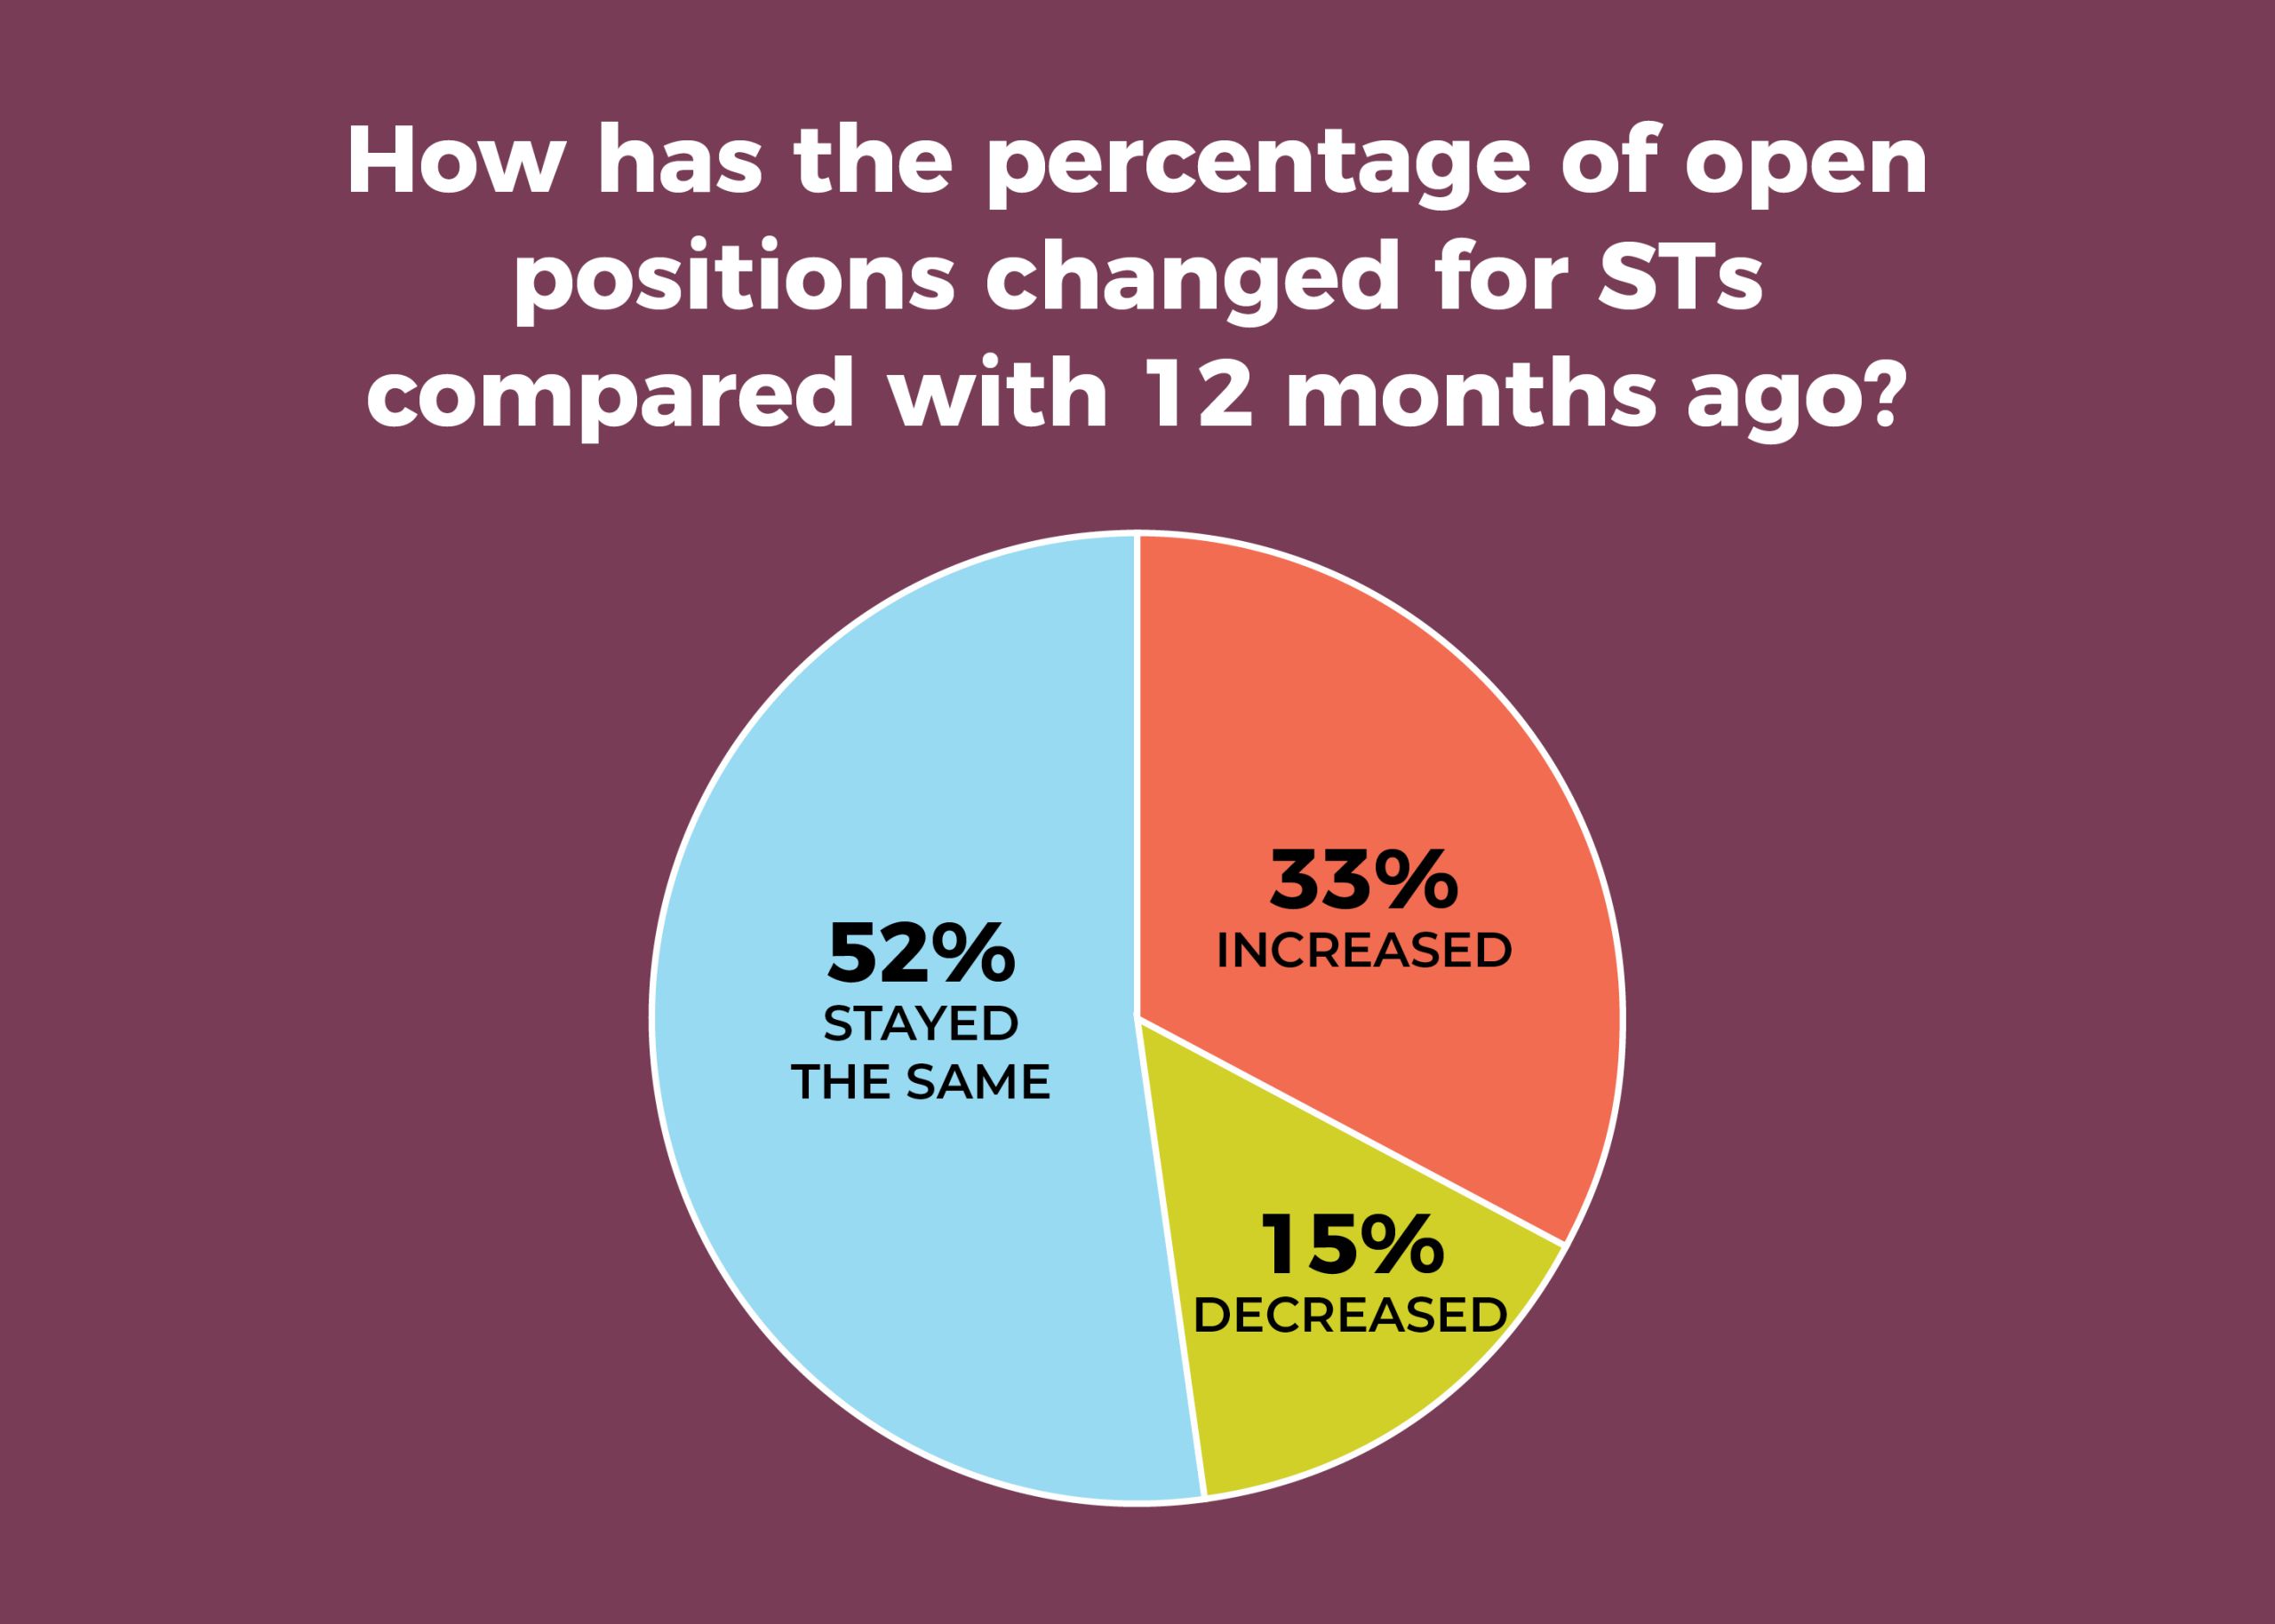
A third of OR leaders said the percentage of open FTE positions for STs increased in the past 12 months, comparable to the 34% reported last year; slightly more than half (52%) said it had remained the same, up from 47% in 2019. Overall, 29% had no open ST positions (vs 32% in 2019). The average number of currently open ST positions was 4.
Again, the picture was much different in 2010, when just 11% reported an increase in open FTE positions for both RNs and STs, and the percentage of those reporting no vacancies was significantly higher: 54% for RNs and 65% for STs. The average number of open positions was 2 for both RNs and STs.
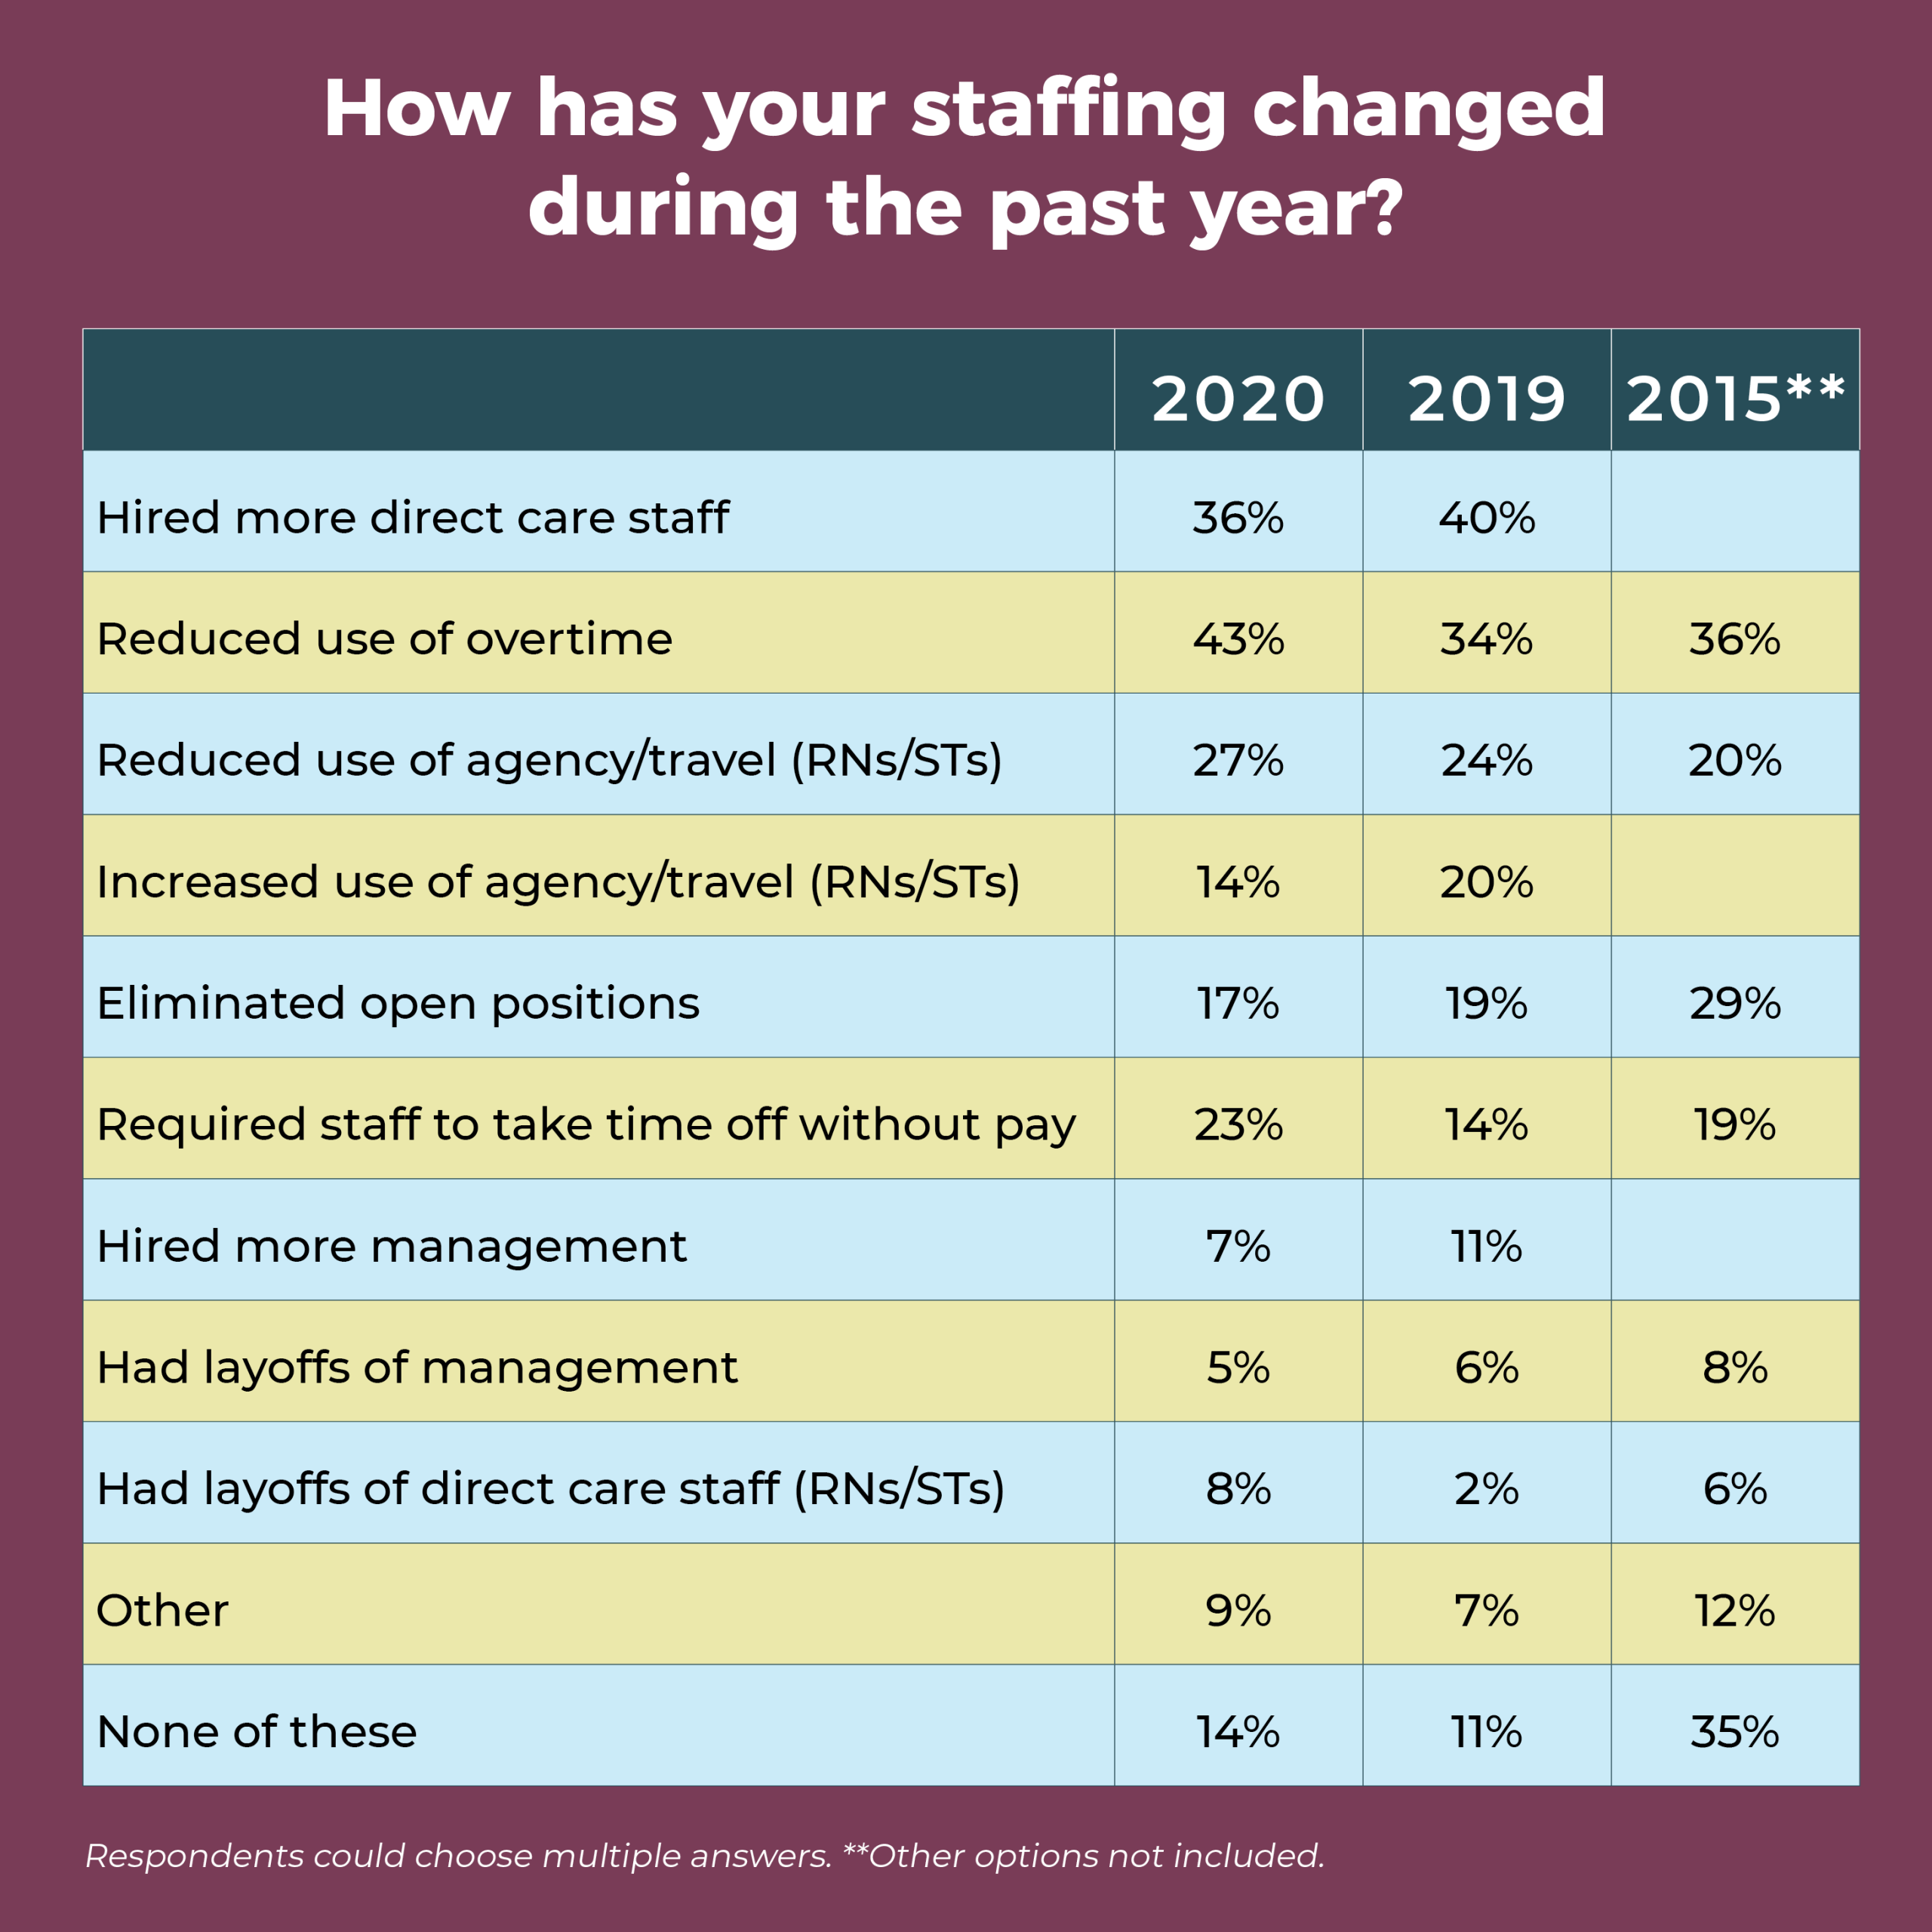
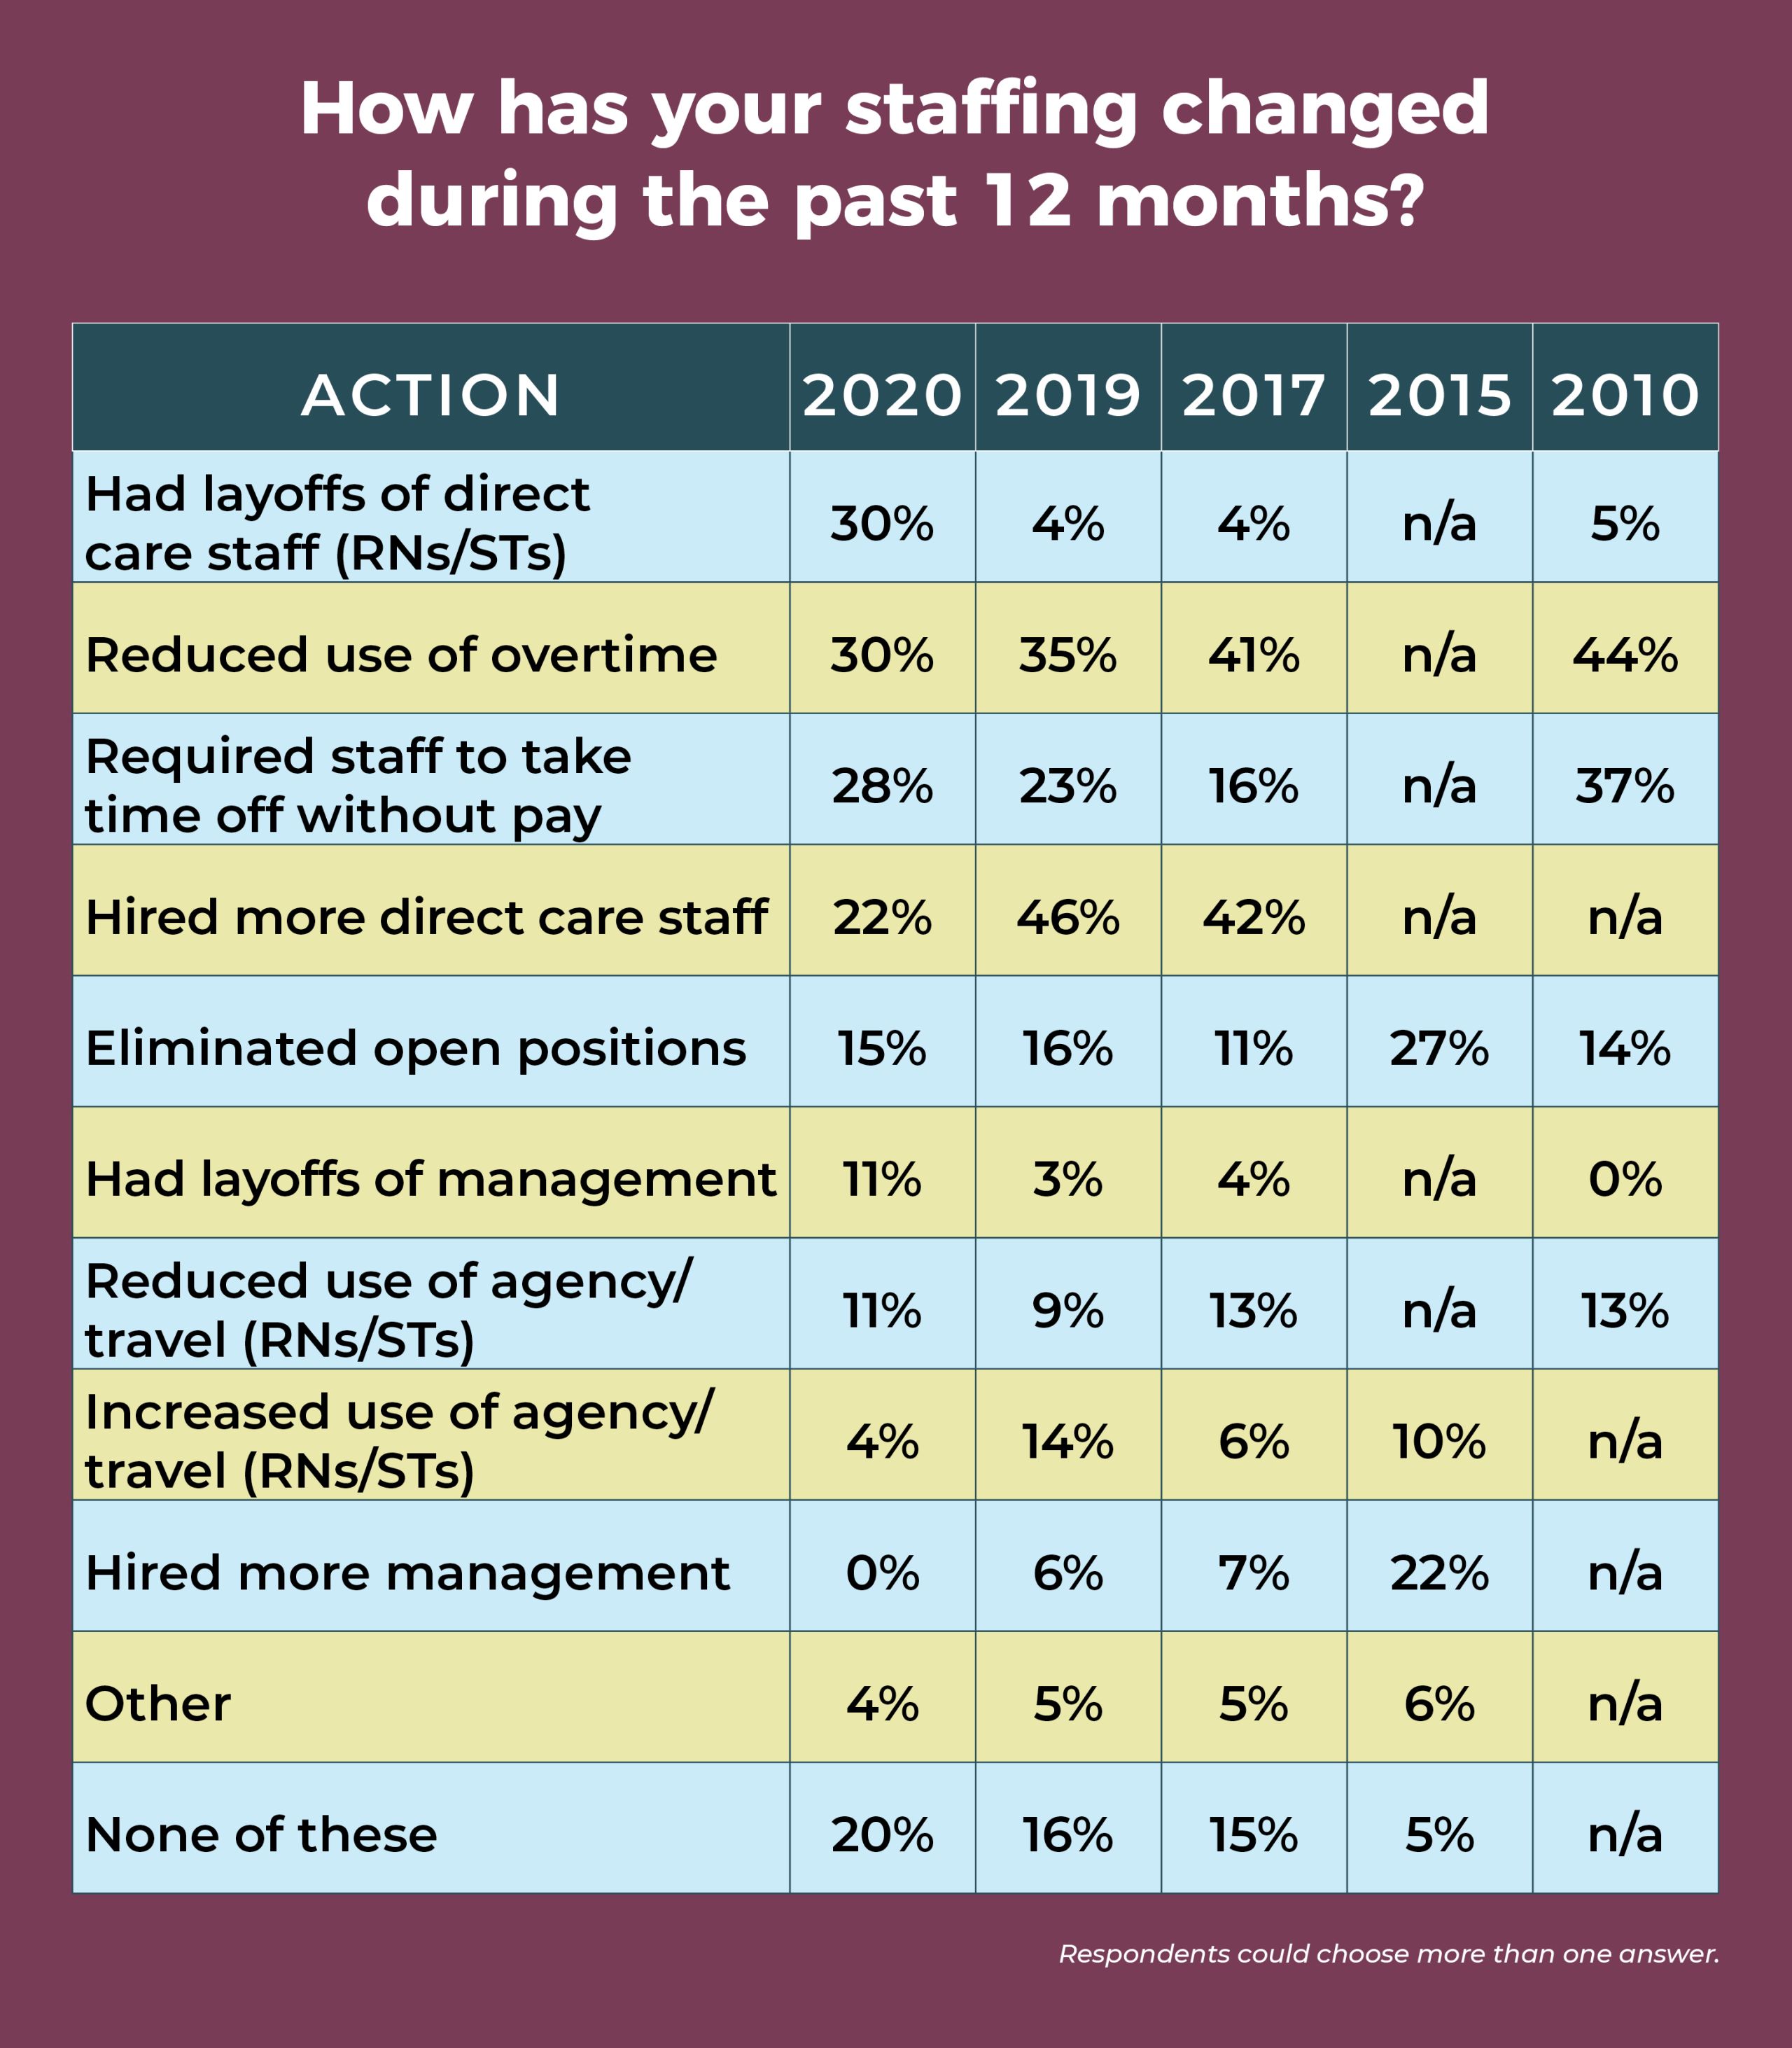
The most commonly reported staffing change in the past 12 months was reducing use of overtime, which increased from 34% in 2019 to 43% this year. Coming in second, at 36%, was hiring more direct care staff—down slightly from 40% last year, but comparable to 2018 (35%) and 2017 (34%). More than one-fourth (27%) reduced use of agency and travel staff, up from 20% last year. Nearly a quarter (23%) of respondents have required staff to take time off without pay, compared with only 14% in 2019 and 19% in 2015; but this percentage was 24% in 2017 and 39% in 2010.
More than 20 OR leaders answered “other” to this question, with most specifying changes related to COVID-19, such as furloughing and redeploying staff.


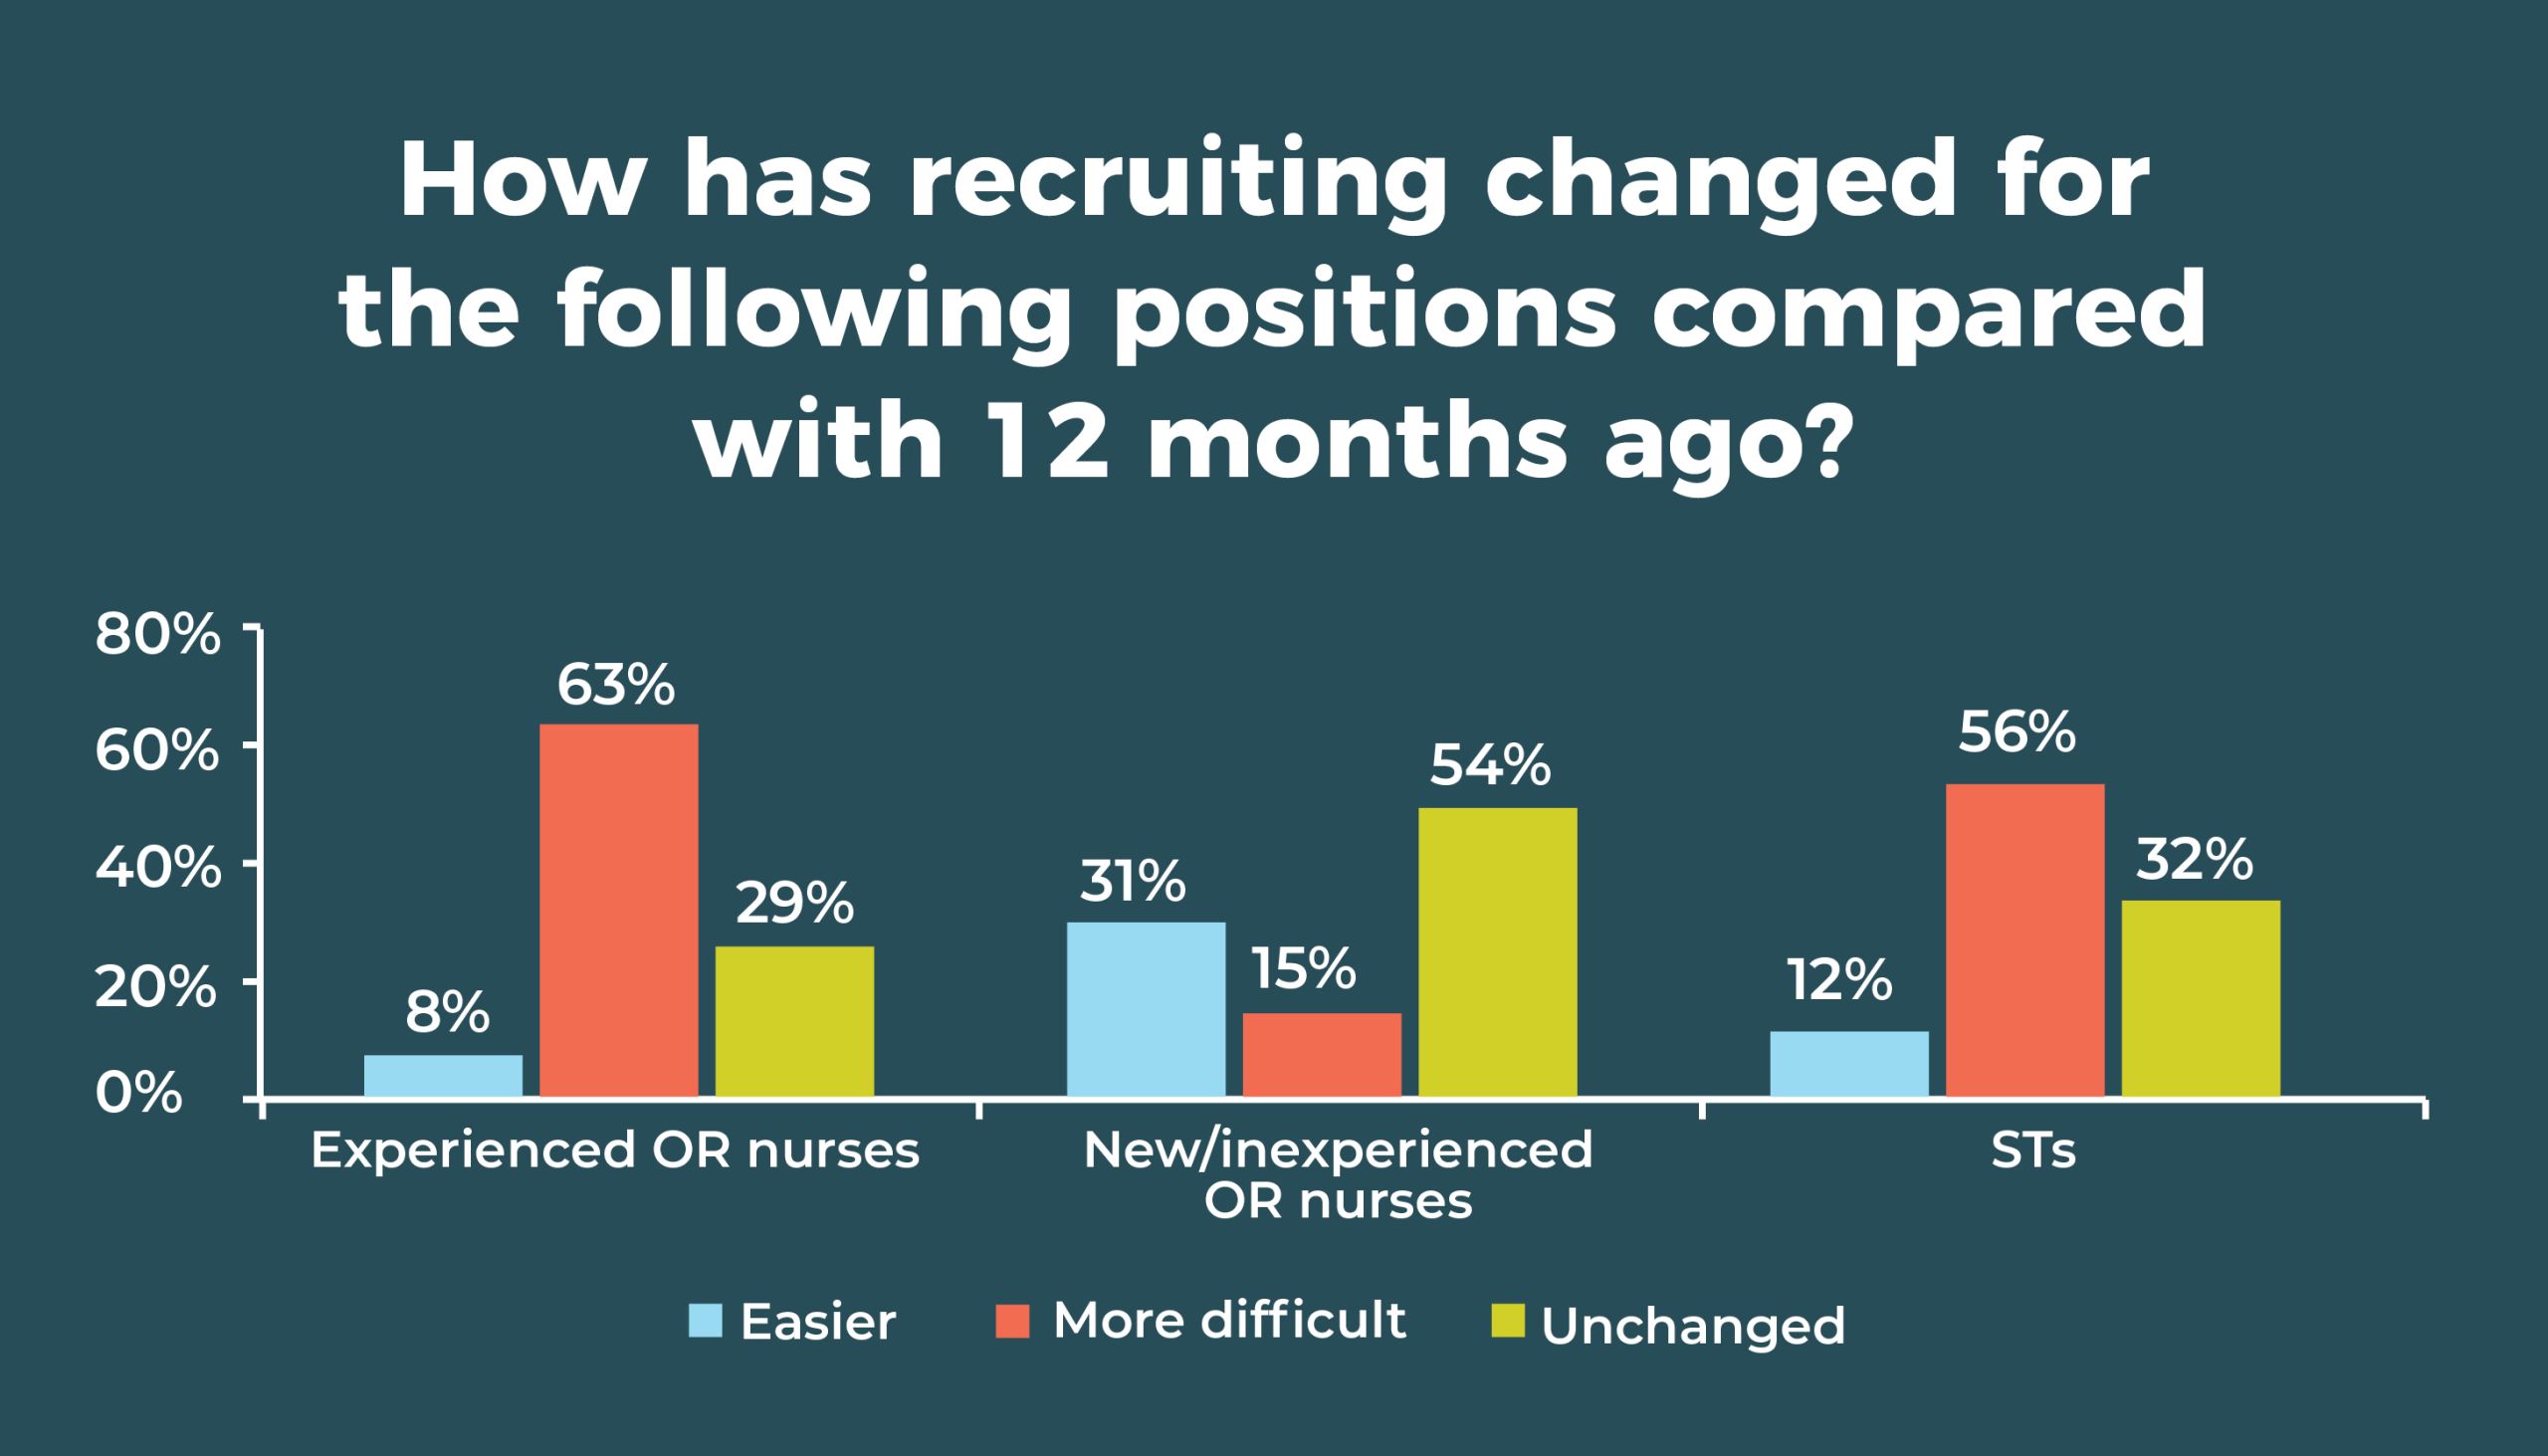


Recruiting experienced OR nurses remains a challenge, with nearly two-thirds (63%) saying difficulty has increased in the past 12 months, compared to 67% in 2019. Only 8% said it was easier (vs 5% last year). OR leaders are having better luck with new or inexperienced OR nurses: 31% (vs 28% in 2019) said it has been easier to recruit this group; only 15% said it was more difficult, down from 26% in 2019.
Recruiting was a bit easier 10 years ago, when 26% of respondents found recruiting experienced OR nurses to be more difficult.
When evaluating candidates, 64% of OR leaders require an associate degree in nursing (ADN), compared to 59% in 2019 and 57% in 2018, and 41% require a baccalaureate degree in nursing (BSN), comparable to the 45% reported last year and 44% in 2018. Only 10% require certification (vs 12% in 2019), and 6% don’t require either a degree or certification, down from 10% last year.
As in 2019, more than half (56% vs 51% last year and 38% in 2015) of respondents are finding it more difficult to recruit STs, and only 12% said it was easier, compared with 9% in 2019 and 17% in 2015.


Nearly half (46%) of respondents said that surgical volume increased in the past 12 months, compared to 40% in 2019. The pandemic may have affected the higher percentage of those reporting an increase (30% vs 18% in 2019).
ERAS remains the most popular of the care model options asked about in the survey, with 46% (vs 53% in 2019) saying it has been implemented or is planned to be implemented in the next 6 months. The next highest was Accountable Care Organizations (25%), followed by clinically integrated networks (17%) and the PSH (15%).
Artificial intelligence (AI) has exploded over the past year, so we asked respondents about its impact on surgery in general and on their own organizations. In all, 214 OR leaders responded to this open-ended question, with most reporting that AI has had no or minimal impact on their organization. However, a few are already putting it to use. One noted: “[It] will be used to start our new total joint program. AI will be used to select patients who will be able to go home the day of surgery.” Another OR leader reported: “[It is] presently helping predict which patients can go home after surgery instead of staying in the hospital.”
Several commented on the possible value of AI, including reducing length of stay, predicting case times more accurately, and improving scheduling, which, in turn, could improve productivity and revenue. Other comments were:
- “I see it as a positive thing: I think this pandemic has shown us what we can do. Hope we expand on this more.”
- “Reading about AI brings many questions about how soon it will take over healthcare, especially radiology and other tech type jobs. It may eliminate rural healthcare workers.”
- “Will affect diagnostics for years to come; will be used in GI endoscopy to analyze polyps and polyp removed borders.”
- “Eventual elimination of surgical tech jobs to be replaced by AI.”
- "It can help take out the guesswork and perfect certain things to provide safer quality care utilizing data to analyze and act upon.”
We also asked how the migration of traditionally inpatient procedures (for example, total joints, spine, and cardiac procedures) from the hospital to ambulatory care settings was affecting OR leaders and their organizations. Again, 214 responded. Most are not seeing many effects, although some anticipate that could change in the future.
Others report decreased volume, and some are in transition so were unable to respond. One respondent called the trend “disruptive, challenging,” and another said it had been “financially devastating.”
Some trends have changed rather a lot in the past 10 years, whereas others have stayed relatively stable. However, COVID-19 continues to have a dramatic impact on the healthcare industry. Although it’s hard to know how different OR managers’ jobs will look a year from now, it’s safe to say that skills such as resiliency and creativity will be more important than ever to lead teams through these challenging times.
Cynthia Saver, MS, RN, is president of CLS Development, Inc, Columbia, Maryland, which provides editorial services to healthcare publications.


Data for the OR Manager Salary/Career Survey were collected from April 14 to June 5, 2020. The survey list comprised OR directors, managers, or similar positions within hospital ORs. The survey was closed with 265 usable responses. The margin of error is ±5 percentage points at the 95% confidence level.

OR Manager thanks those who generously took time to complete this year’s survey. We appreciate your help in gathering this information, which will be useful to your colleagues around the country.

In all, 214 respondents answered the question, how has COVID-19 affected your facility and your staff? More than two-thirds (68%) reported reduced case volume, often because elective surgical procedures had been stopped. OR leaders noted volume reductions as high as 90%.
A few respondents reported they were back in business or shared changes they had implemented:
- “Almost total shutdown in March. Now we are testing every patient, so this has allowed us to reopen.”
- “We are more cognizant of infection control practices; social distancing implemented, not allowing family to wait in lobby or be in treatment area.”
Understandably, volume reductions have resulted in significant financial losses. For example, one OR leader reported “$25M loss in revenue due to no elective surgery rule and impact on other OP services (lab, radiology, pharmacy, etc).”
More than half cited staffing fallout from COVID-19, with furloughs, reduced hours, and redeployments the most common effects. Three OR leaders noted that staff had retired or resigned because of the pandemic.
Some staff took earned paid leave, thereby avoiding furloughs. Reported areas for redeployment for RNs included emergency departments and medical/surgical units, and one OR leader noted that the postanesthesia care unit was converted to an ICU for COVID-19 patients, which required hiring contract ICU nurses. Sample comments included:
- “We had to reduce hours for each employee by 10% for the months of April and May and continuing into June unless our caseload warrants full time.”
- “Furloughed 50% of staff.”
Thirteen OR leaders noted the psychological effects of the pandemic on staff, citing anxiety, fear, and frustration:
- “It has caused increased stress and tension among staff members. They seem to be more stressed in dealing with patients as well.”
- “The staff are overworked, tired, emotional, and exhausted.”
- “There has been tremendous stress: staff deployed to other units and working out of their comfort zones; increase in dealing with death and dying, without families present.”
- “Morale has been taxed.”
- “Staff morale is low; a lot of anxiety and stress.”
Six respondents cited supply difficulties, including insufficient personal protective equipment.
Perhaps one comment summed up the general feeling of many: “Devastated.”
But there was a note of optimism, with one respondent saying: “The facility has been impacted financially, but we will rebound.”

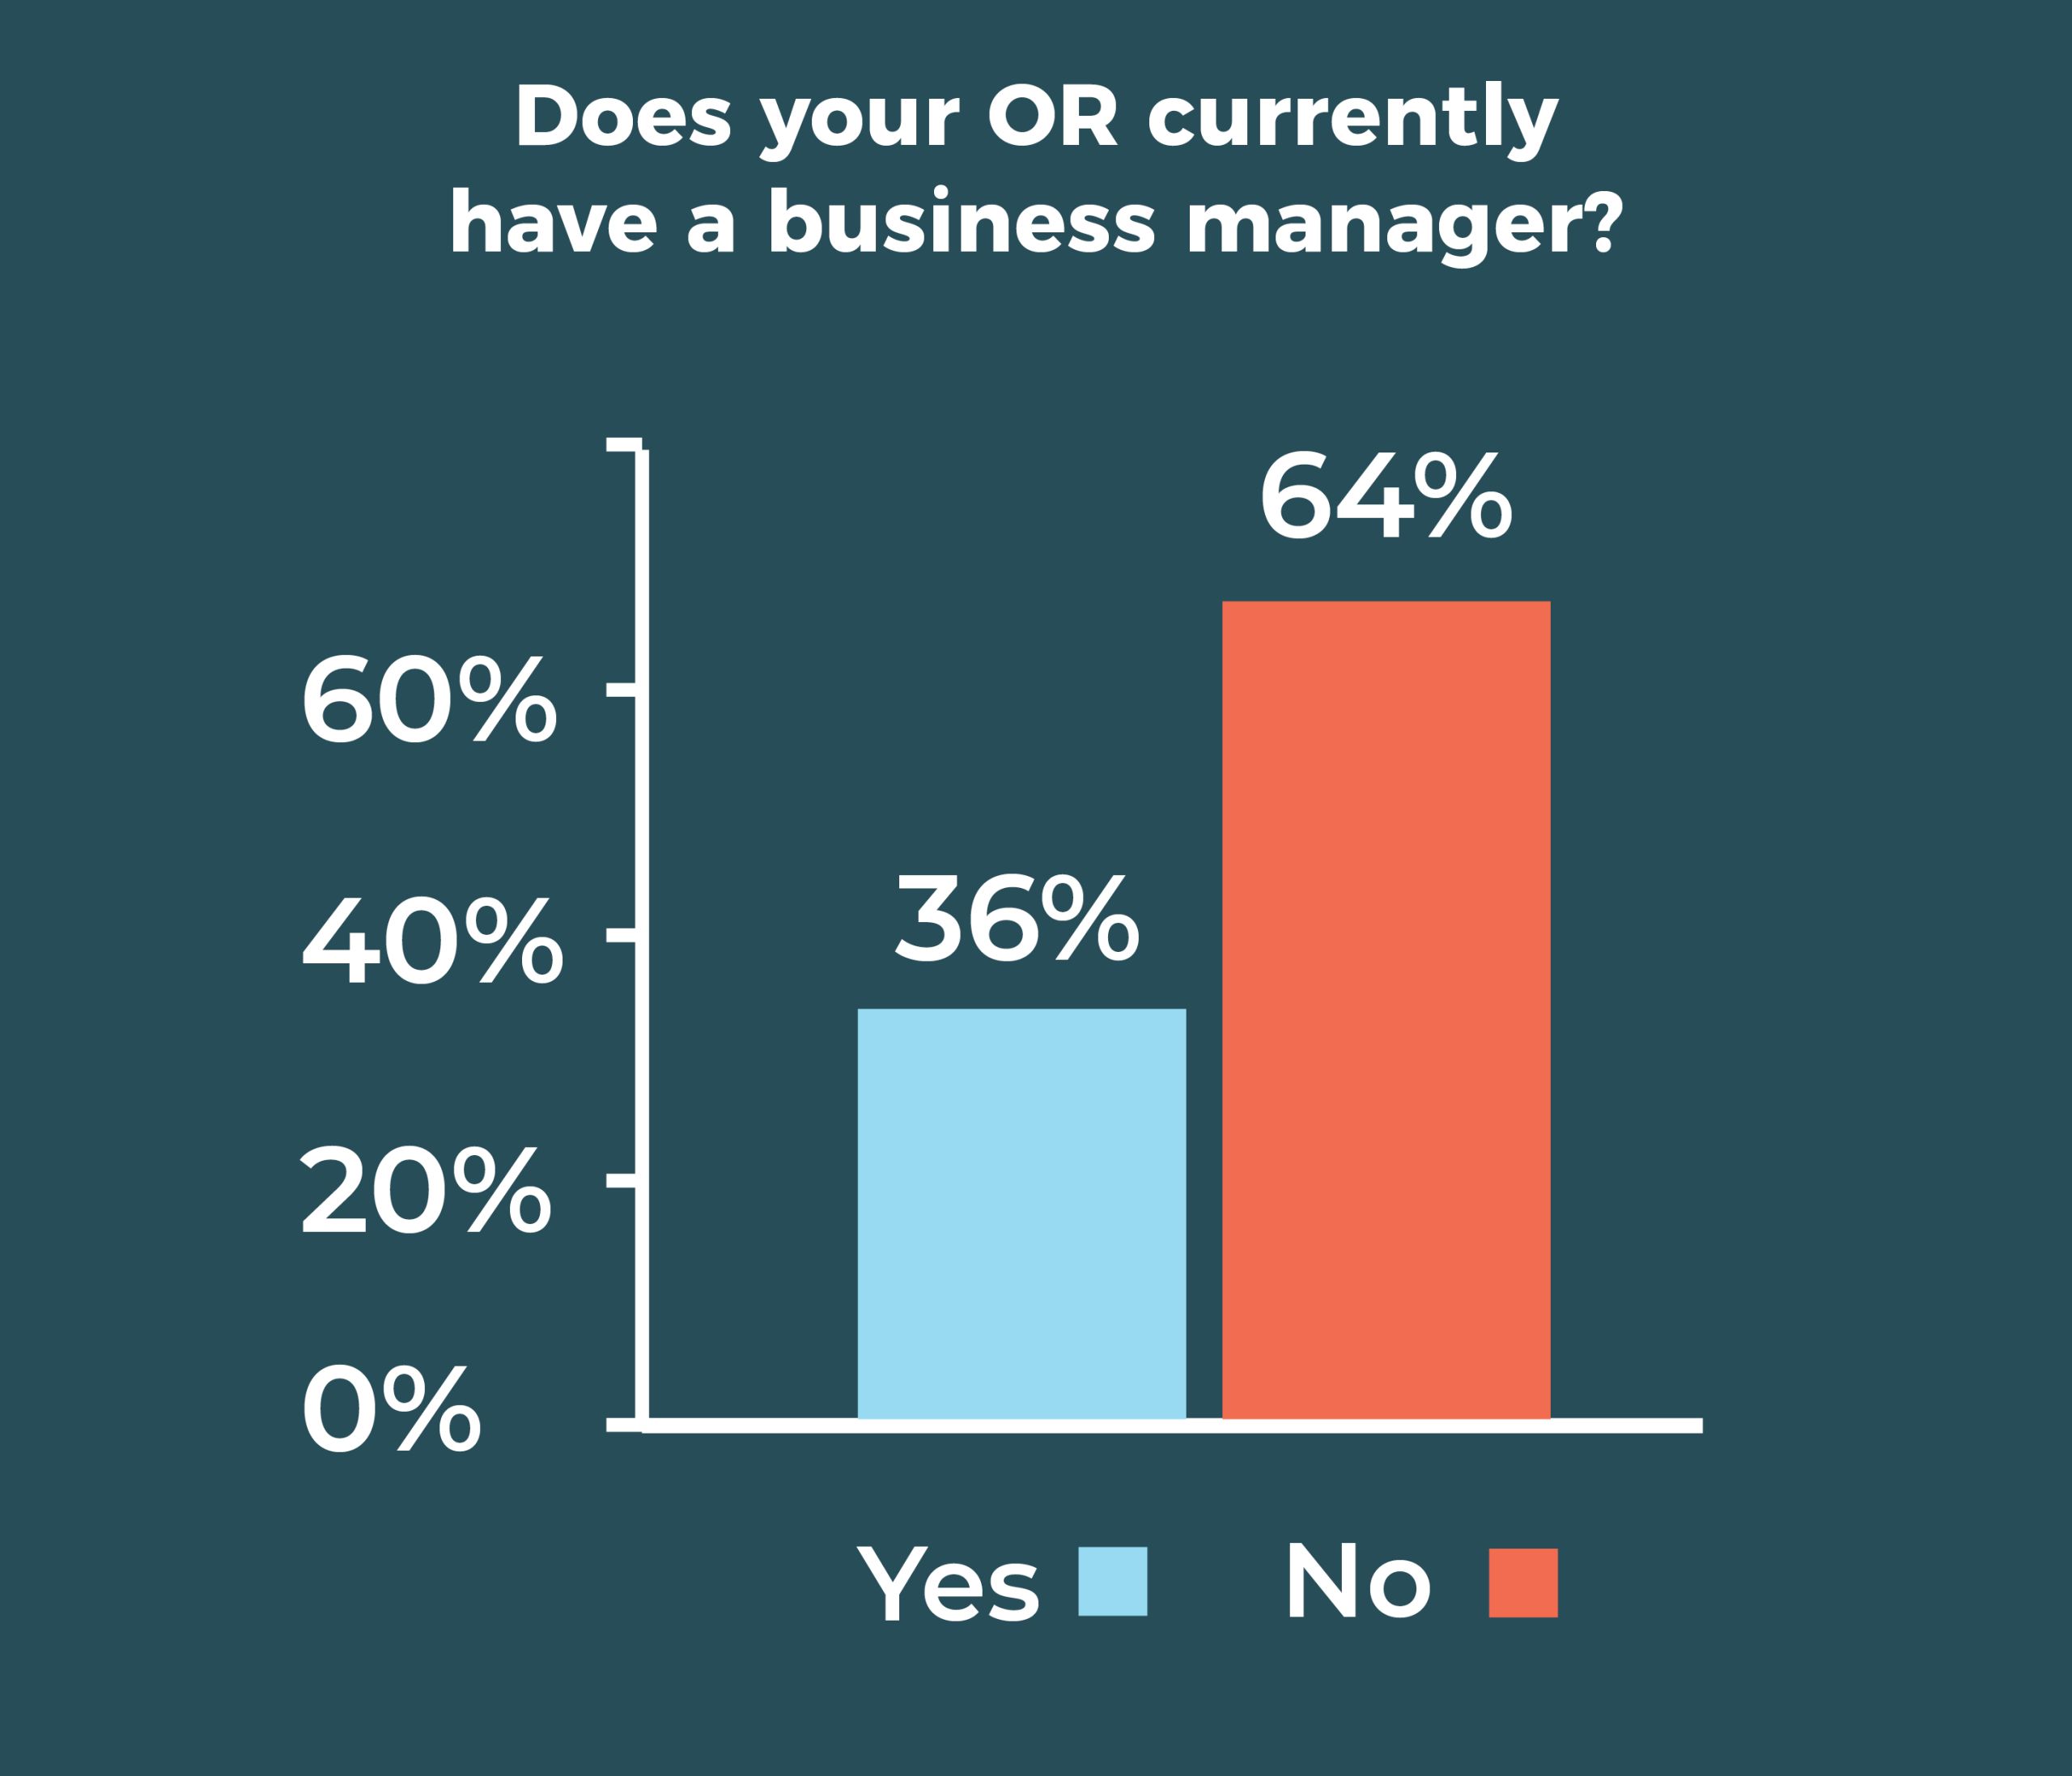
As we enter a new decade, it’s a good time to revisit some of the past business manager survey results.

This year, the percentage of respondents with a business manager fell slightly, from 43% in 2019 to 36% this year. Although that’s much higher than the 29% reported in 2015, it’s only slightly higher than the 34% from 2010. It remains to be seen what will move the role over the 50% mark.
As in years past, teaching hospitals are much more likely than community hospitals to employ a business manager (36% vs. 29%); however, more respondents chose “other” as their work setting than in previous years, so results should be interpreted cautiously.

Salary
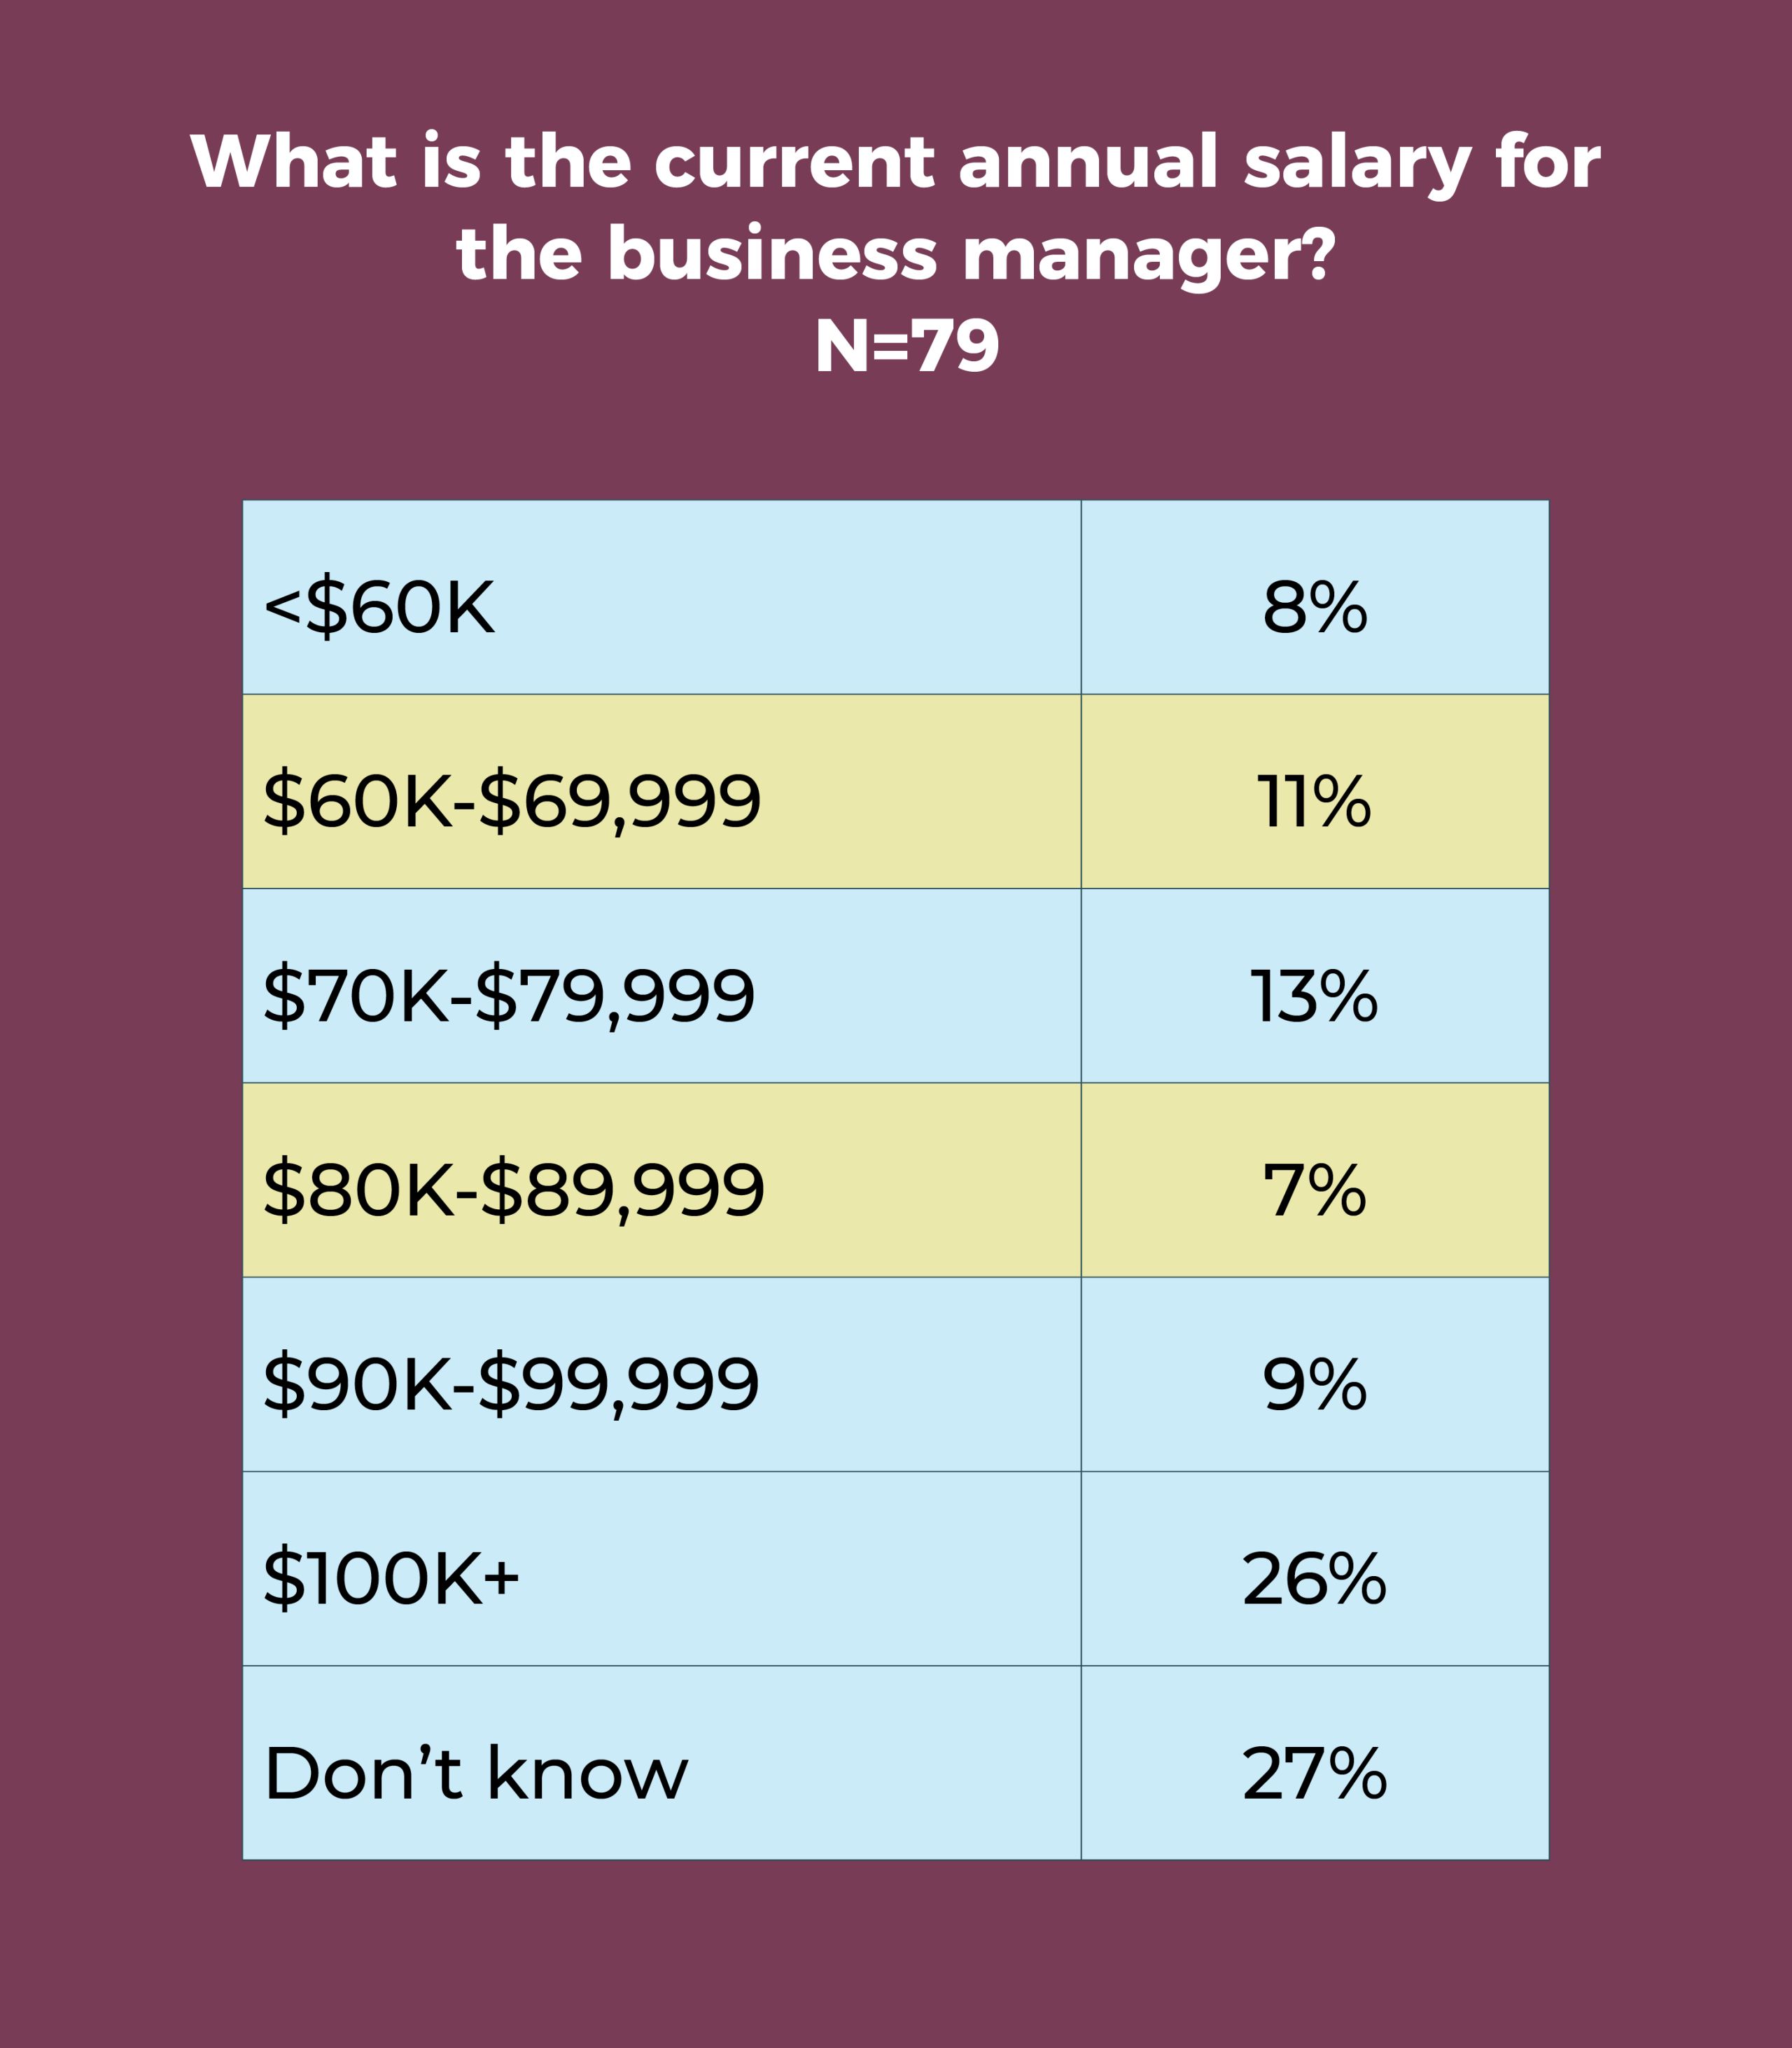
- Slightly more than one-fourth (26%) of business managers earn more than $100,000 annually, comparable to last year’s 27%. In 2010, only 8% earned more than six figures.
- Annual salaries of $90,000 to more than $100,000 a year were reported for about 35% of business managers, compared with 40% in 2019.
Requirements
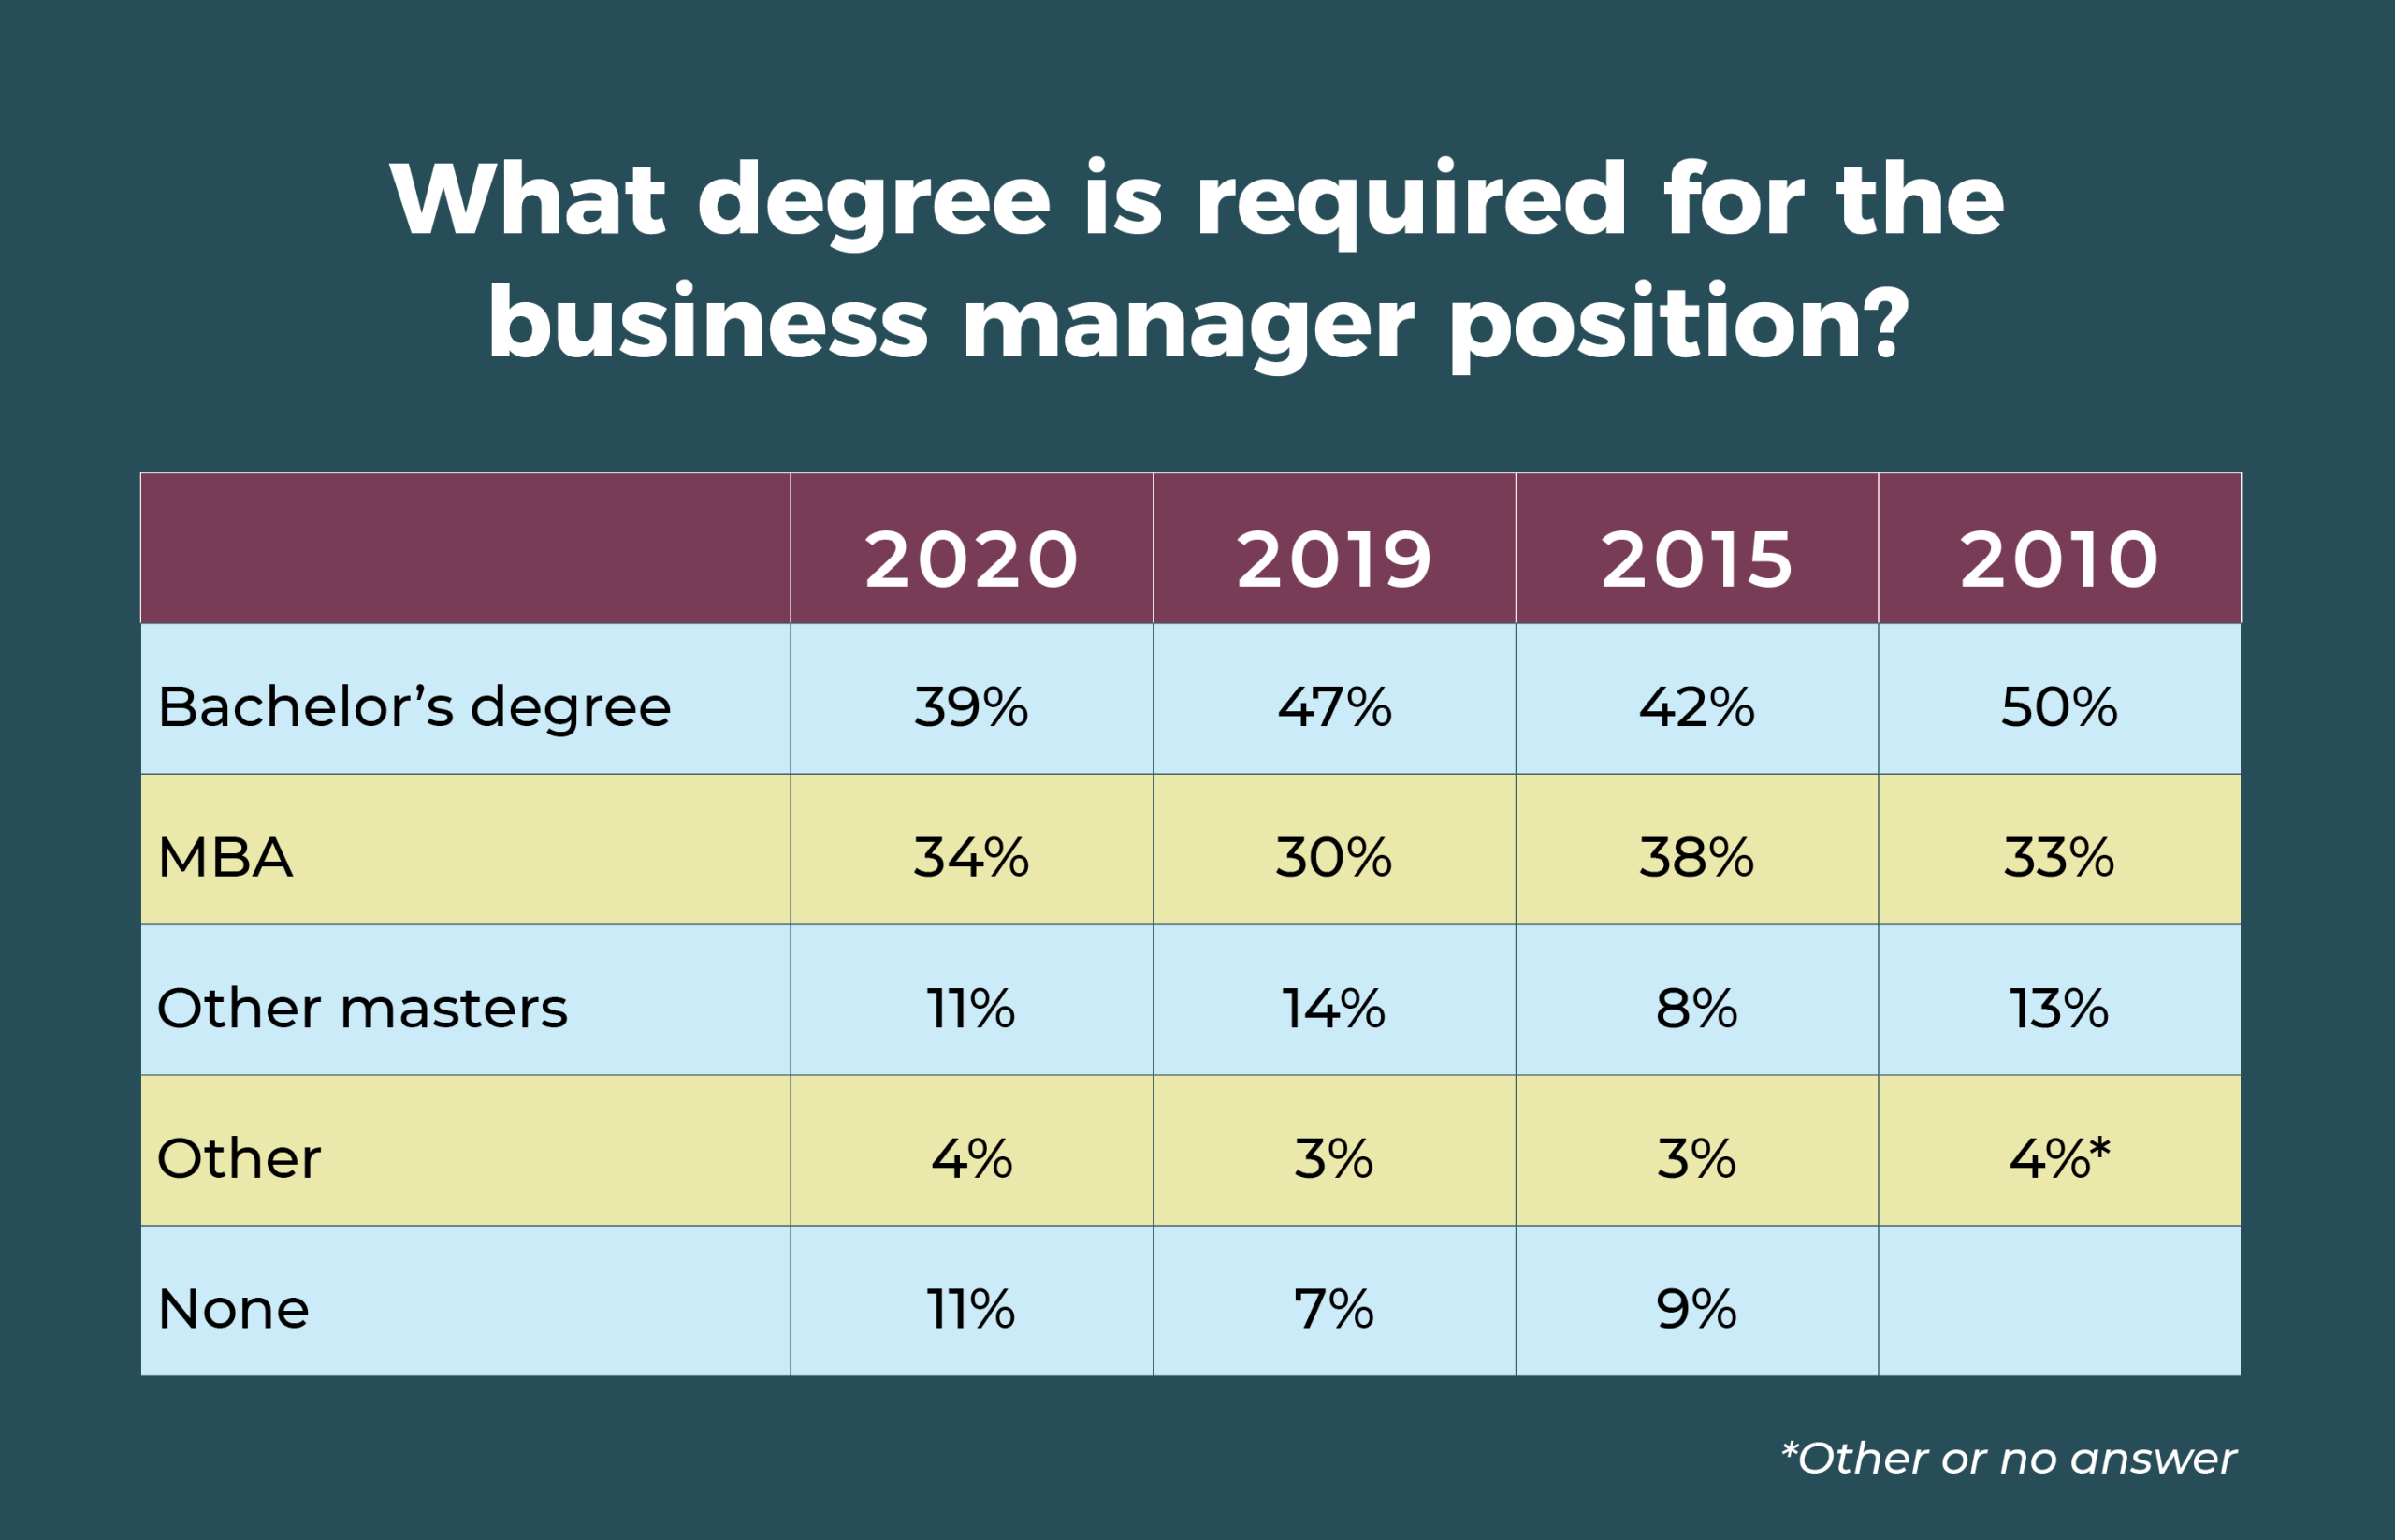
- Only 29% of OR leaders require business managers to have a clinical background, the same as what was reported in 2019, 2015, and 2010.
- A master’s degree has been the most commonly required degree for the position over the past 10 years.

Scope of responsibilities
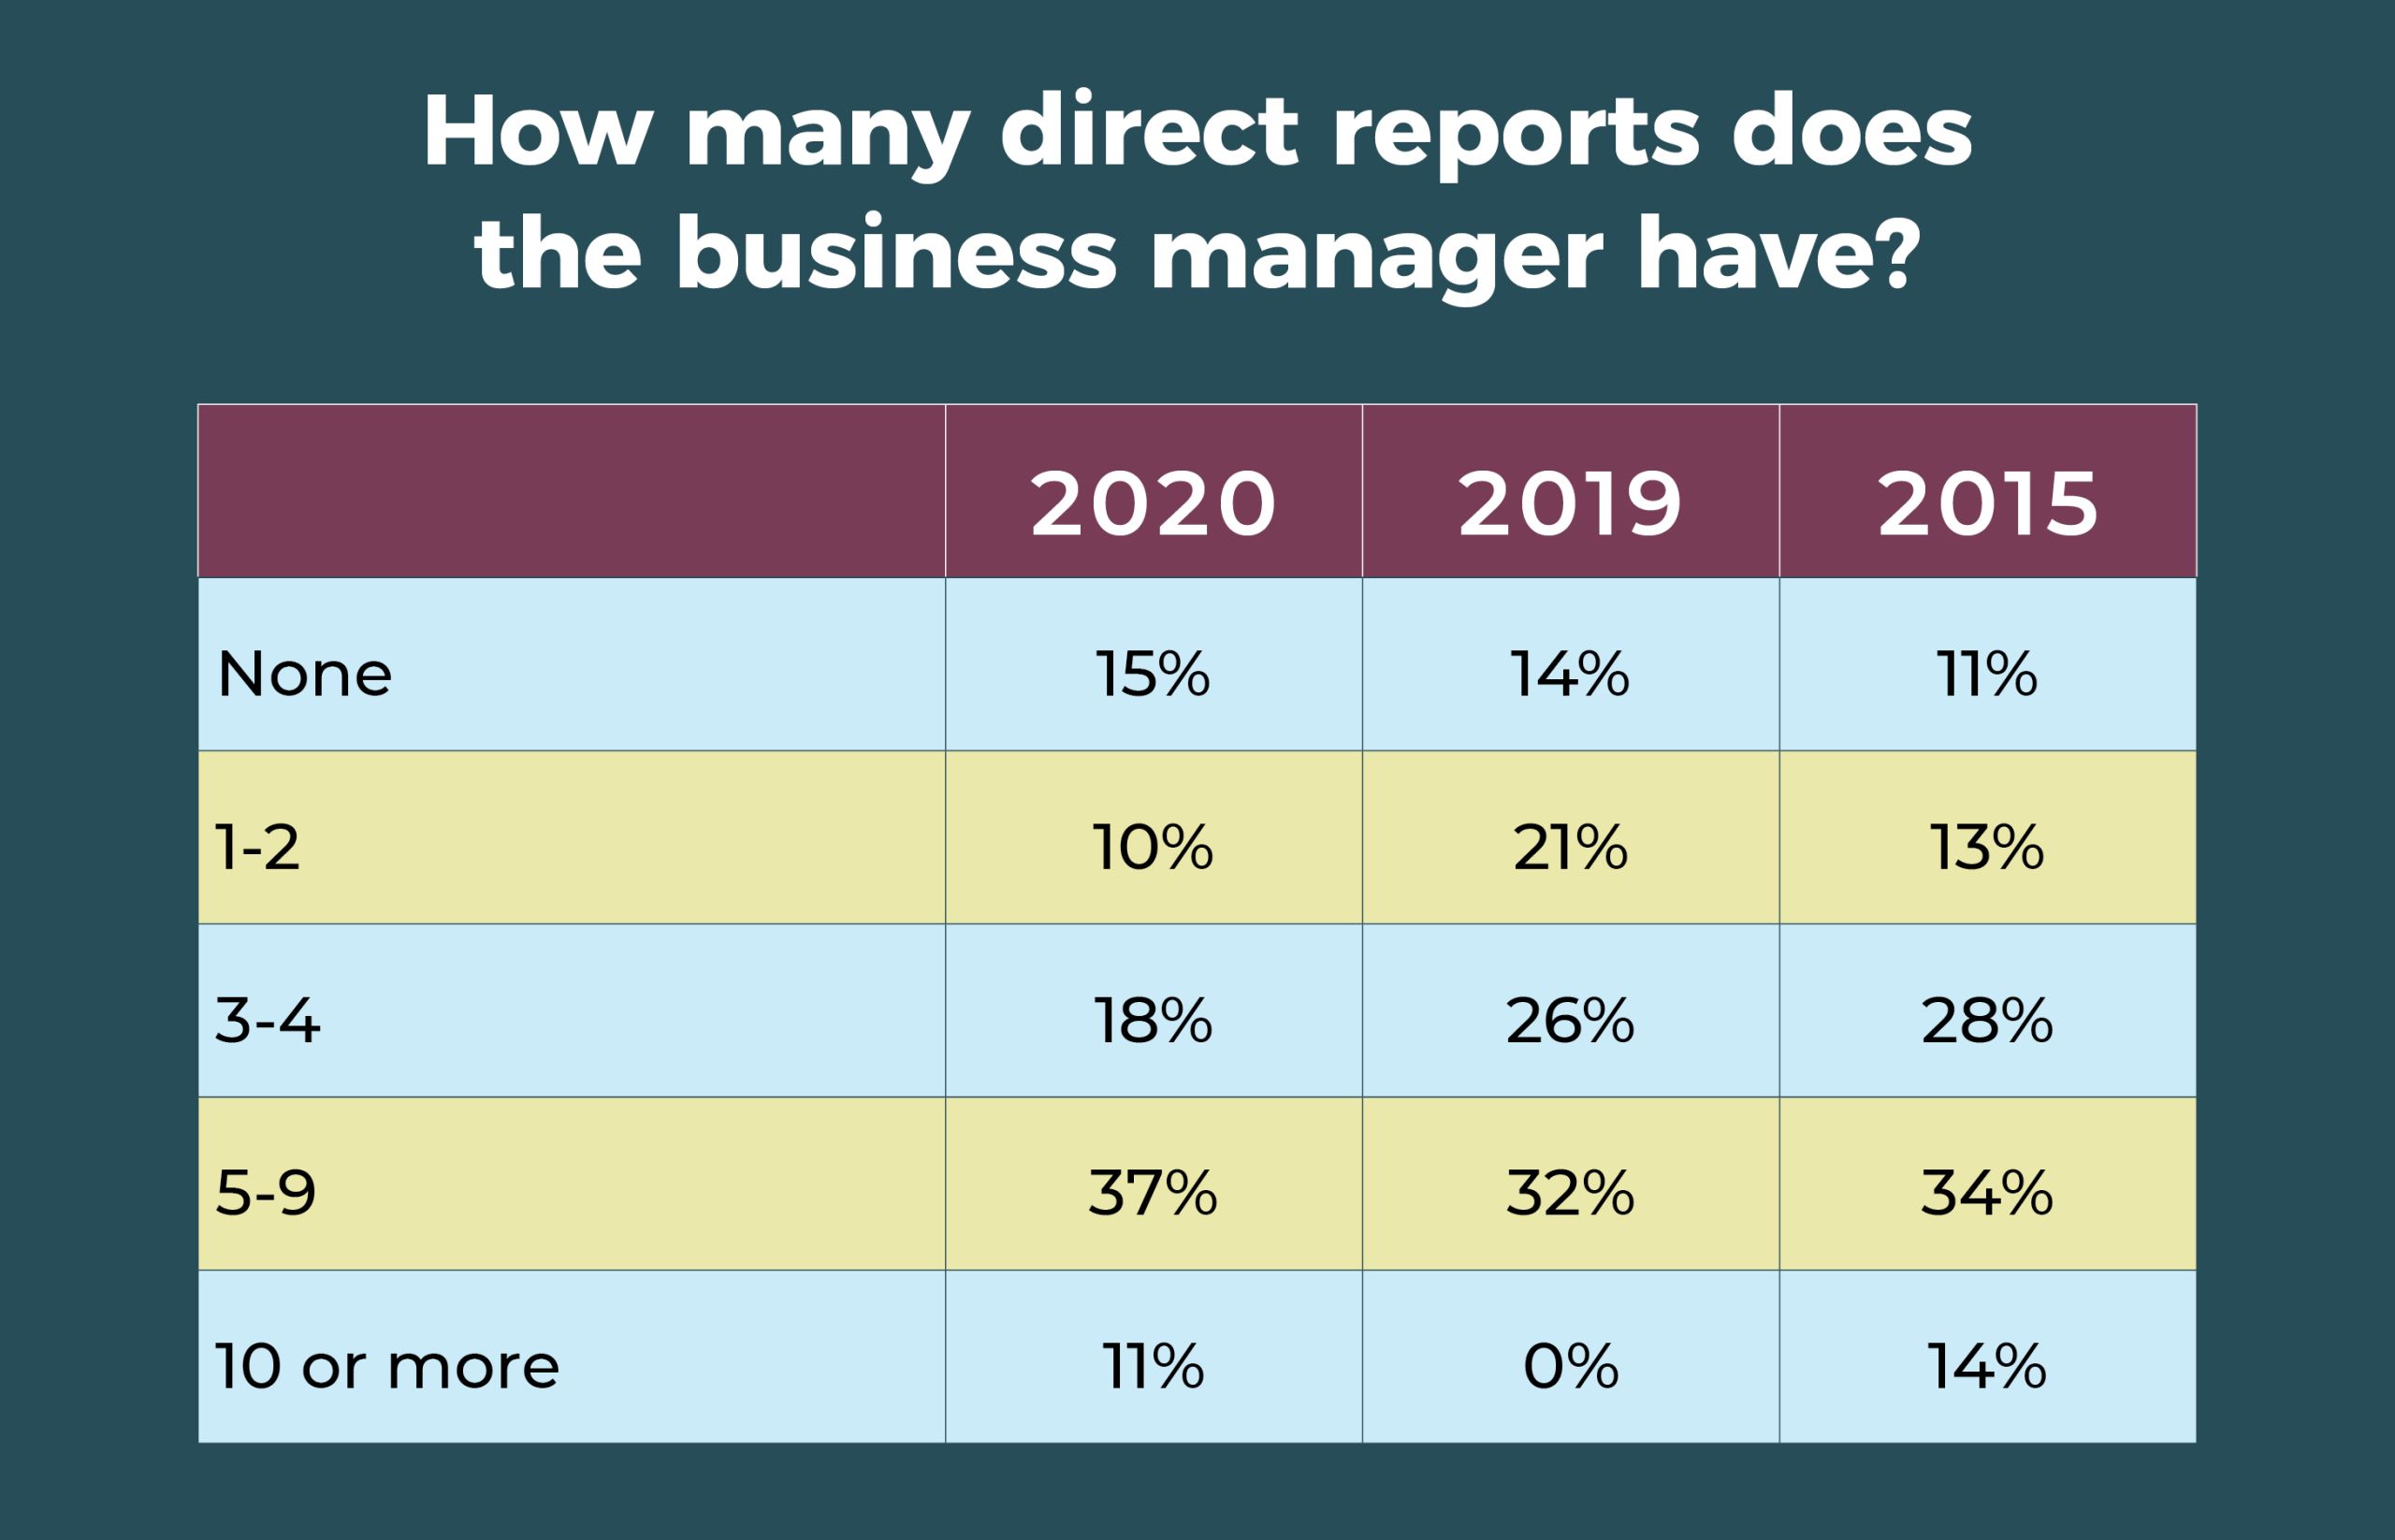
- The number of direct reports for business managers ticked upward, with 37% reporting 5 to 9, compared with 32% last year and 34% in 2015. Only 15% have no direct reports, compared to 18% in 2010.

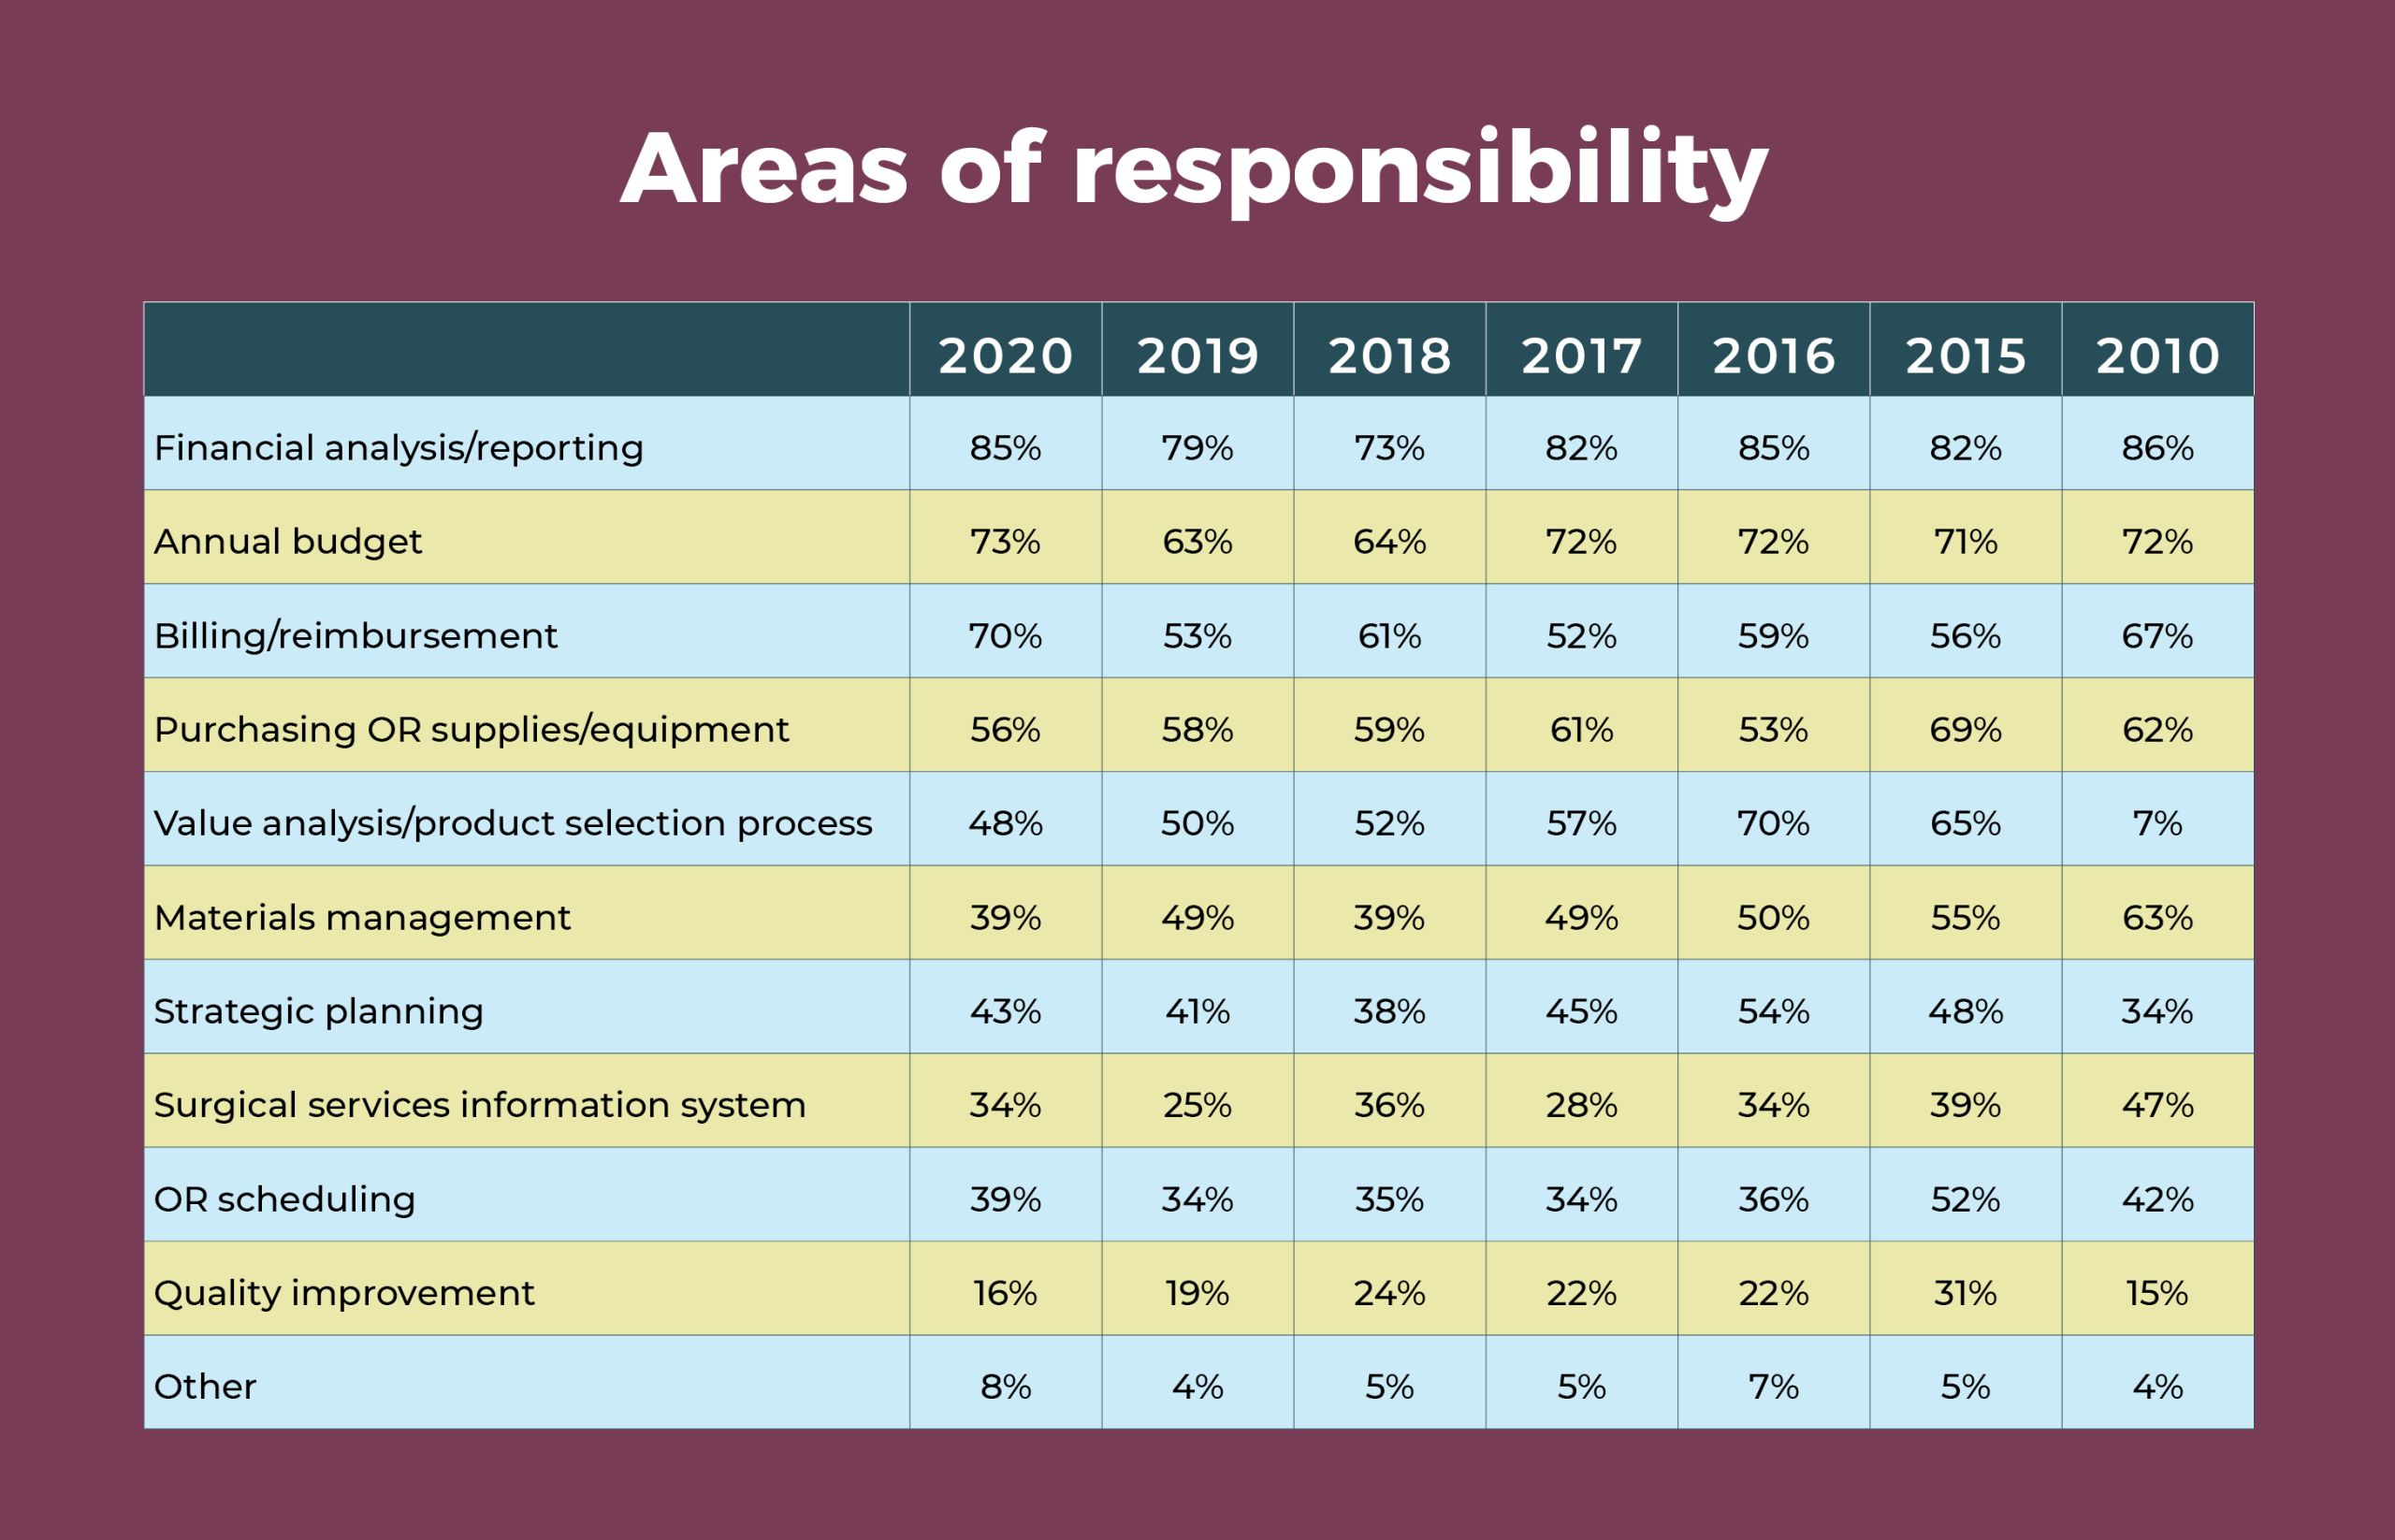
See the table for trends in areas of responsibility over the past 5 years. Financial analysis and reporting has consistently been the most commonly cited area of responsibility (85% in 2020), followed by the annual budget (73% in 2020). The percentage reporting billing/reimbursement as an area of responsibility has risen significantly over the years, reaching 70% in 2020, whereas responsibility for quality improvement continues to decrease. For the first time this year, fewer than half (48%) of business managers are responsible for the value analysis/product selection process.
Most OR nurse leaders find jobs rewarding despite COVID-19


Results from the 2020 annual OR Manager Salary/Career Survey show that despite the turbulent times, most OR leaders view their work favorably; 77% are satisfied with their jobs, with nearly a third describing themselves as “completely satisfied.” This might seem surprising in light of COVID-19, but many nurse leaders are well compensated and have stepped up to meet the challenges encountered during the pandemic.
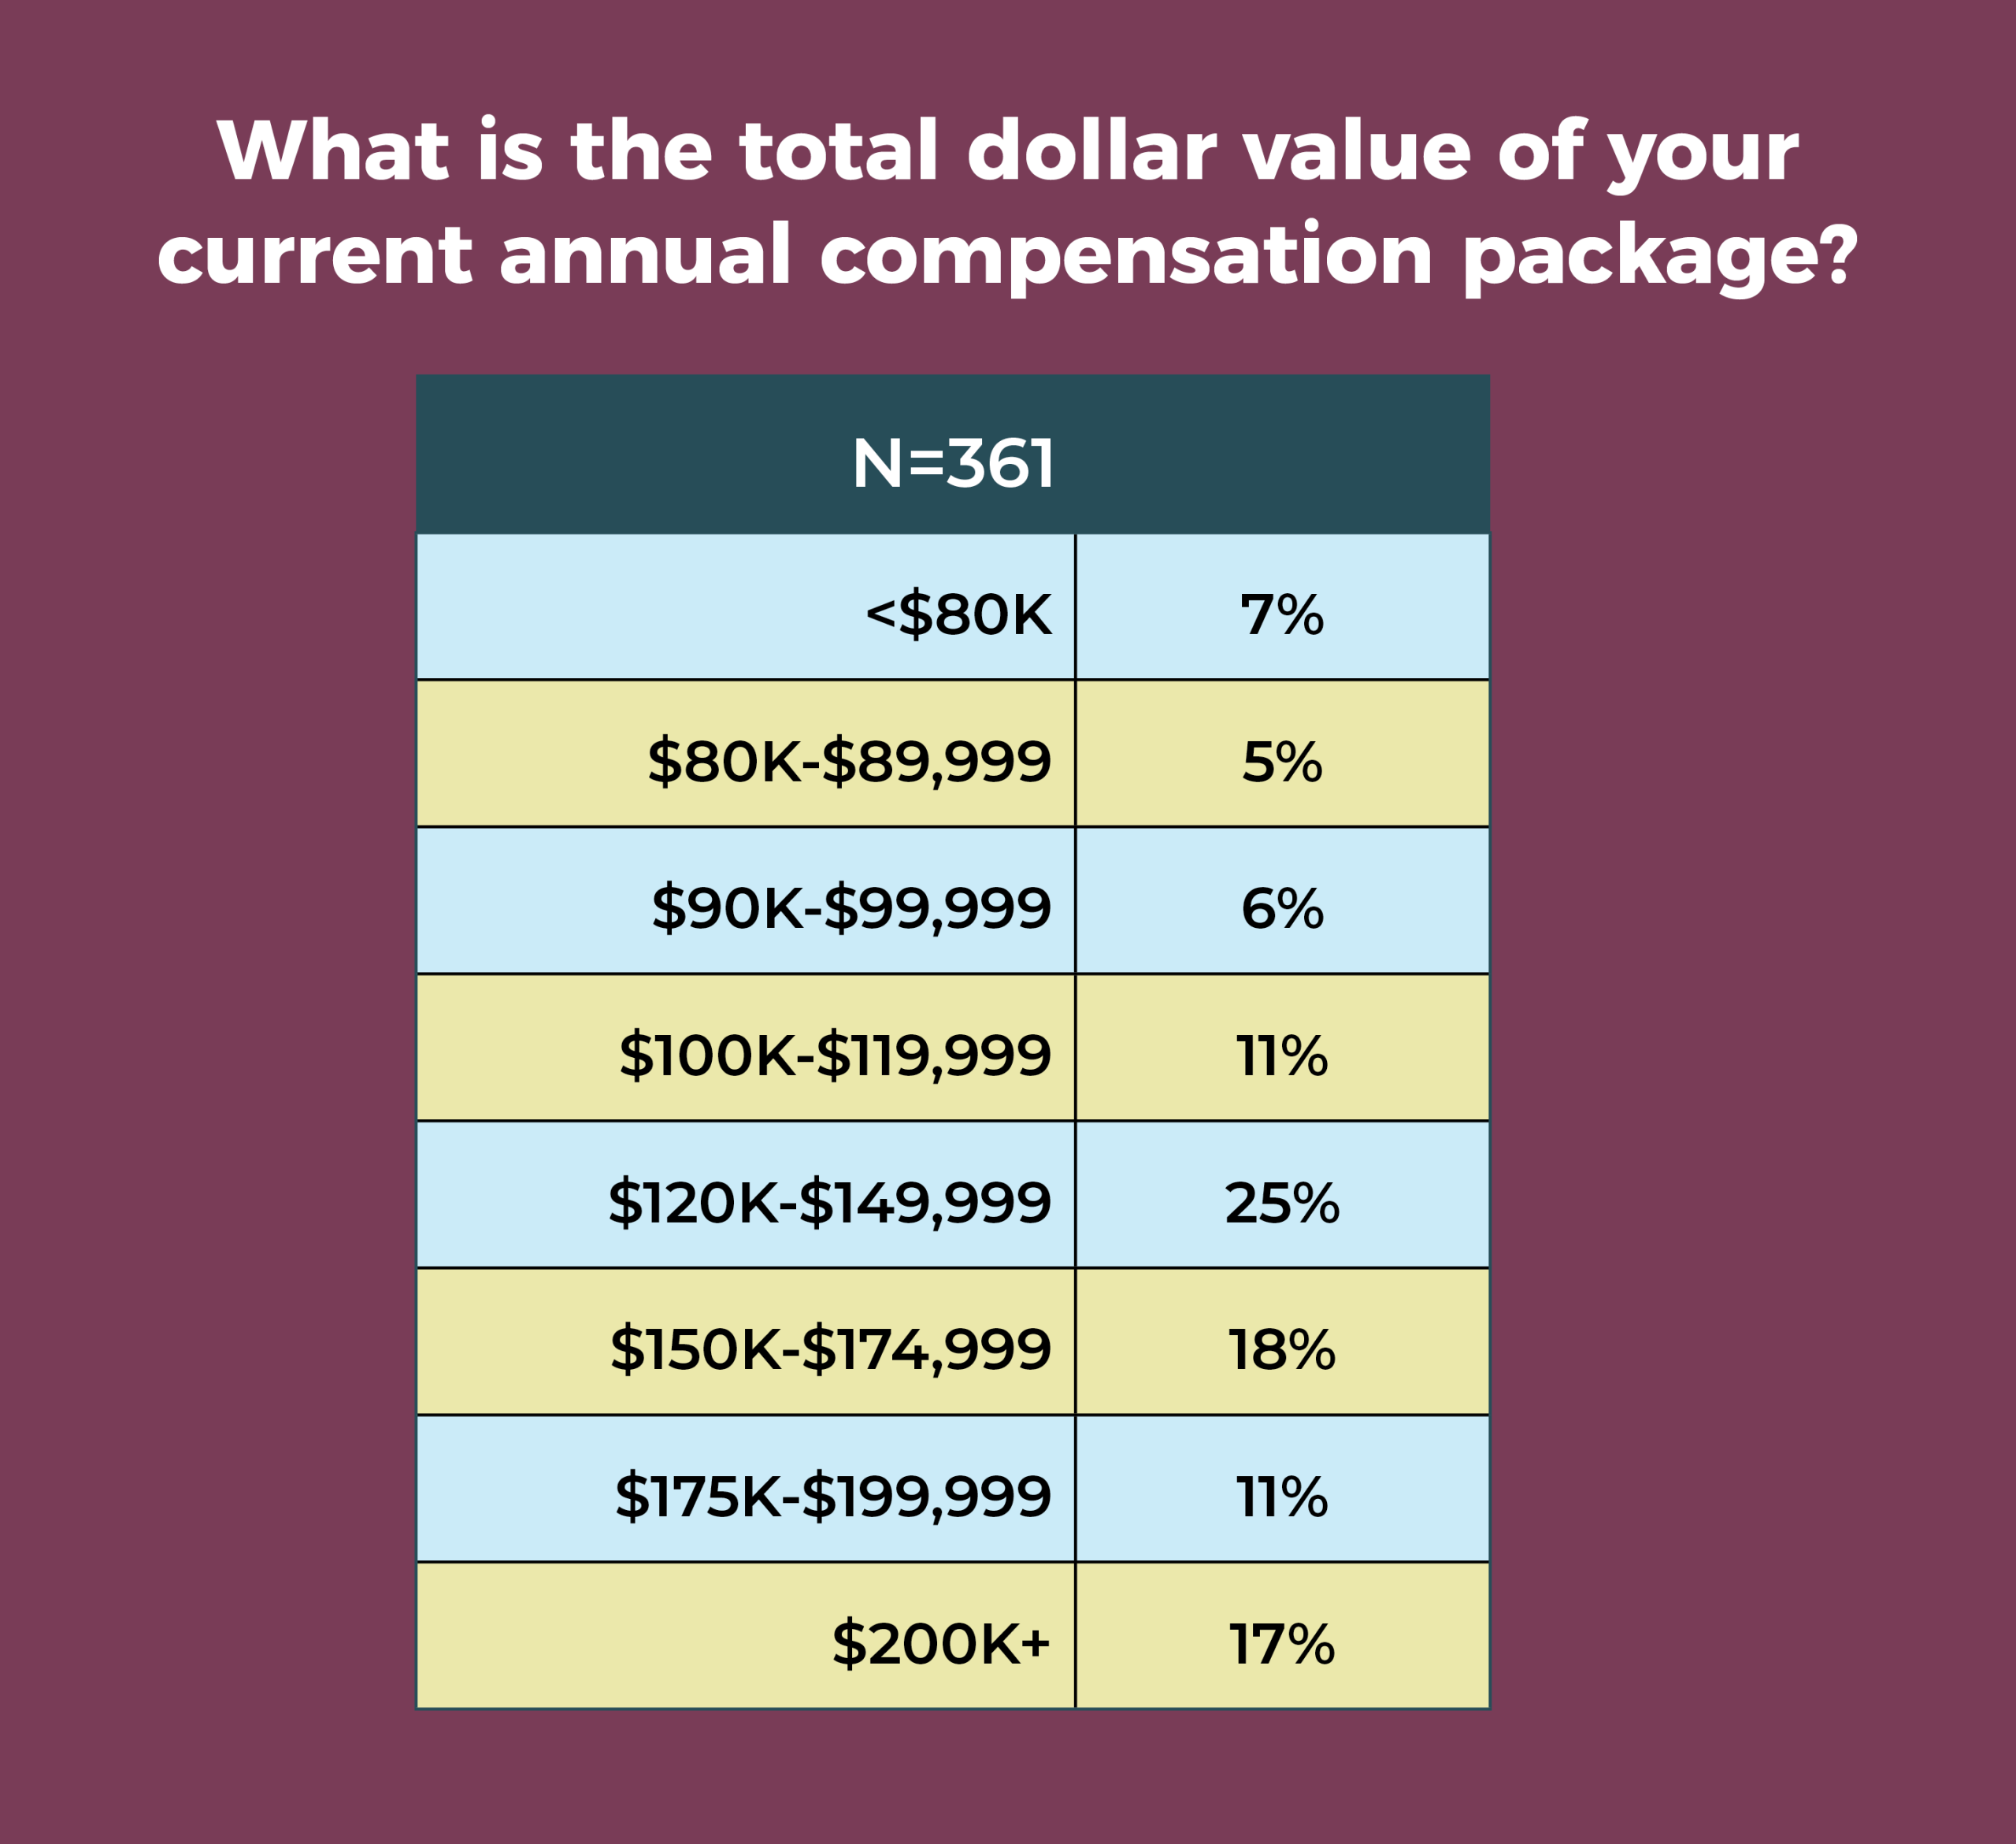
Nearly a third (30%) of respondents say they earn $150,000 or more annually as a salary, up from 19% in 2019, and 17% report total compensation of $200,000 or more, compared to 11% last year.
Other highlights from the 2020 survey include:
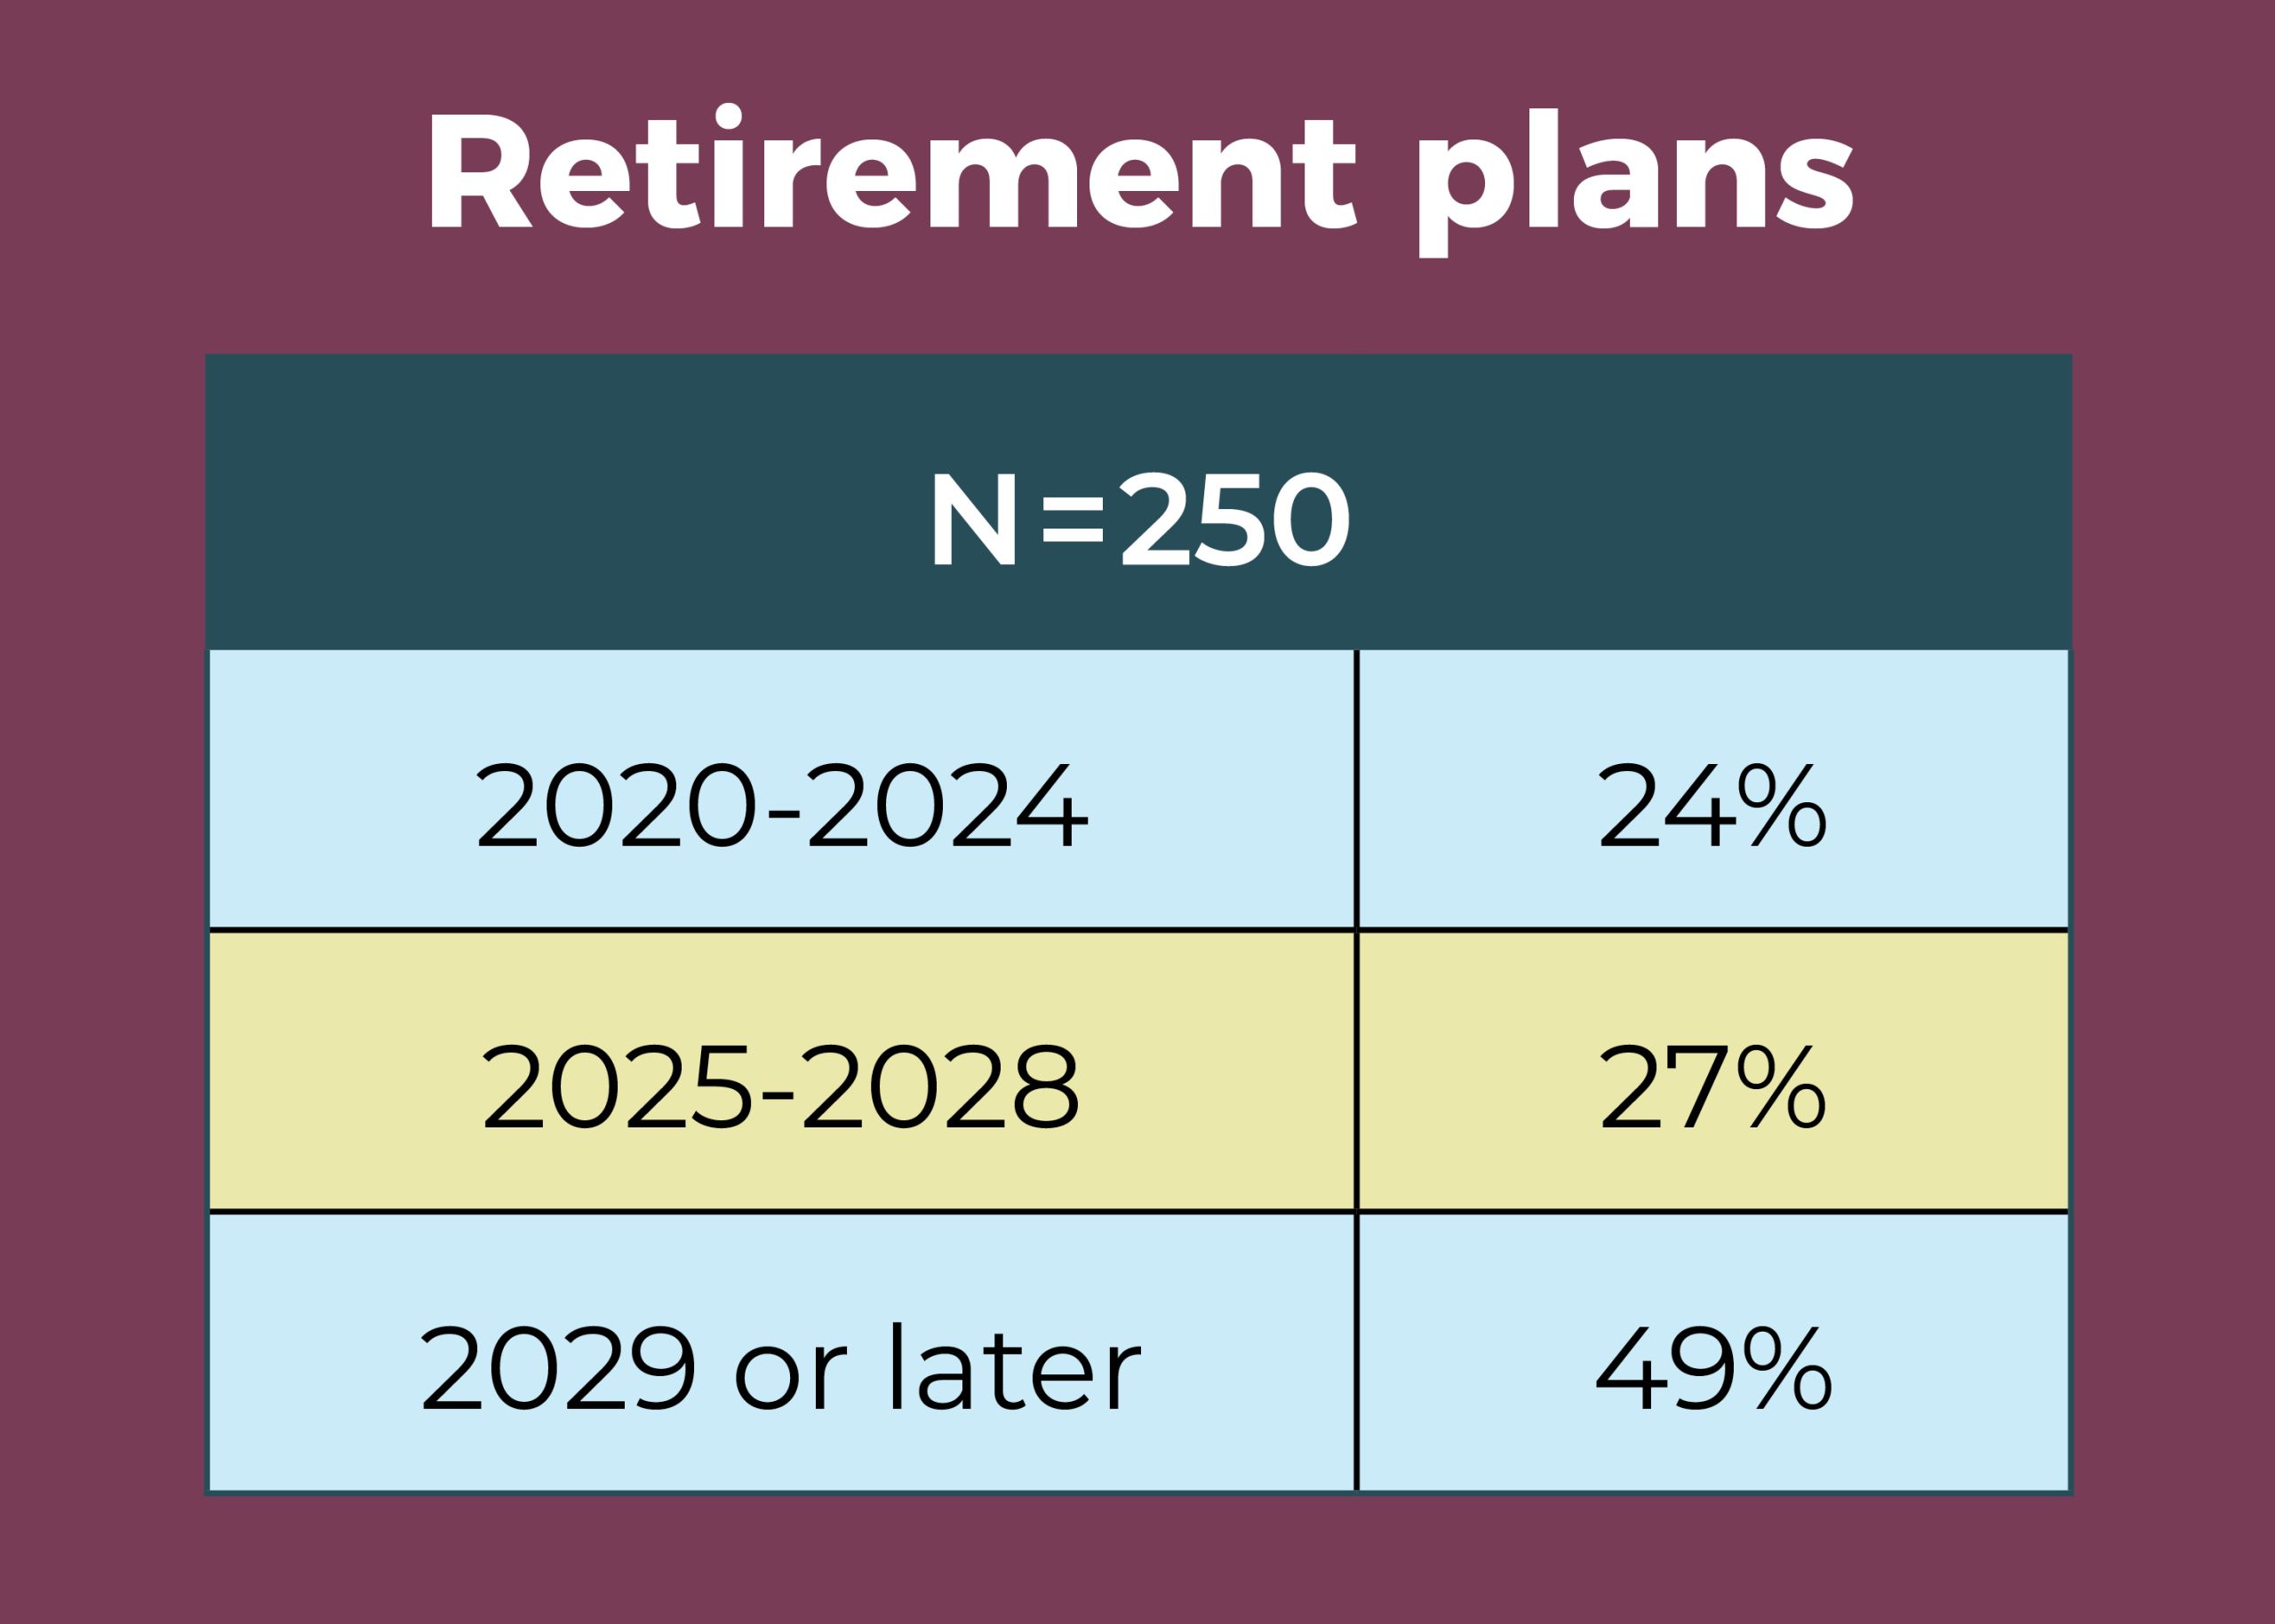
- Nearly half (49%) of OR leaders expect to be retired by 2029, with 24% planning retirement by 2024.
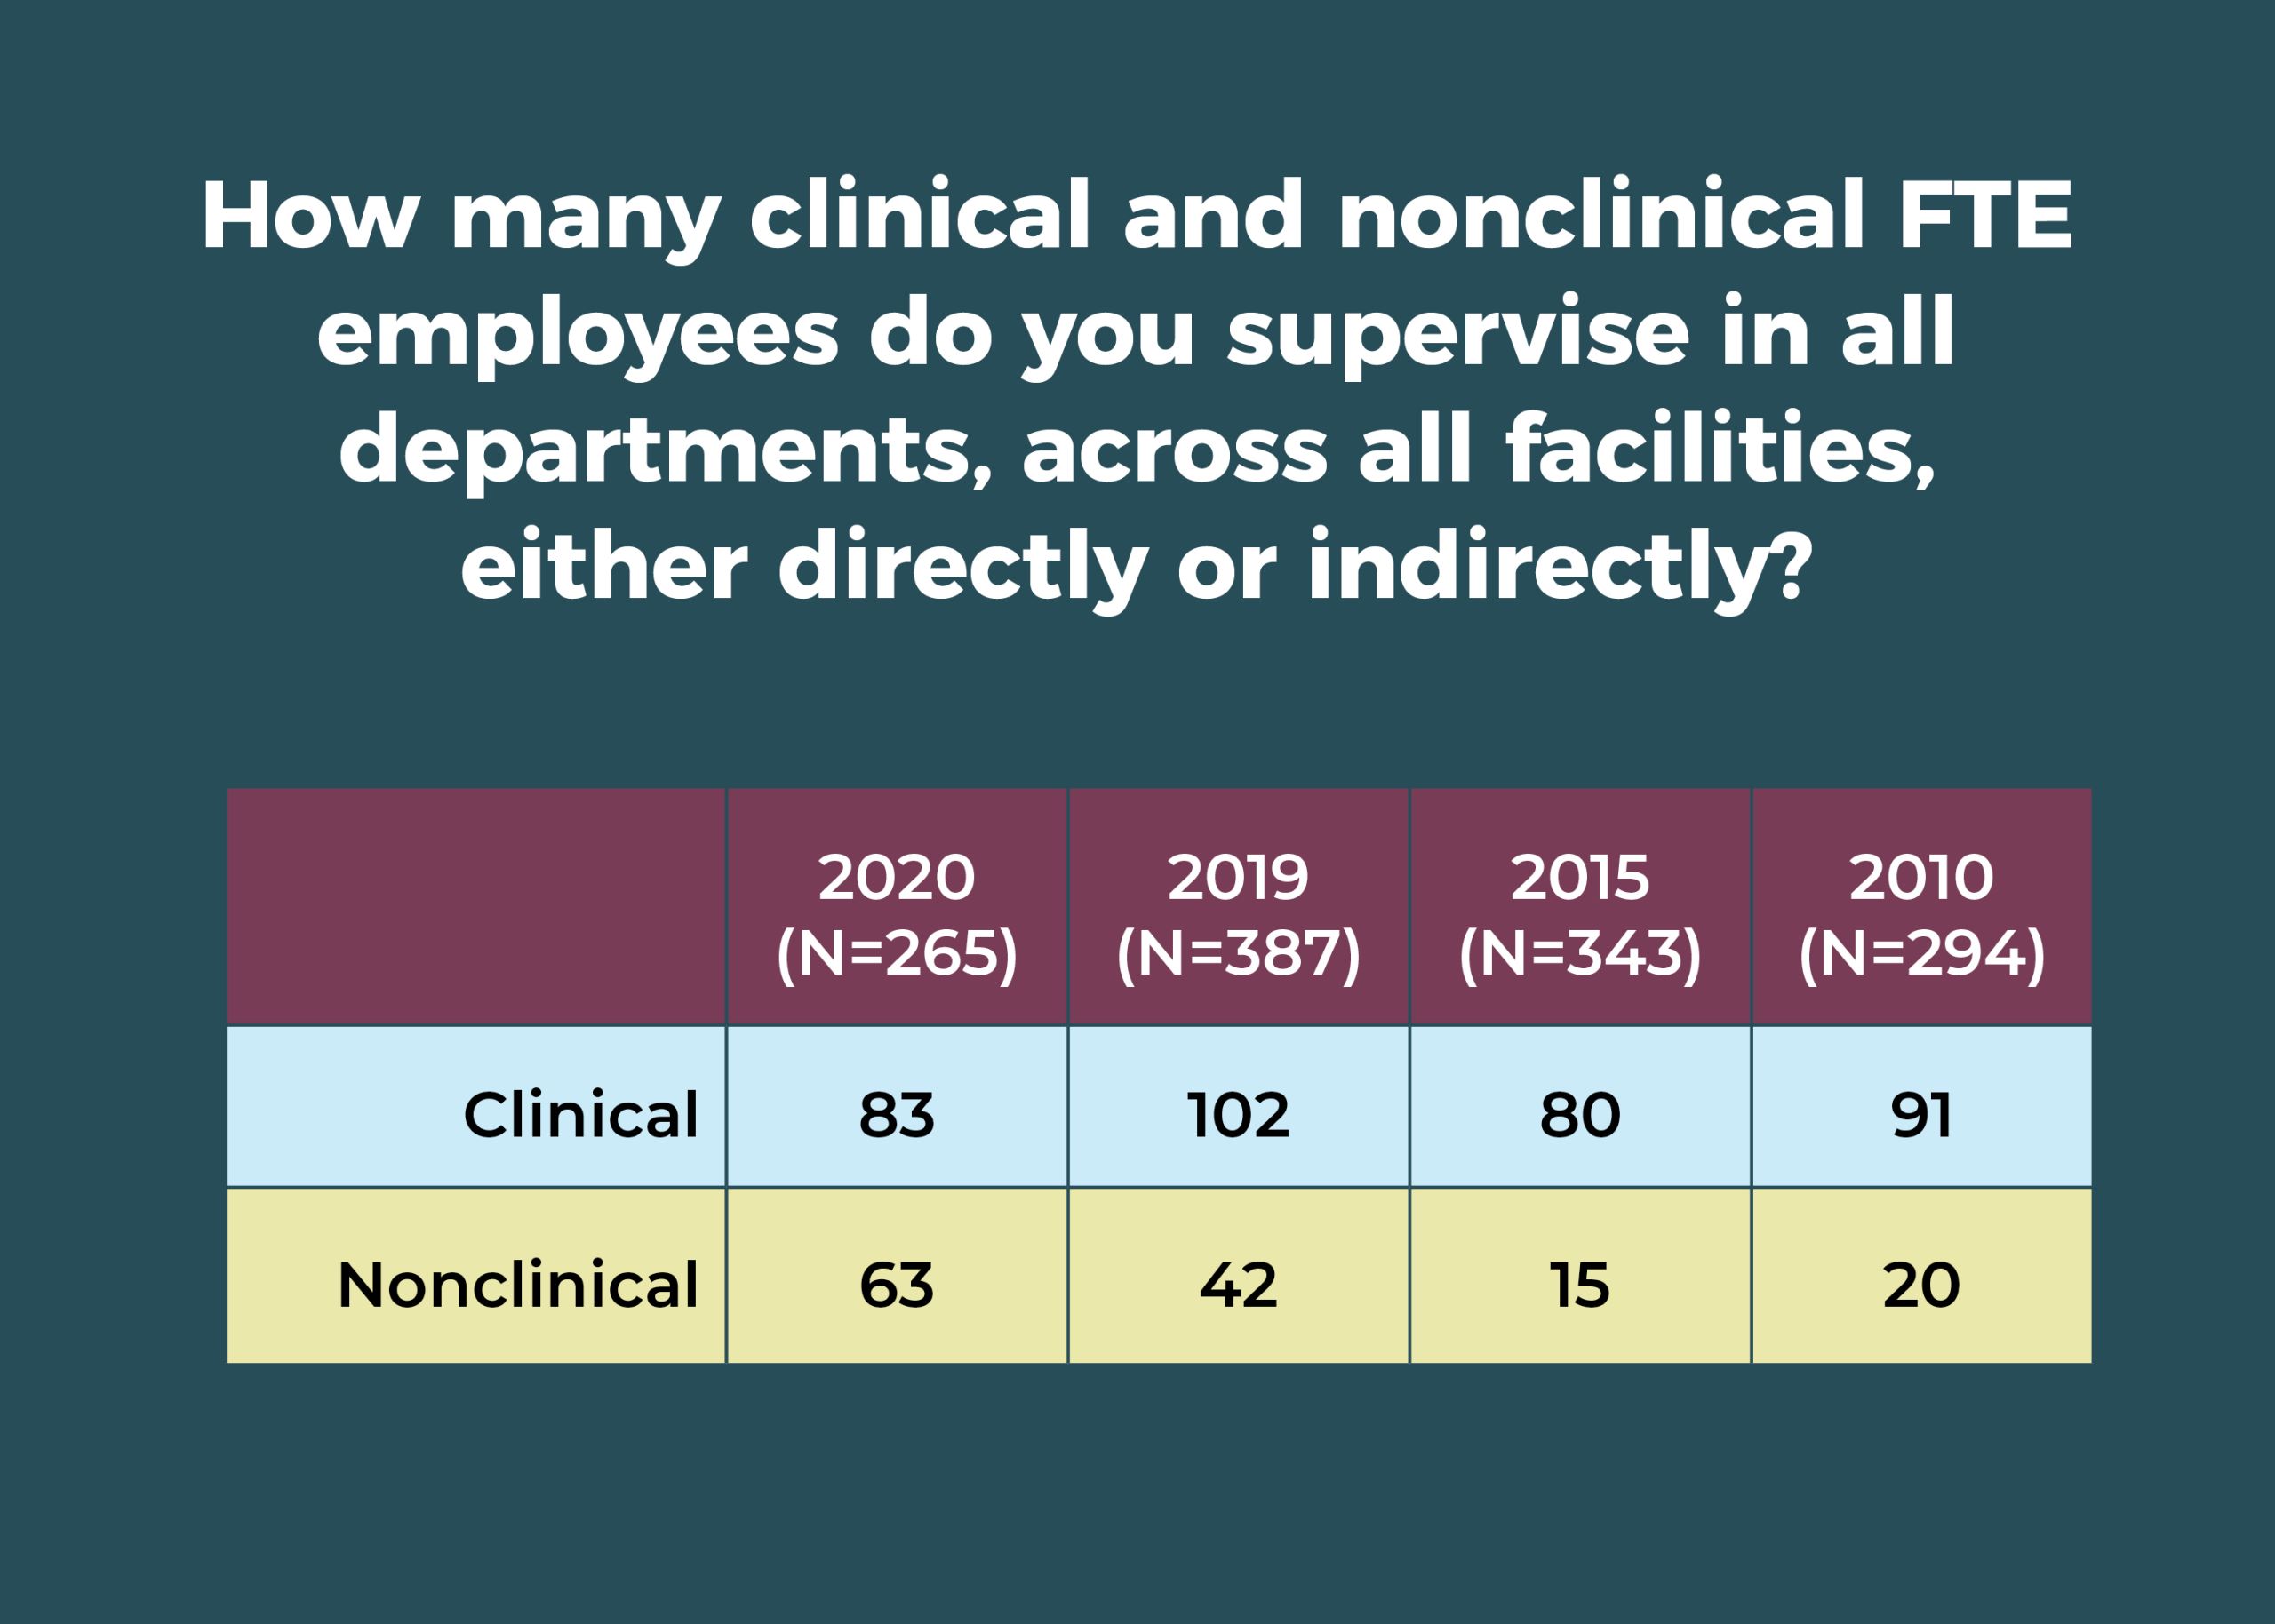
- OR leaders supervise an average of 96 full-time equivalent (FTE) employees, down from last year’s 139.
- Nearly two-thirds (63%) of respondents manage an annual operating budget in the $2.5 million to $49.9 million range, comparable to last year’s 65%.
- The percentage of those identifying themselves as male was 22%, unchanged from 2019.


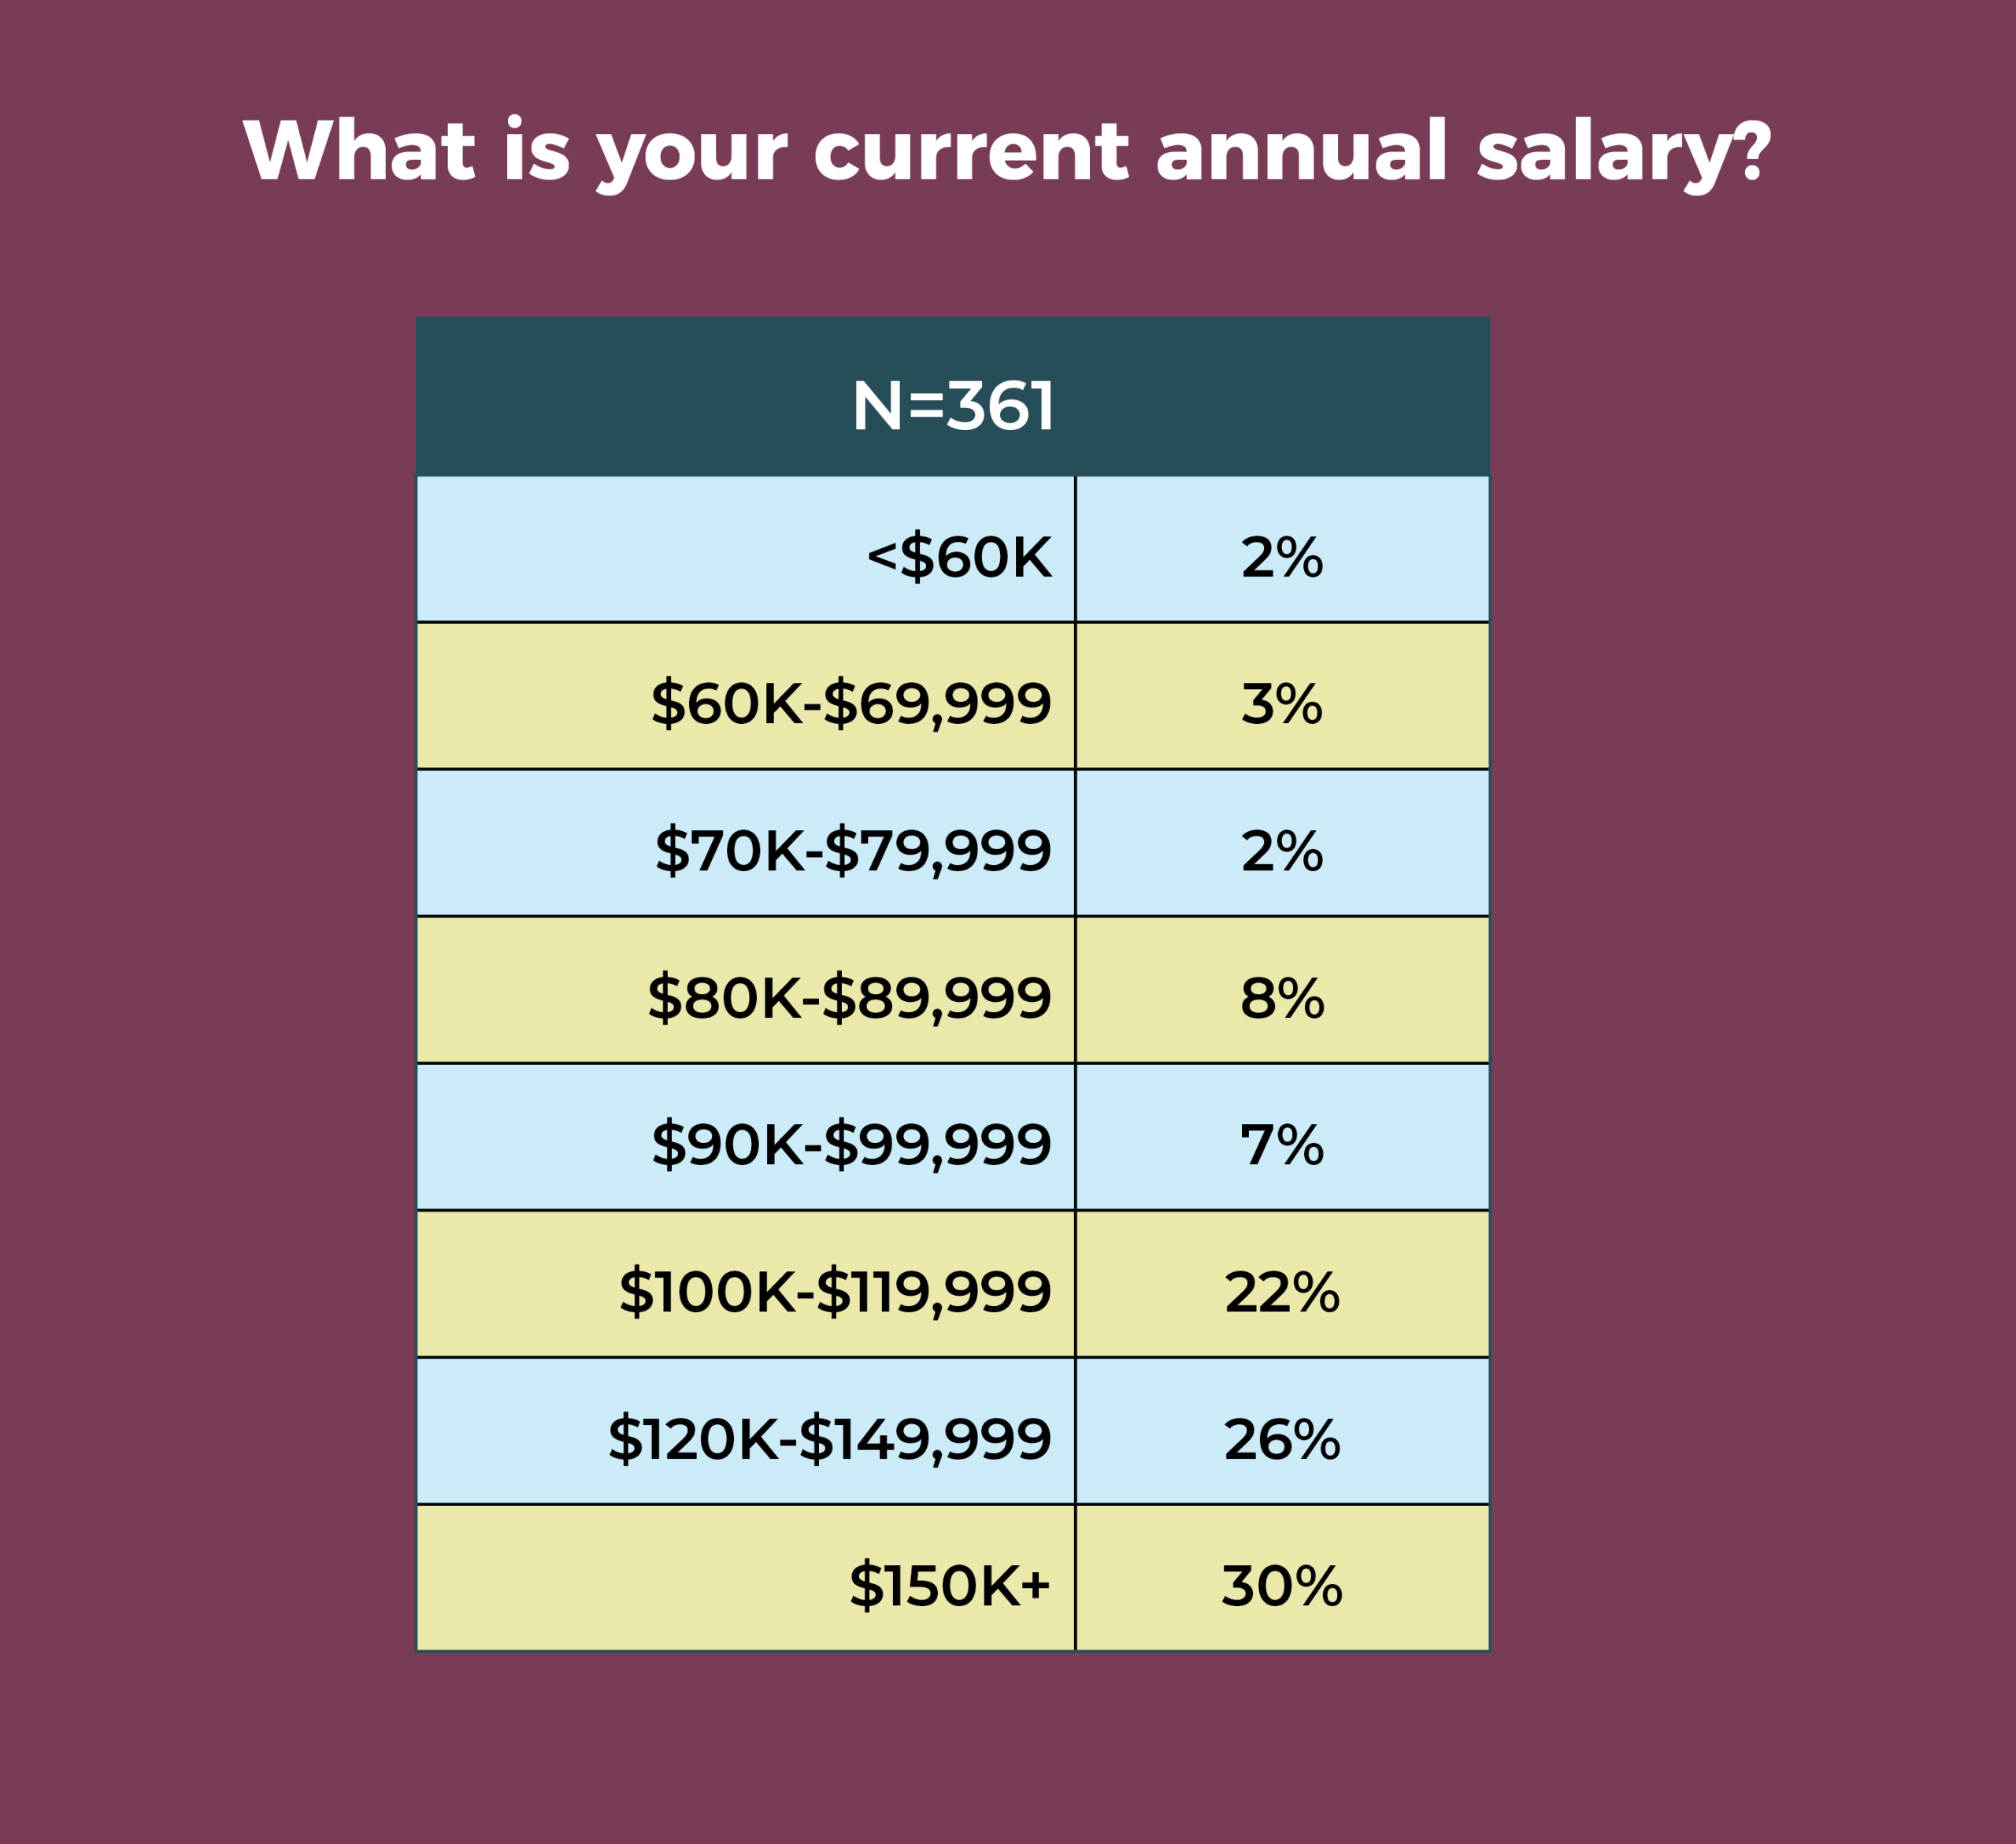
Overall, 78% of OR leaders earn an annual salary of $100,000 or more, with 30% earning $150,000 or more and 2% earning less than $60,000.
The most frequently reported total compensation range again was $120,000 to $149,999 (25% vs 24% in 2019), followed by $150,000 to $174,999 (18%). Only 7% reported an annual total compensation of less than $80,000.
More than two-thirds (68% vs 70% in 2019) had received a raise in the past 12 months, with an average of 3.3% (compared to 3.06% last year, 3.27% in 2018, and 3.5% in 2010). However, when deleting outliers (those 10% or higher), the average falls to 2.9%, slightly higher than the 2.3% increase in the consumer price index in 2019.

Of the options provided, the most common job title was director (57%, compared to 37% in 2019 and 46% in 2018), followed by nurse manager (24% vs 30% in 2019), and administrator/administrative director (17% vs 14% in 2019).
In those roles, OR leaders supervise an average of 83 clinical employees and 63 nonclinical employees (compared to 102 clinical and 42 nonclinical employees in 2019). A total of 41% of respondents oversee 1 to 5 ORs, with 21% in charge of 6 to 10 and 15% responsible for 11 to 15.
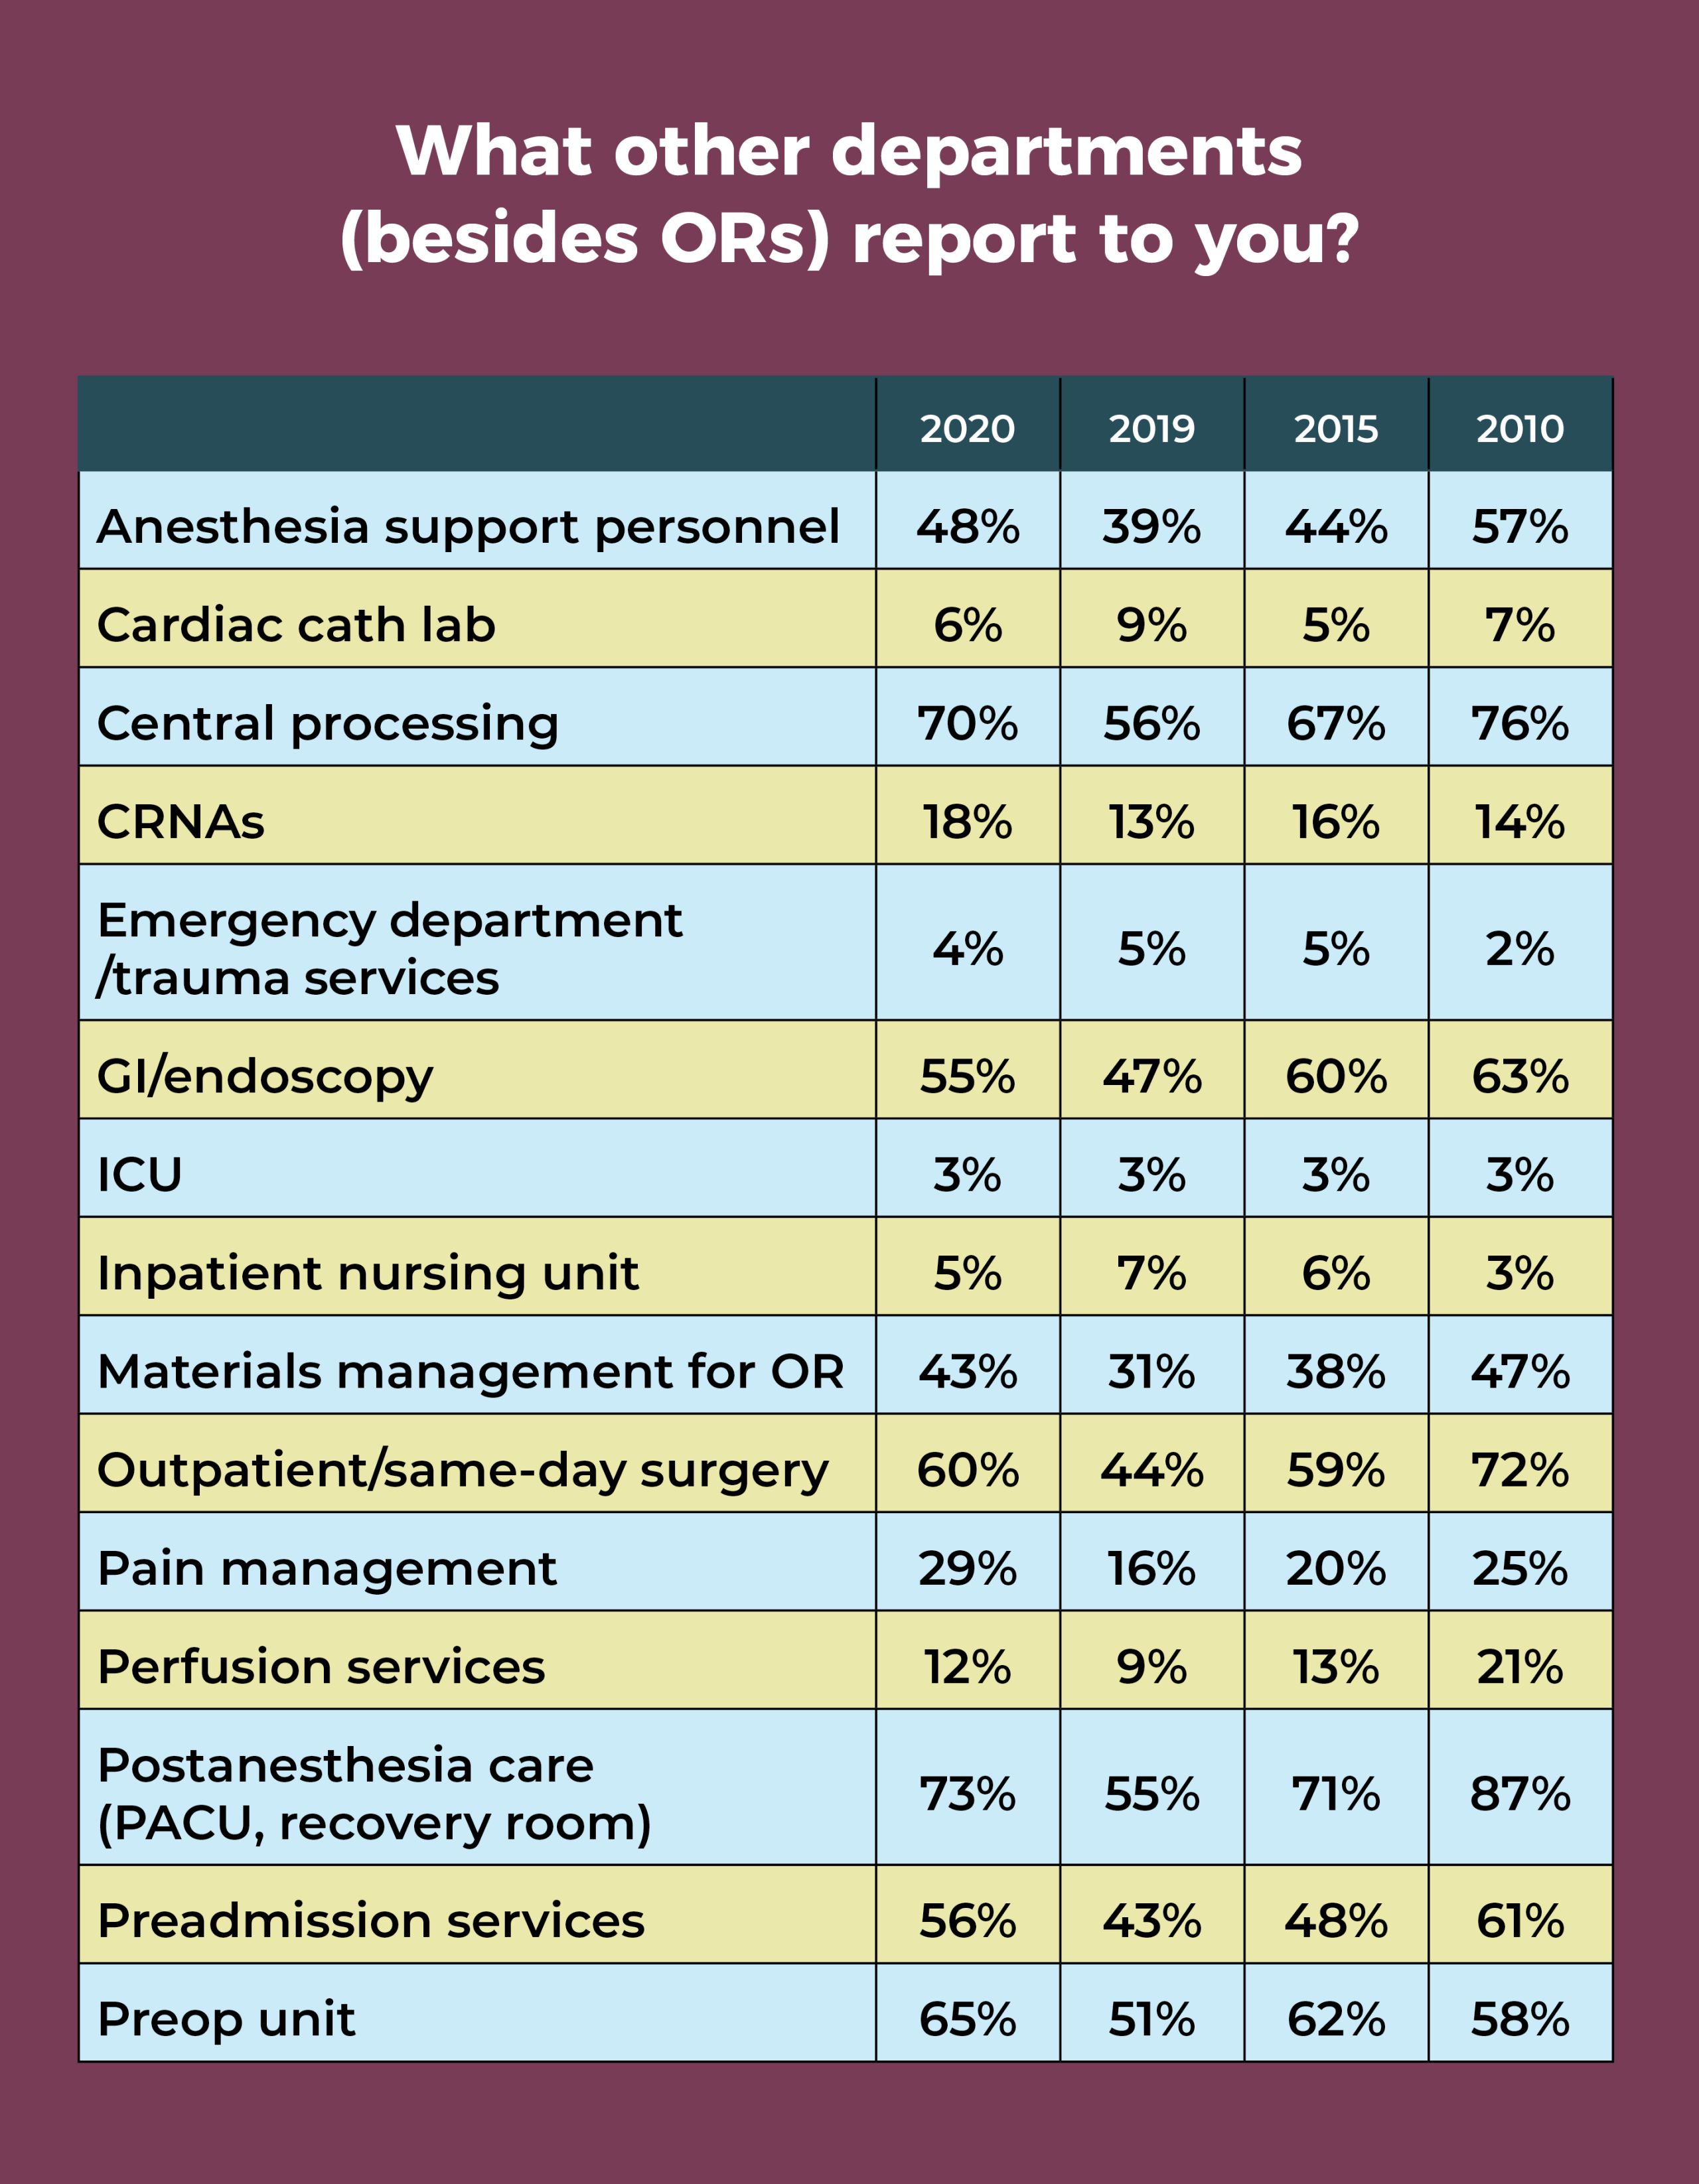
In addition to the OR, more than half of OR leaders oversee the postanesthesia care unit (PACU, 73%), central sterile processing (70%), preoperative area (65%), outpatient/same-day surgery (60%), preadmission services (56%), and GI/endoscopy (55%). Interestingly, these are the same departments reported by more than 50% of OR managers in 2010, with the addition of anesthesia support personnel (57% in 2010 vs 48% in 2020).
After declines last year, percentages for PACU, central sterile processing, the preoperative area, outpatient/same-day surgery, GI/endoscopy, and preadmission services rebounded significantly.
Budget responsibilities decreased slightly from last year, with some 44% of respondents overseeing an operating budget of $4.9 million or less and nearly half (49%) in charge of a capital budget of $499,999 or less.

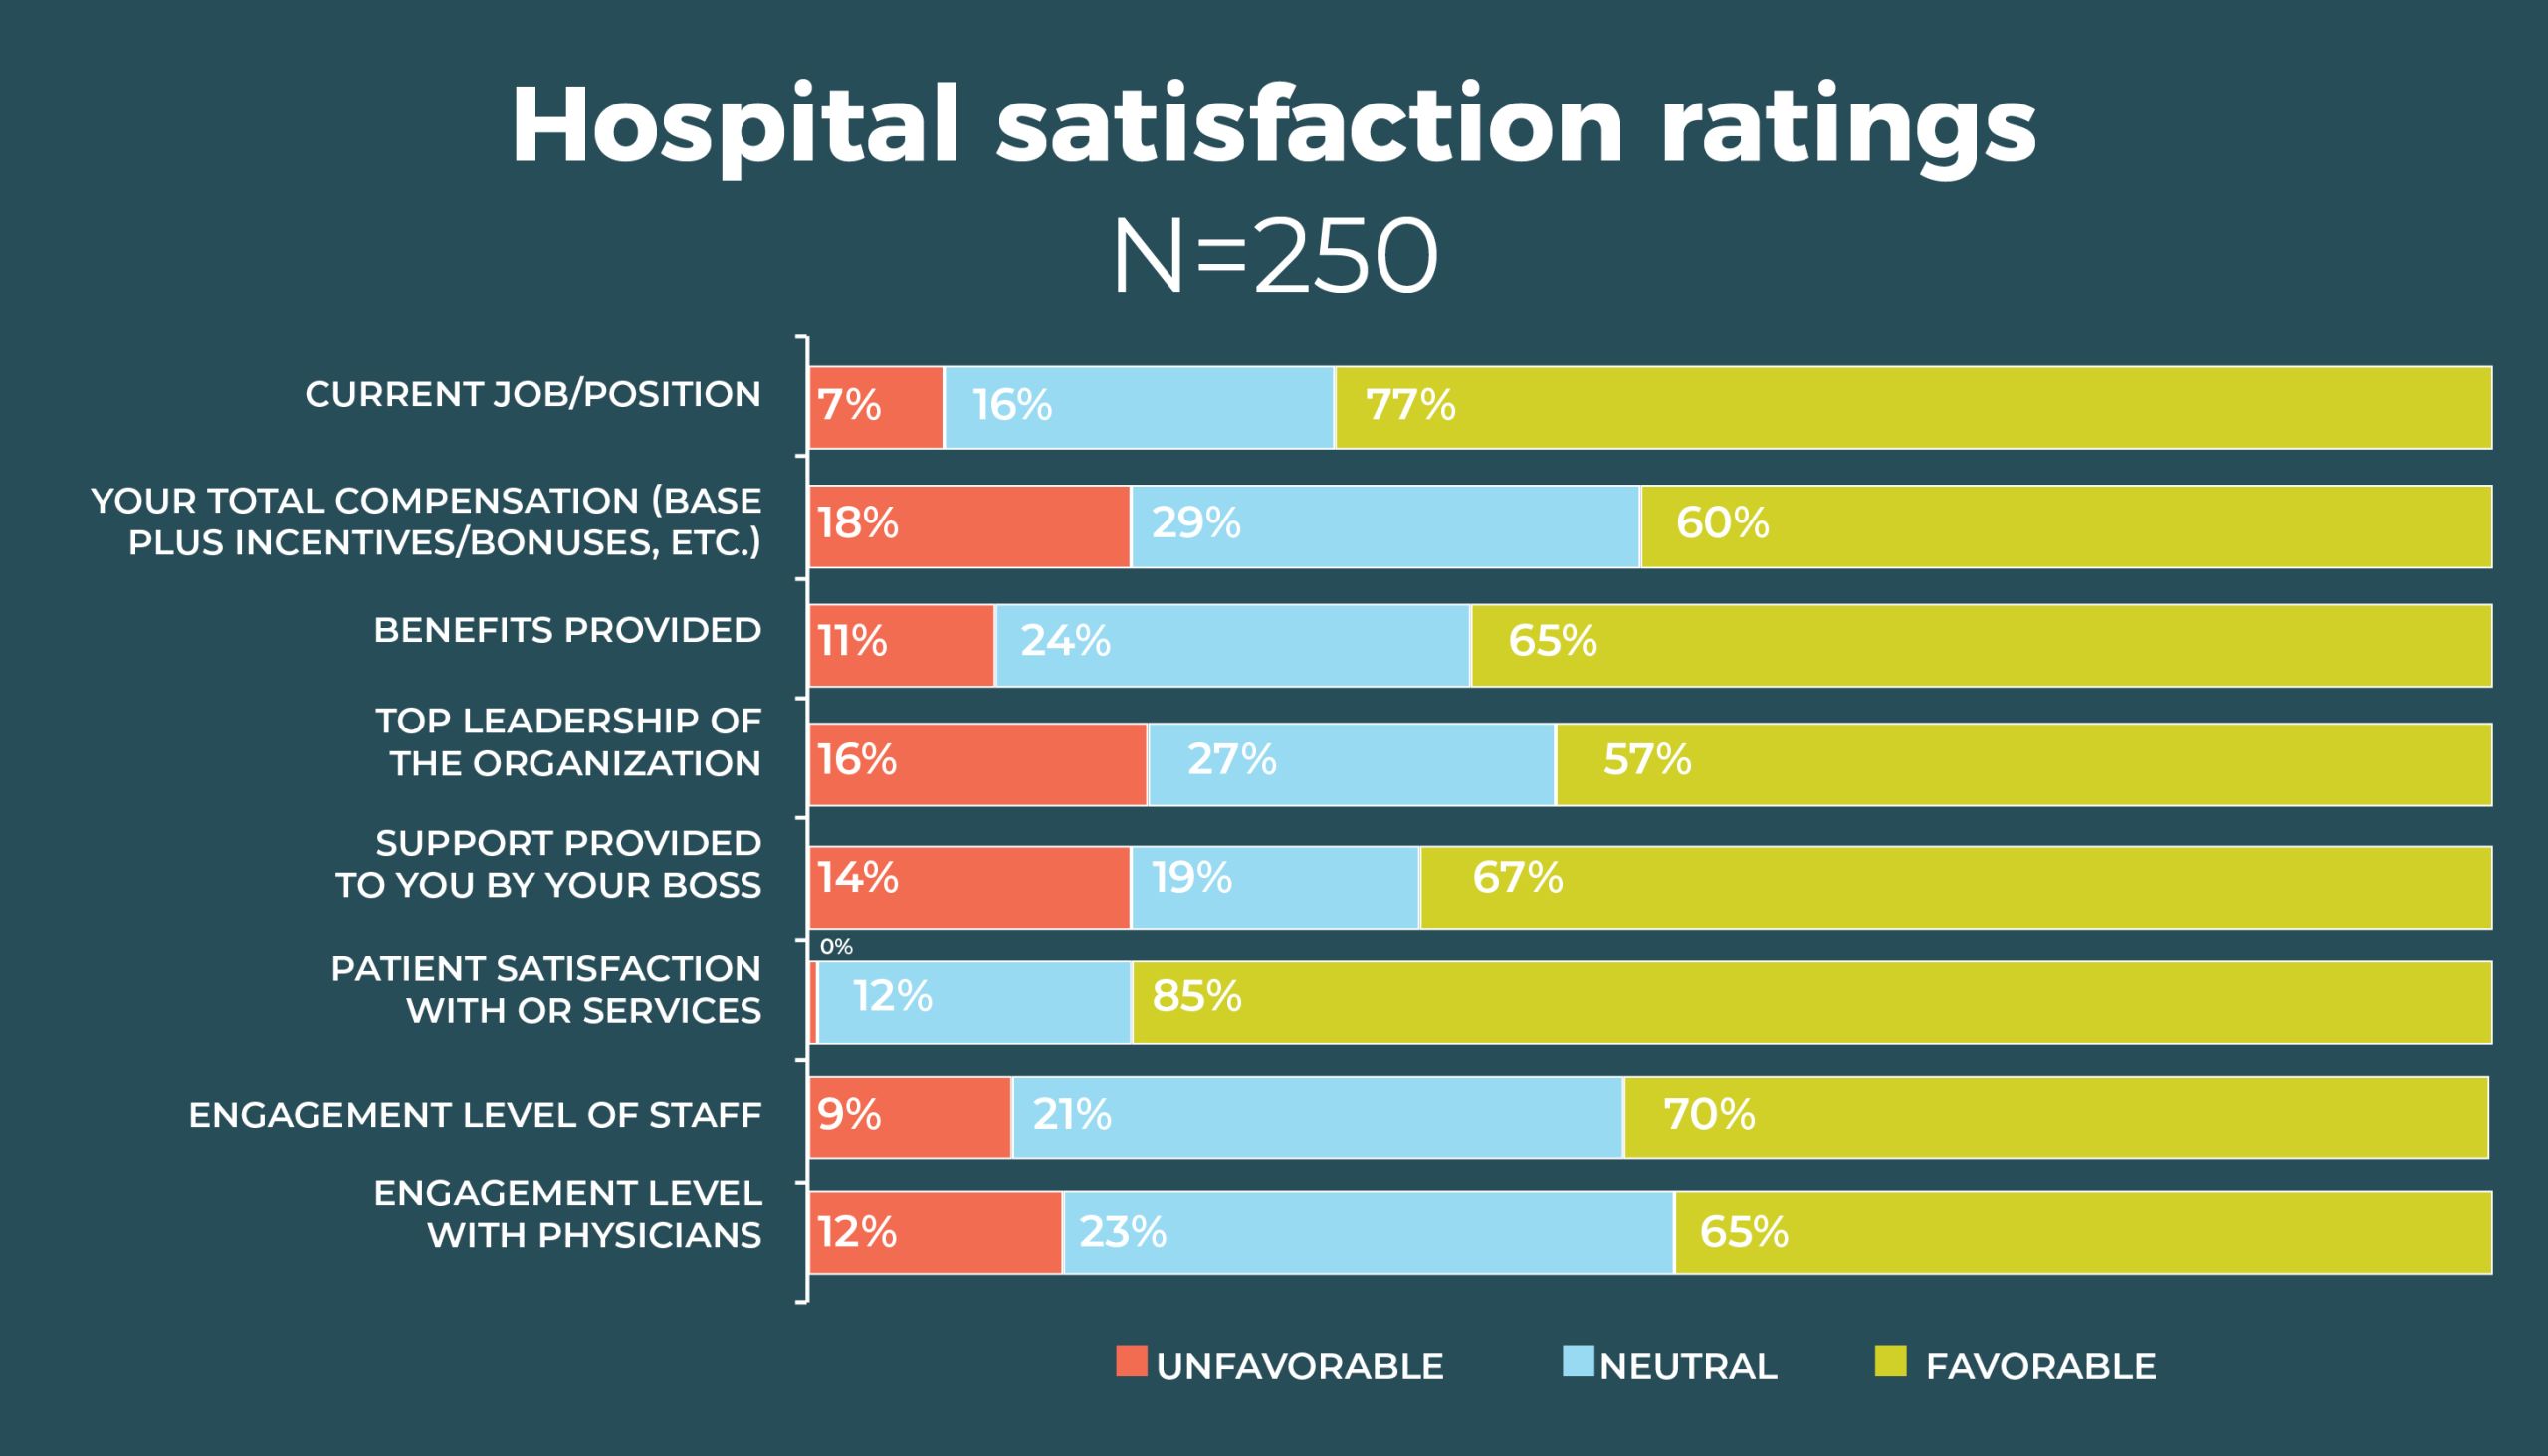

Compared to 2019, more OR leaders are satisfied with their total compensation (60% vs 51%); nearly two-thirds (65%) are satisfied with their benefits, comparable to 61% from 2019. Most leaders are satisfied with both the top leadership of the organization (57%) and their own boss (67%). Job satisfaction has had longevity among OR leaders. For example, in 2015, 75% were satisfied with their jobs, and 65% were satisfied with their own boss.
OR leaders report big gains in staff, patient, and physician satisfaction. For example, the favorable rating for staff engagement increased from 51% in 2019 to 70% this year (vs 63% in 2015), and physician engagement rose from 49% to 65%. It’s interesting to speculate whether the teamwork required to respond to the pandemic may have boosted these percentages. Reported patient satisfaction with OR services rose from 77% last year to 85% this year, compared to 82% in 2015.

What is the one thing about your job that keeps you up at night? In all, 214 OR leaders answered that question. Staffing concerns topped the list of comments, cited by 37% of respondents, and staffing popped up in some of the comments related to the COVID-19 pandemic. For example, having to furlough staff was the second most common worry. Other COVID-19 concerns related to supplies and testing.
Sample staffing comments that many OR leaders could likely identify with include:
- "Staffing is the single biggest issue that I have the most problems resolving”
- “Lack of experienced staff”
- “Trying to make sure staff, including surgeons and anesthesia providers, are happy, which reverts back to patient satisfaction outcomes.”

Sample COVID-19 comments include:
- “Having enough PPE [personal protective equipment] to cover for COVID-19”
- “COVID-19 testing availability/viability/etc”
- “A large COVID spike”
- “Ramping back up for the backlog of surgical cases after COVID-19”
- “How do I keep my patients and staff safe during the pandemic?”
- “How to recover from COVID-19…what pieces will we be picking up, and can we survive as a business?”
One person summed up many others’ concerns as: “With the ever-increasing amount of change, will [we] be able to keep up and continue to keep patients safe? Will caregivers stay engaged? Will they stay with us? Will they be able to step up during this crisis? Can we help them so that they don’t burn out?”
The third most common group of worries were related to regulation and patient safety. One respondent said: “regulations and never-ending pressure of litigation or fines for infractions.”
Other areas of concern include finance, volume, physicians, and equipment. Some expressed concerns for their own future, such as: “Will I have a job tomorrow in this changing climate?” and “How long can I keep this up?”
Not everyone worries; 16 OR leaders said nothing keeps them up at night.


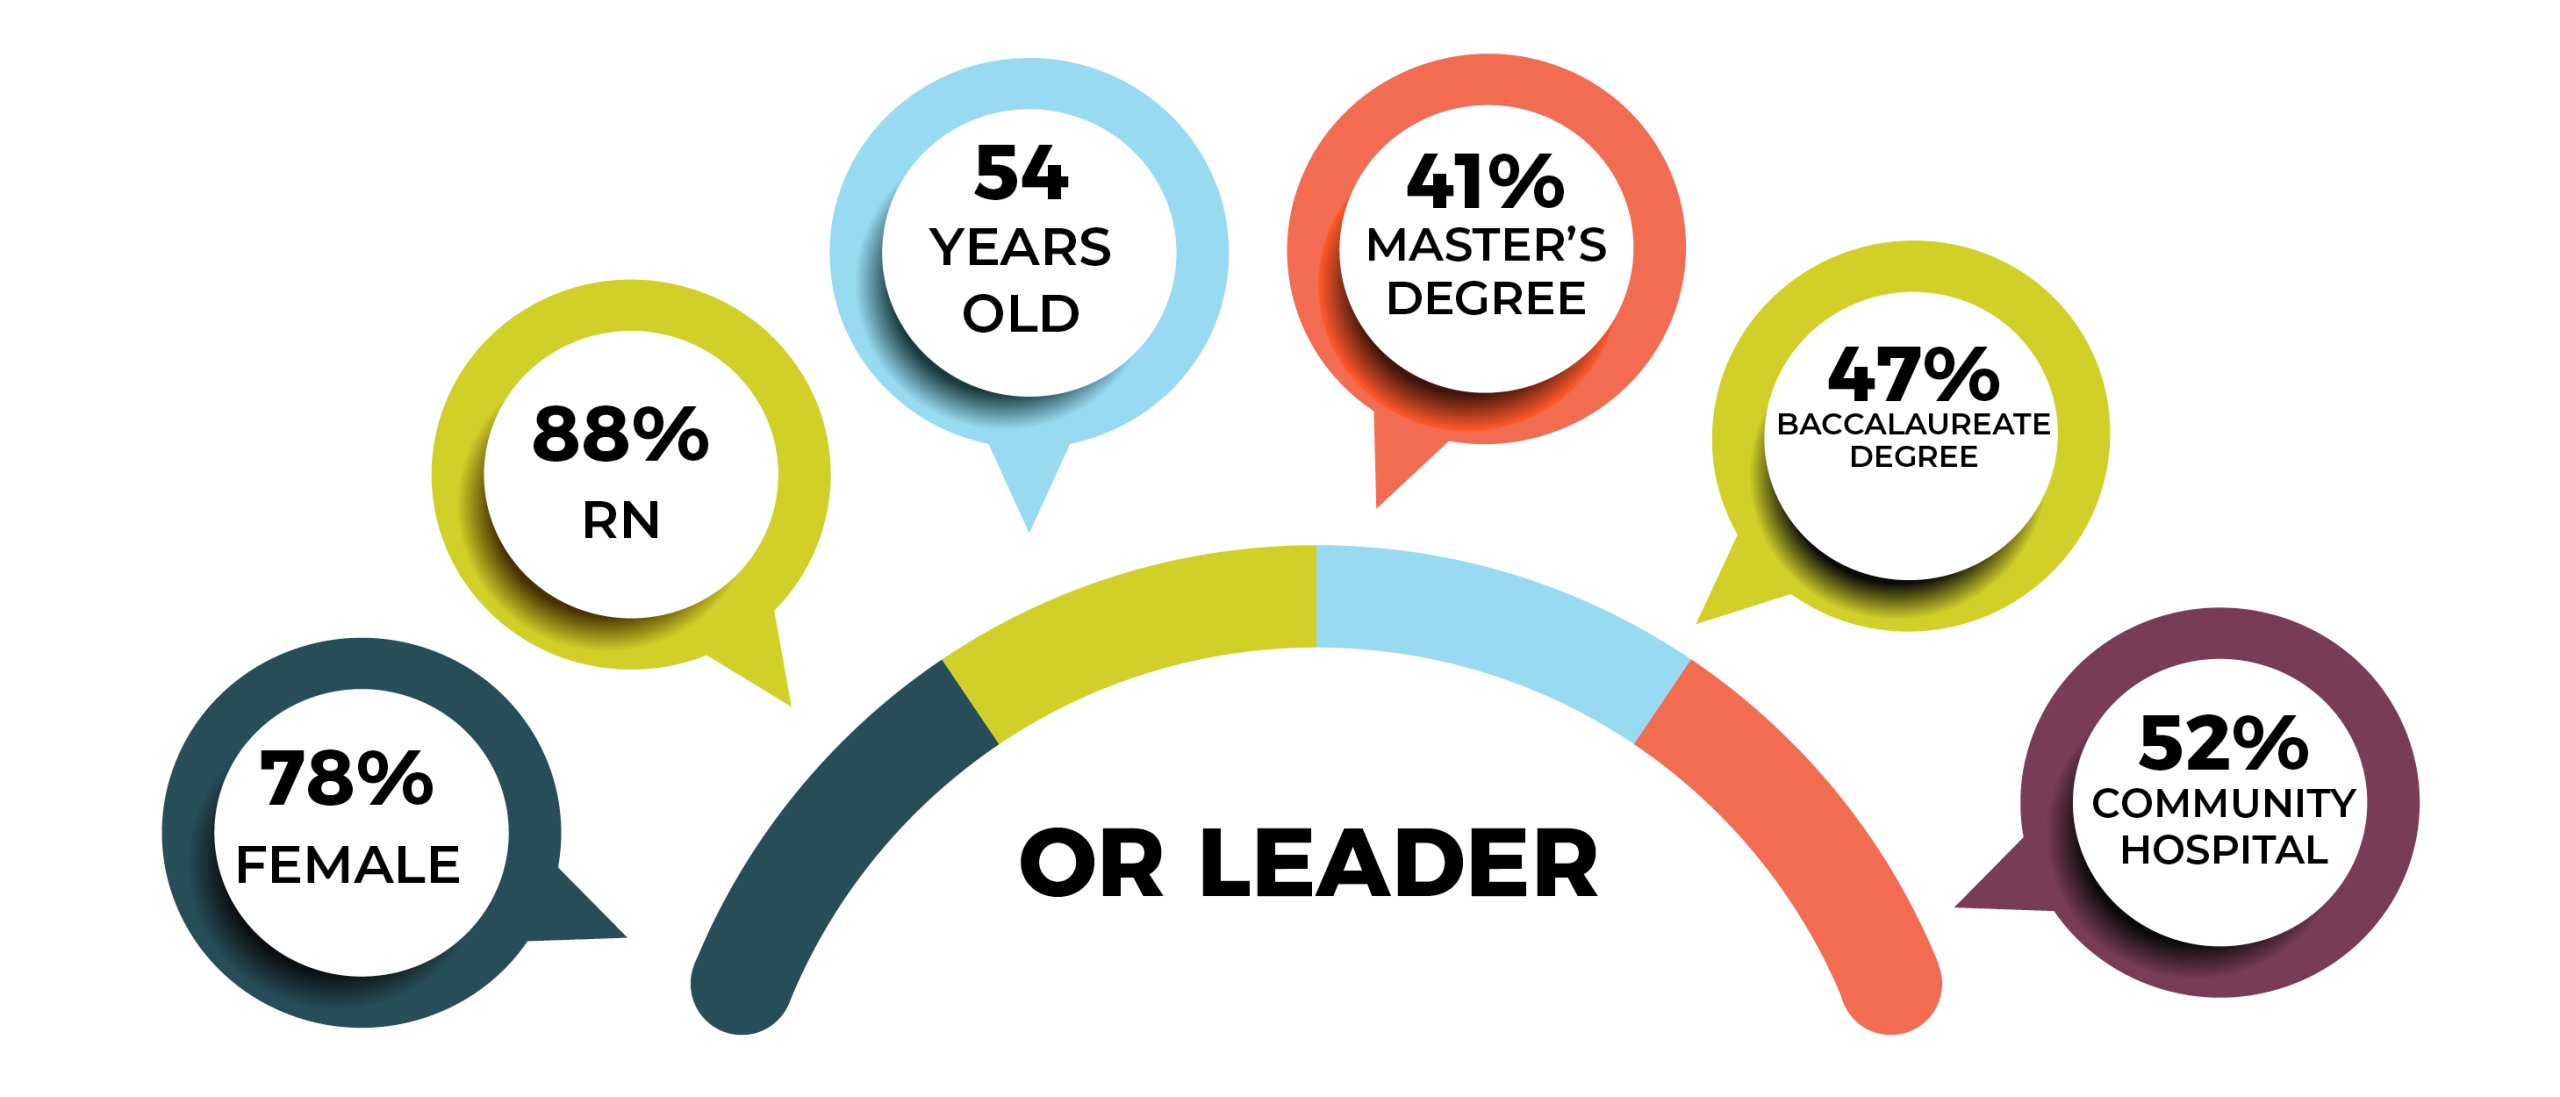
The average age of the OR leaders who responded to the survey is 54, just a year more than the average age of 53 for nurses overall, according to the 2017 National Nursing Workforce Survey. Interestingly, the average age in 2010 was 53.
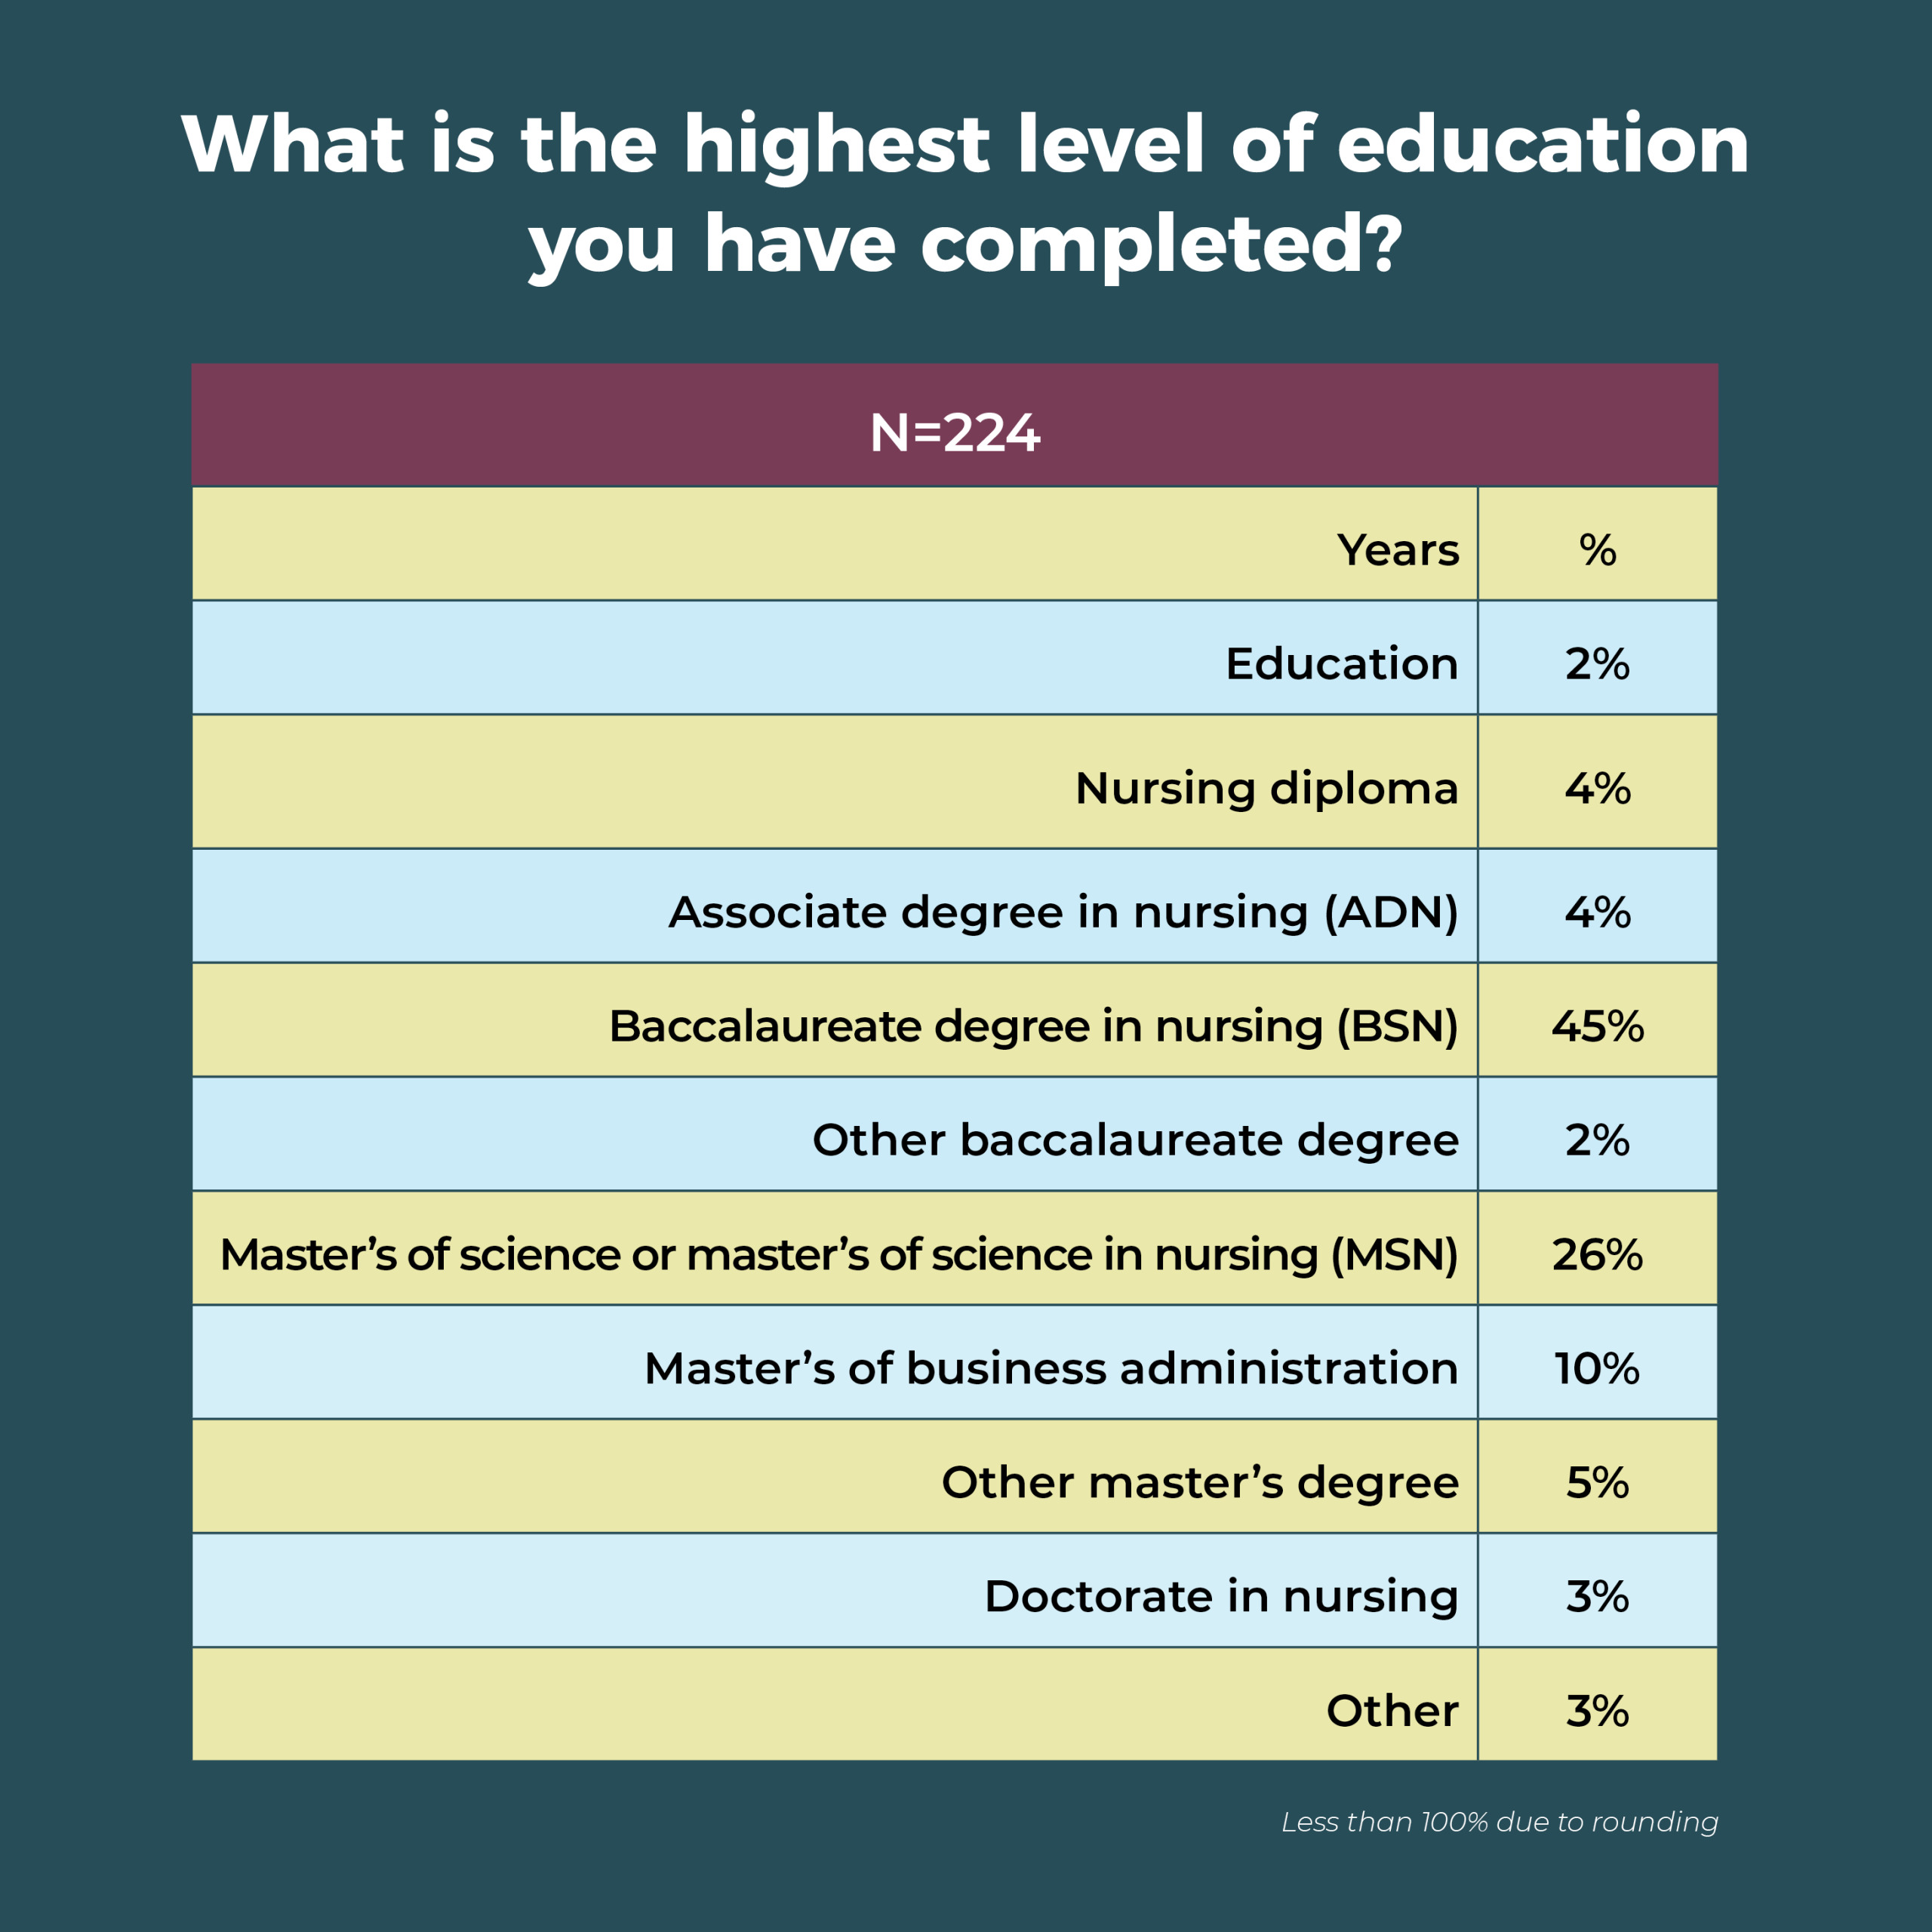
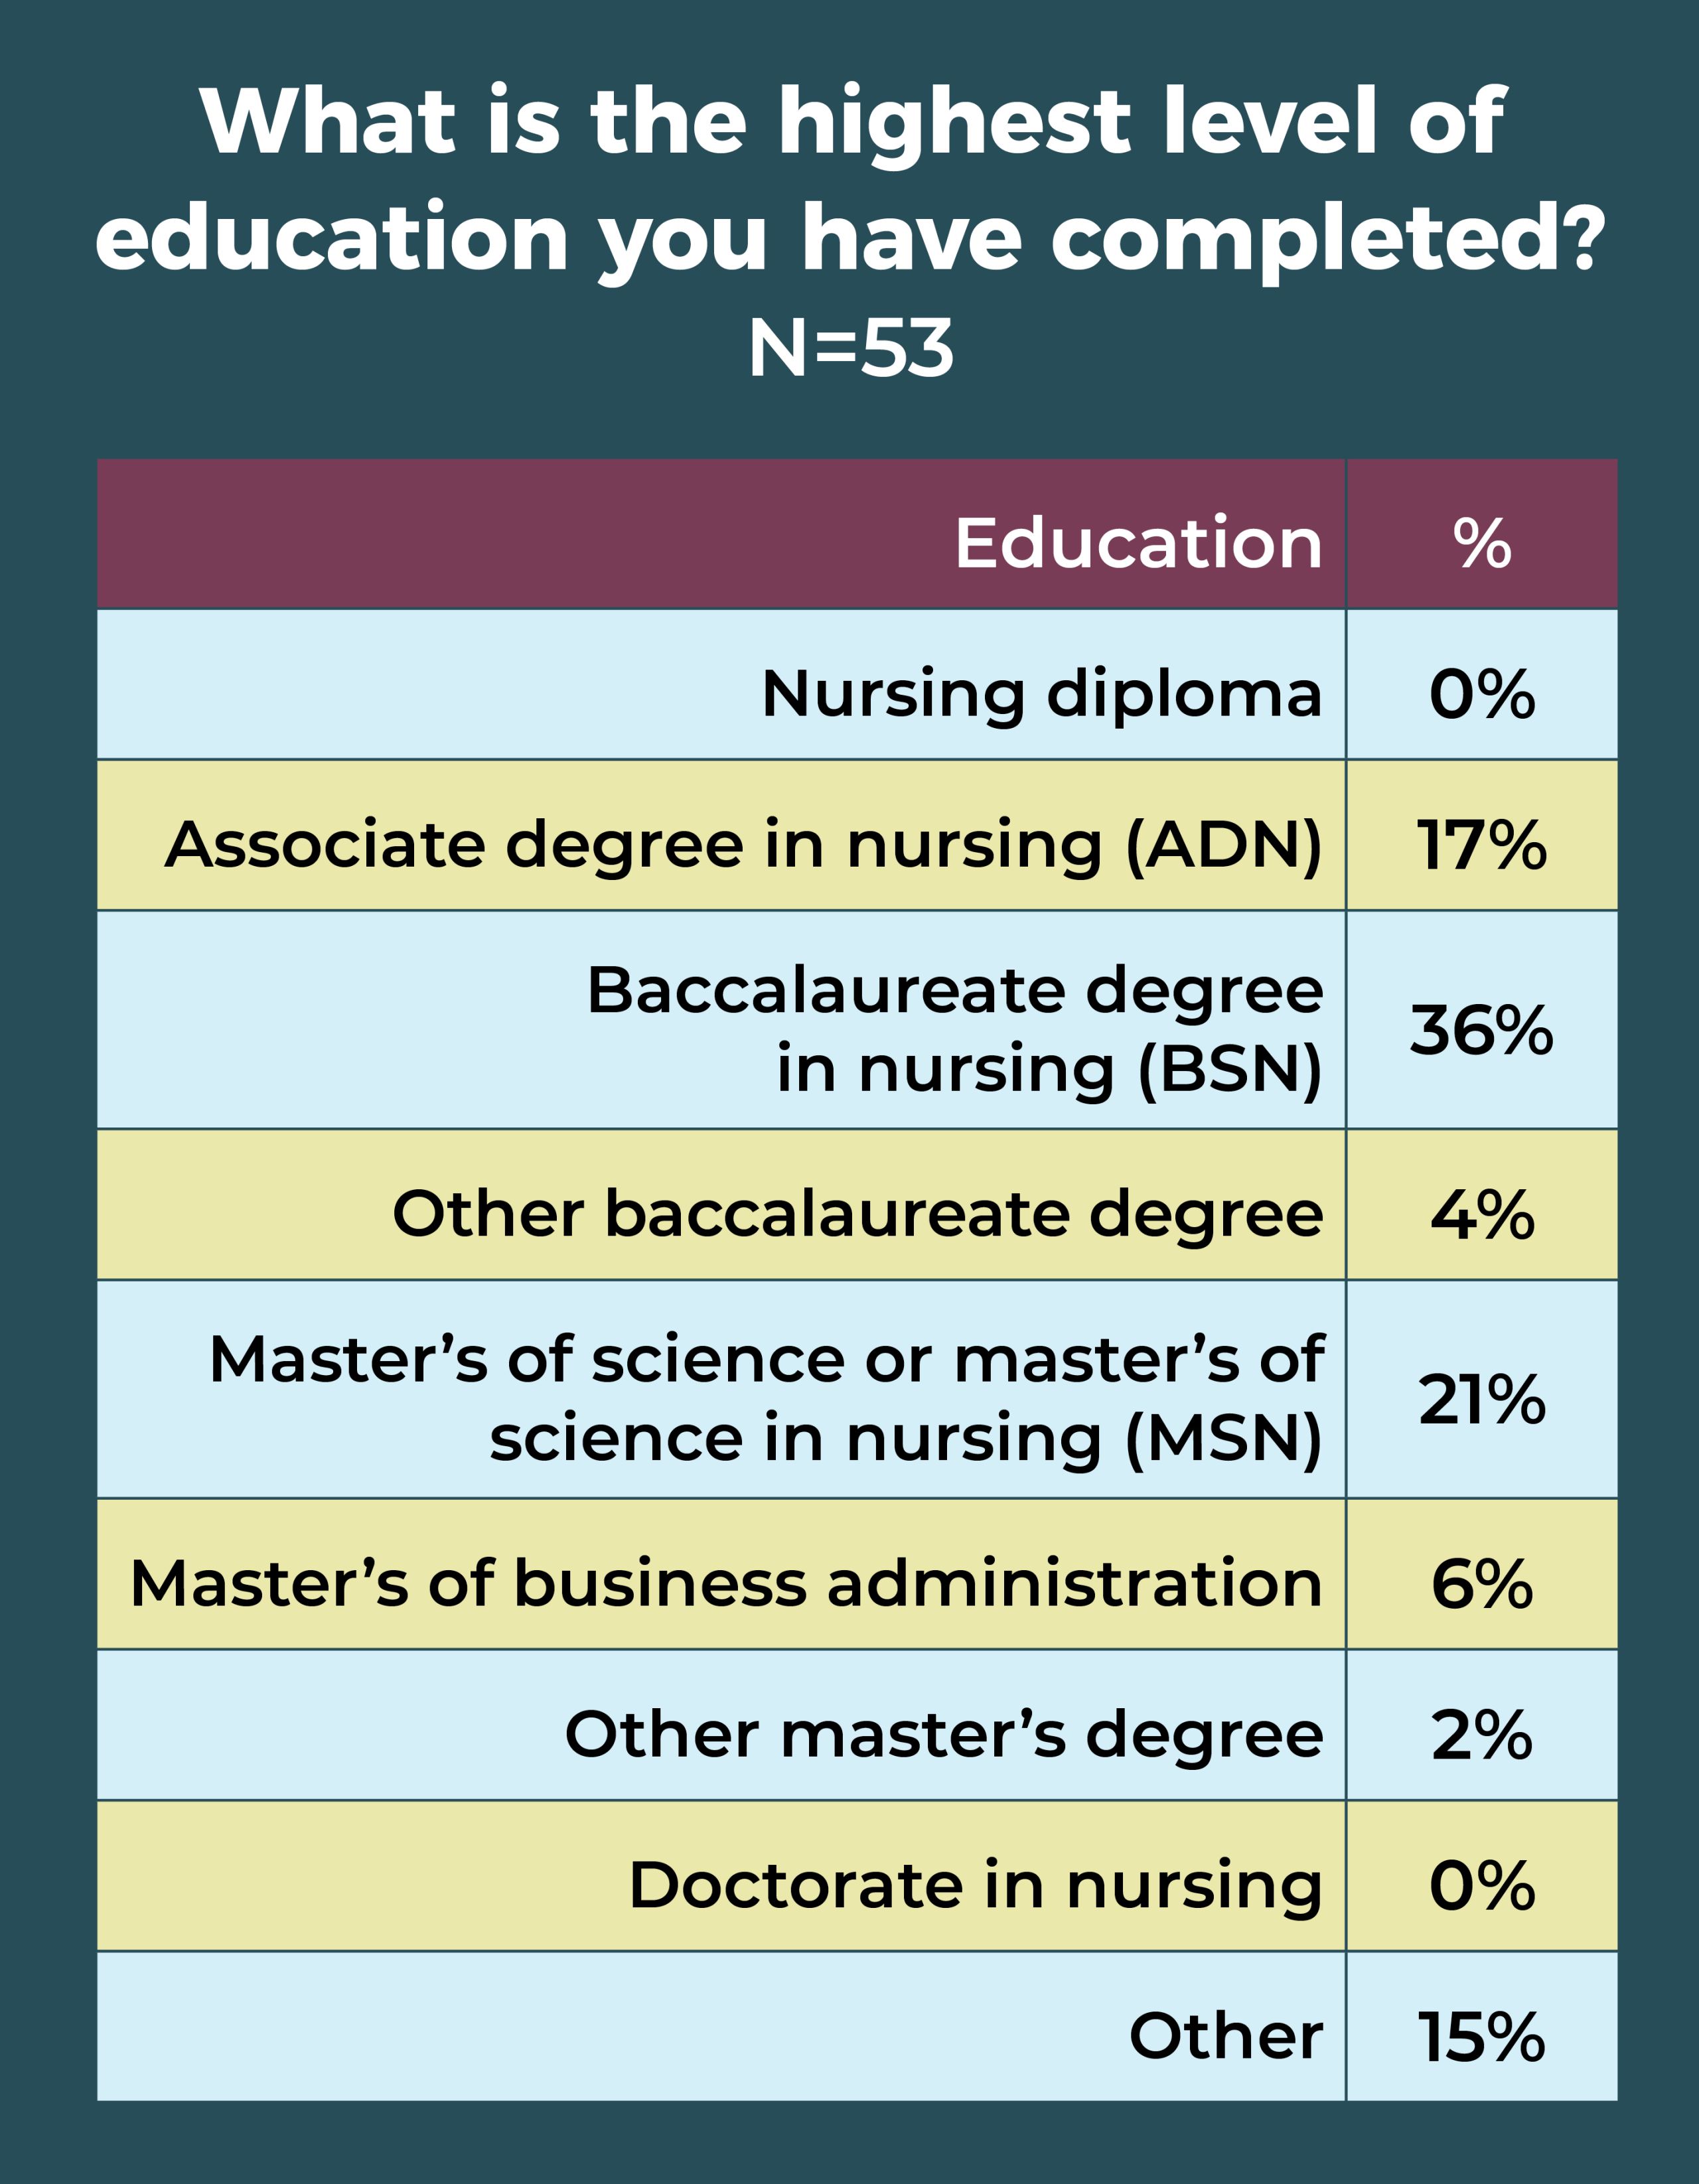
In all, 41% of OR leaders have a master’s degree as their highest level of education, compared to 47% last year. Most master’s degrees are in nursing (26%). Only 3% of respondents hold a doctorate in nursing, and 45% report their highest level of education as a baccalaureate in nursing.
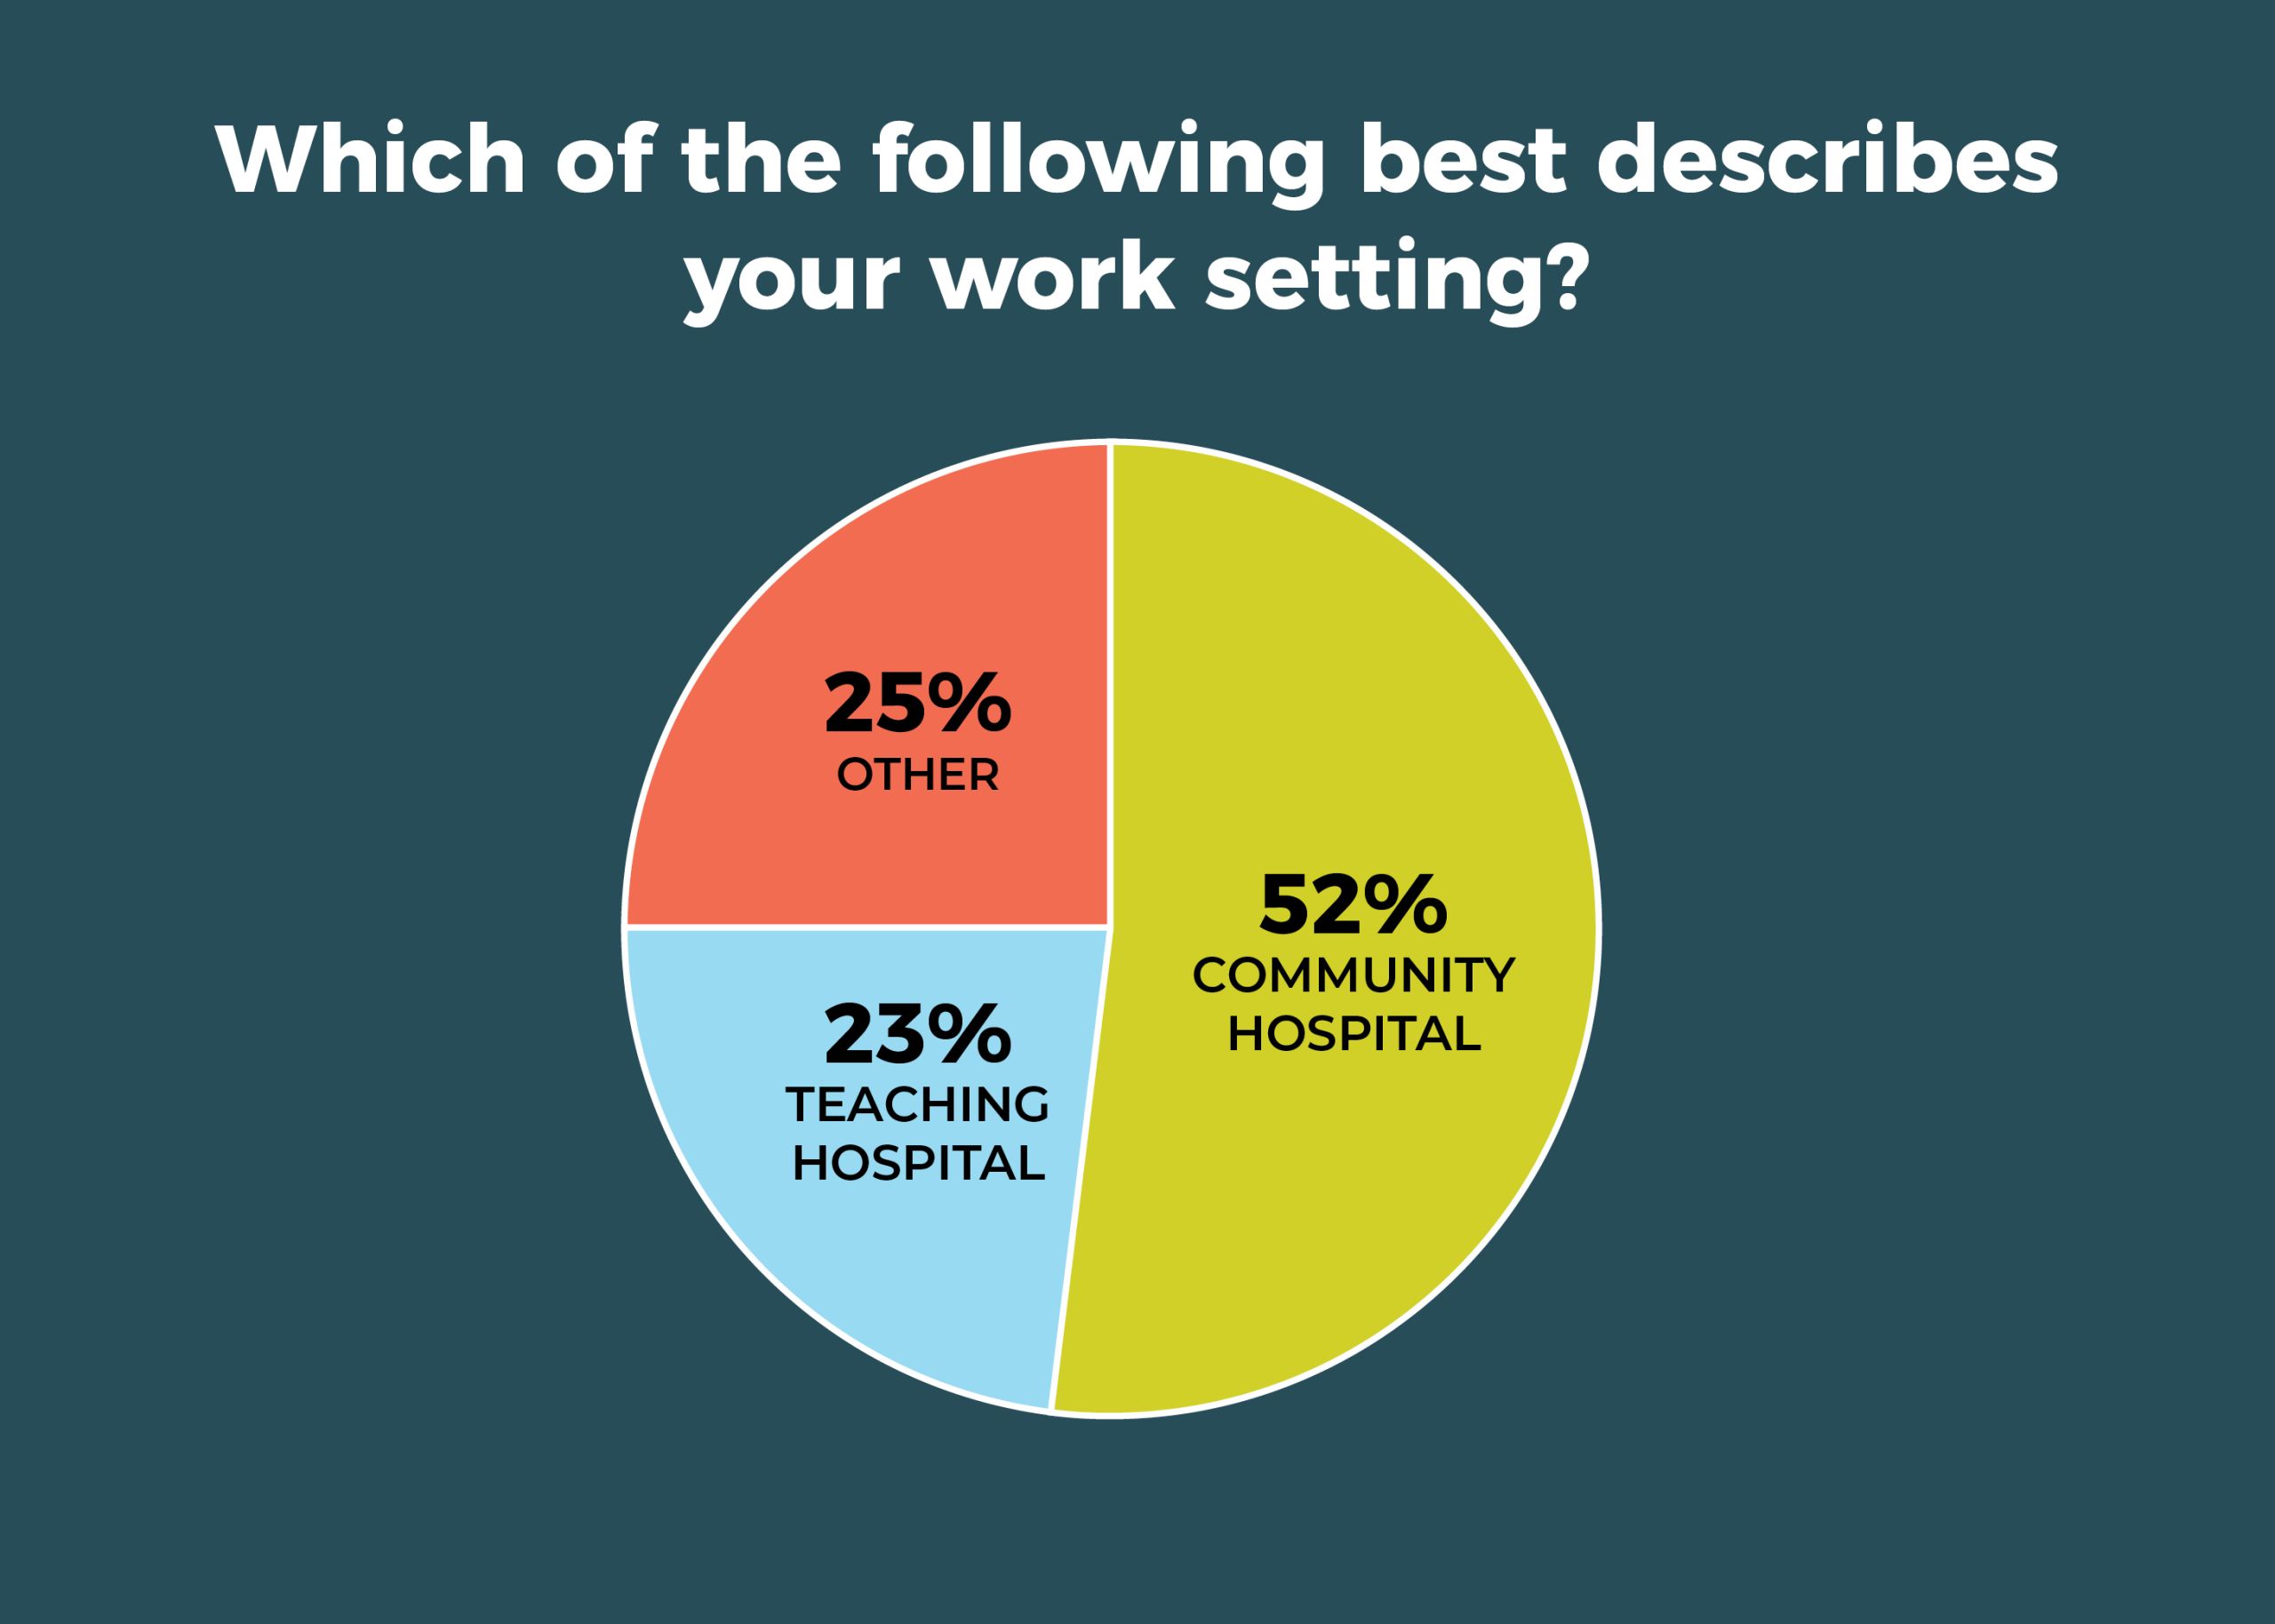
A total of 52% of respondents work in a community hospital vs 23% based at teaching hospitals. The South had the highest percentage of respondents (42%), followed by the West (25%), Midwest (22%), and Northeast (11%).
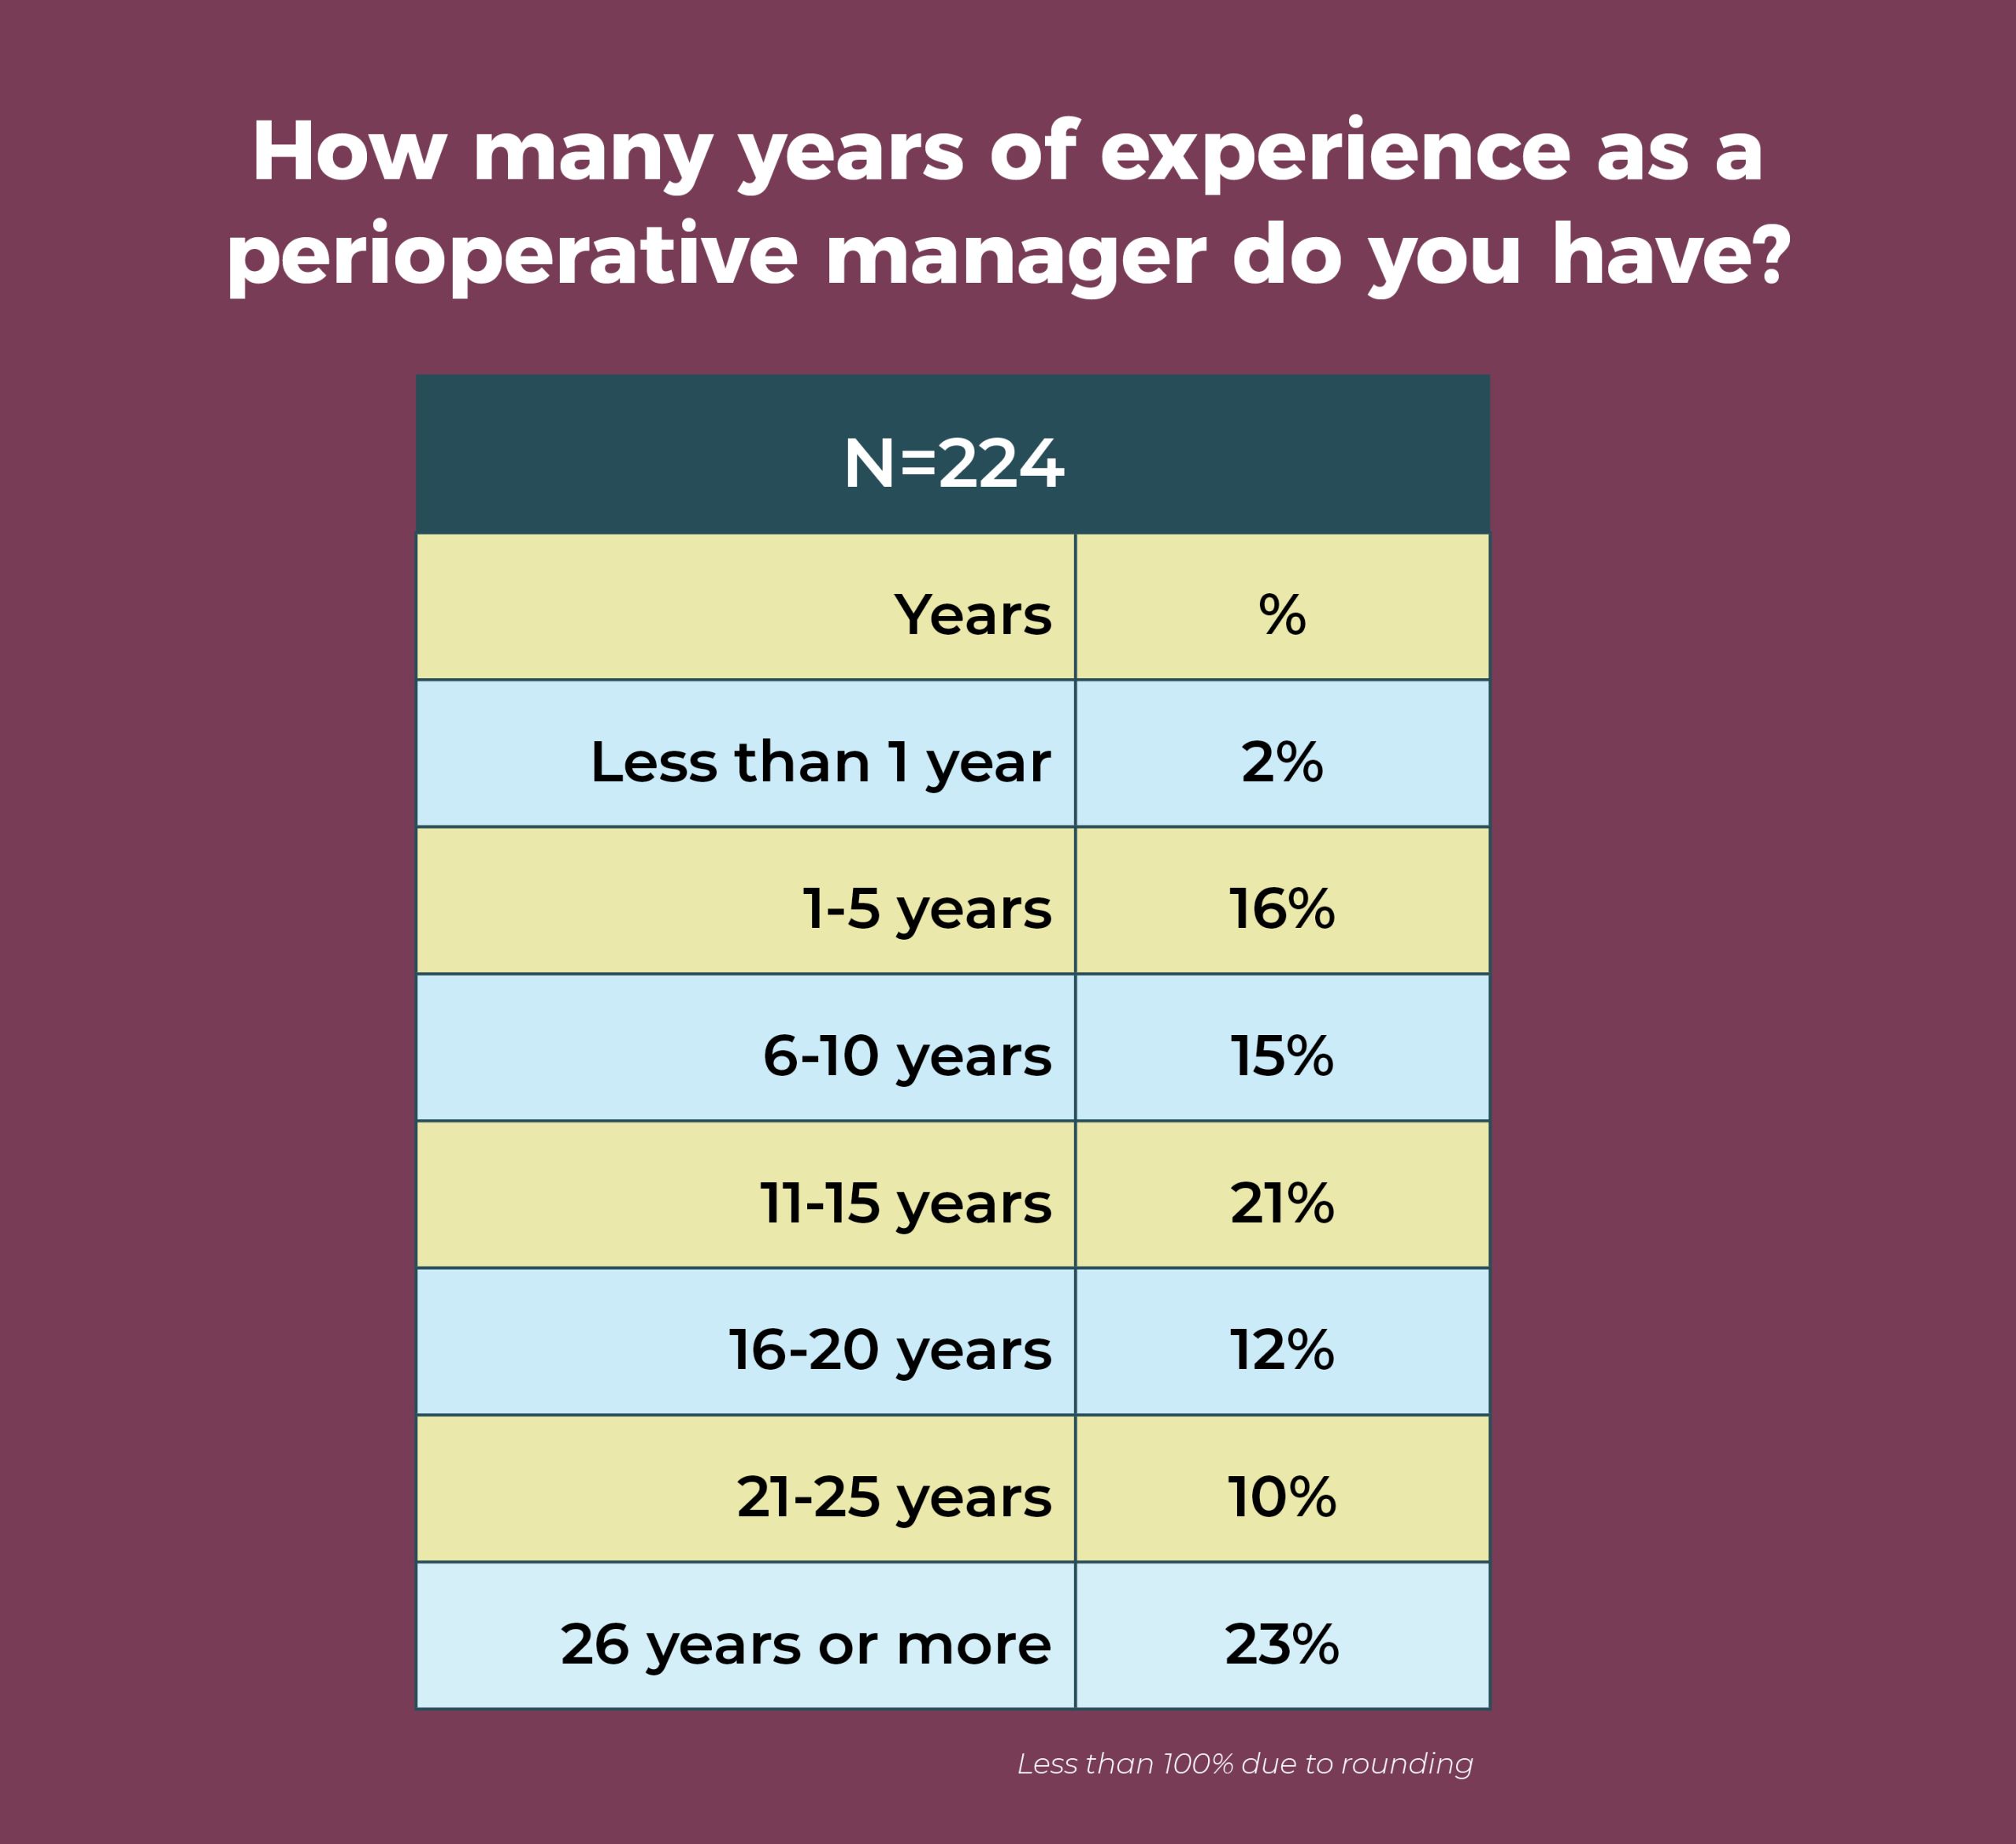
OR leaders are an experienced group, with 66% having more than 10 years of experience as a perioperative manager; nearly a quarter (23%) have 26 years or more experience. Of course, this also means that succession planning should be a top priority.
Finding time for succession planning could prove to be challenging because of work commitments. Overall, 41% of respondents work more than 50 hours a week, and another 32% log between 46 and 50 hours. Only 5% work 40 hours or less.


OR leaders’ compensation and satisfaction levels are higher, but that could easily change given the uncertainty associated with the COVID-19 pandemic. The next year will bring increasing challenges; fortunately, OR leaders are known for their ability to lead teams through difficulties. And, many have a positive outlook. As one respondent noted: “I work at a great organization, and our department has resources to support our needs. I have been in a leader role for greater than 20 years. This organization is the best I’ve ever worked at, and I have the resources to be successful. I LOVE my job.”
Cynthia Saver, MS, RN, is president of CLS Development, Inc, Columbia, Maryland, which provides editorial services to healthcare publications.
ASC staffing and surgical volume drop in response to pandemic


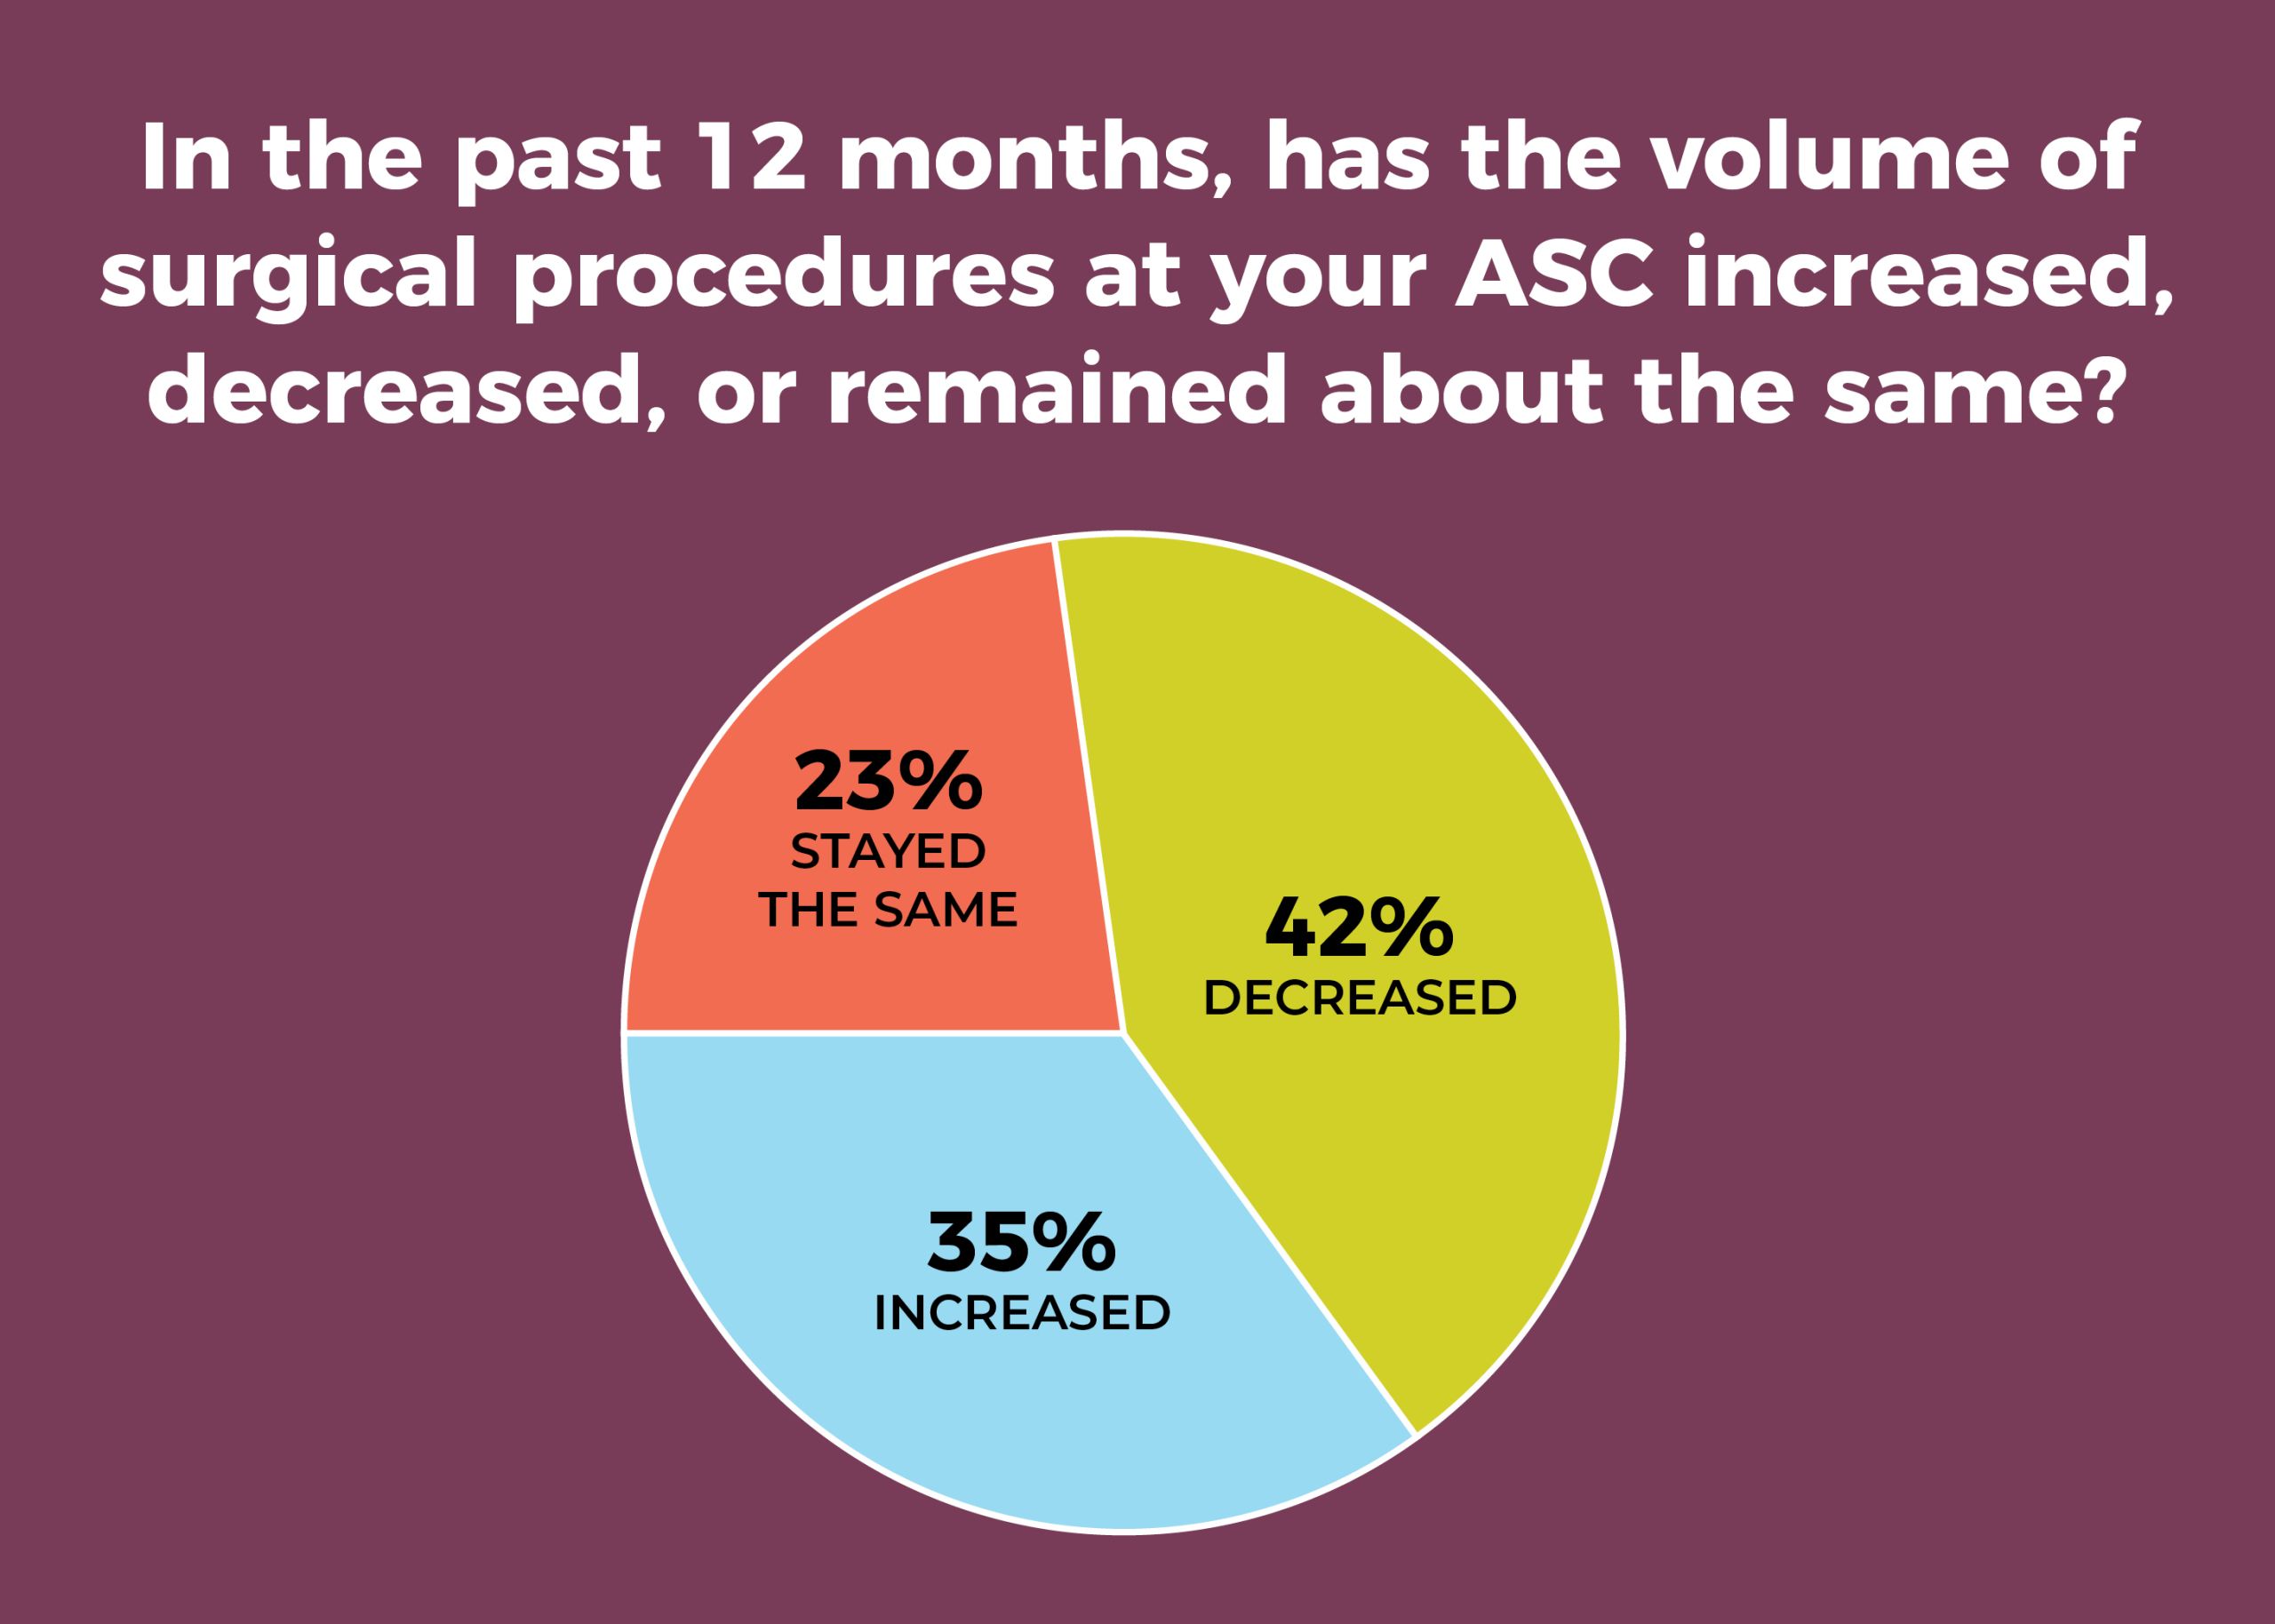
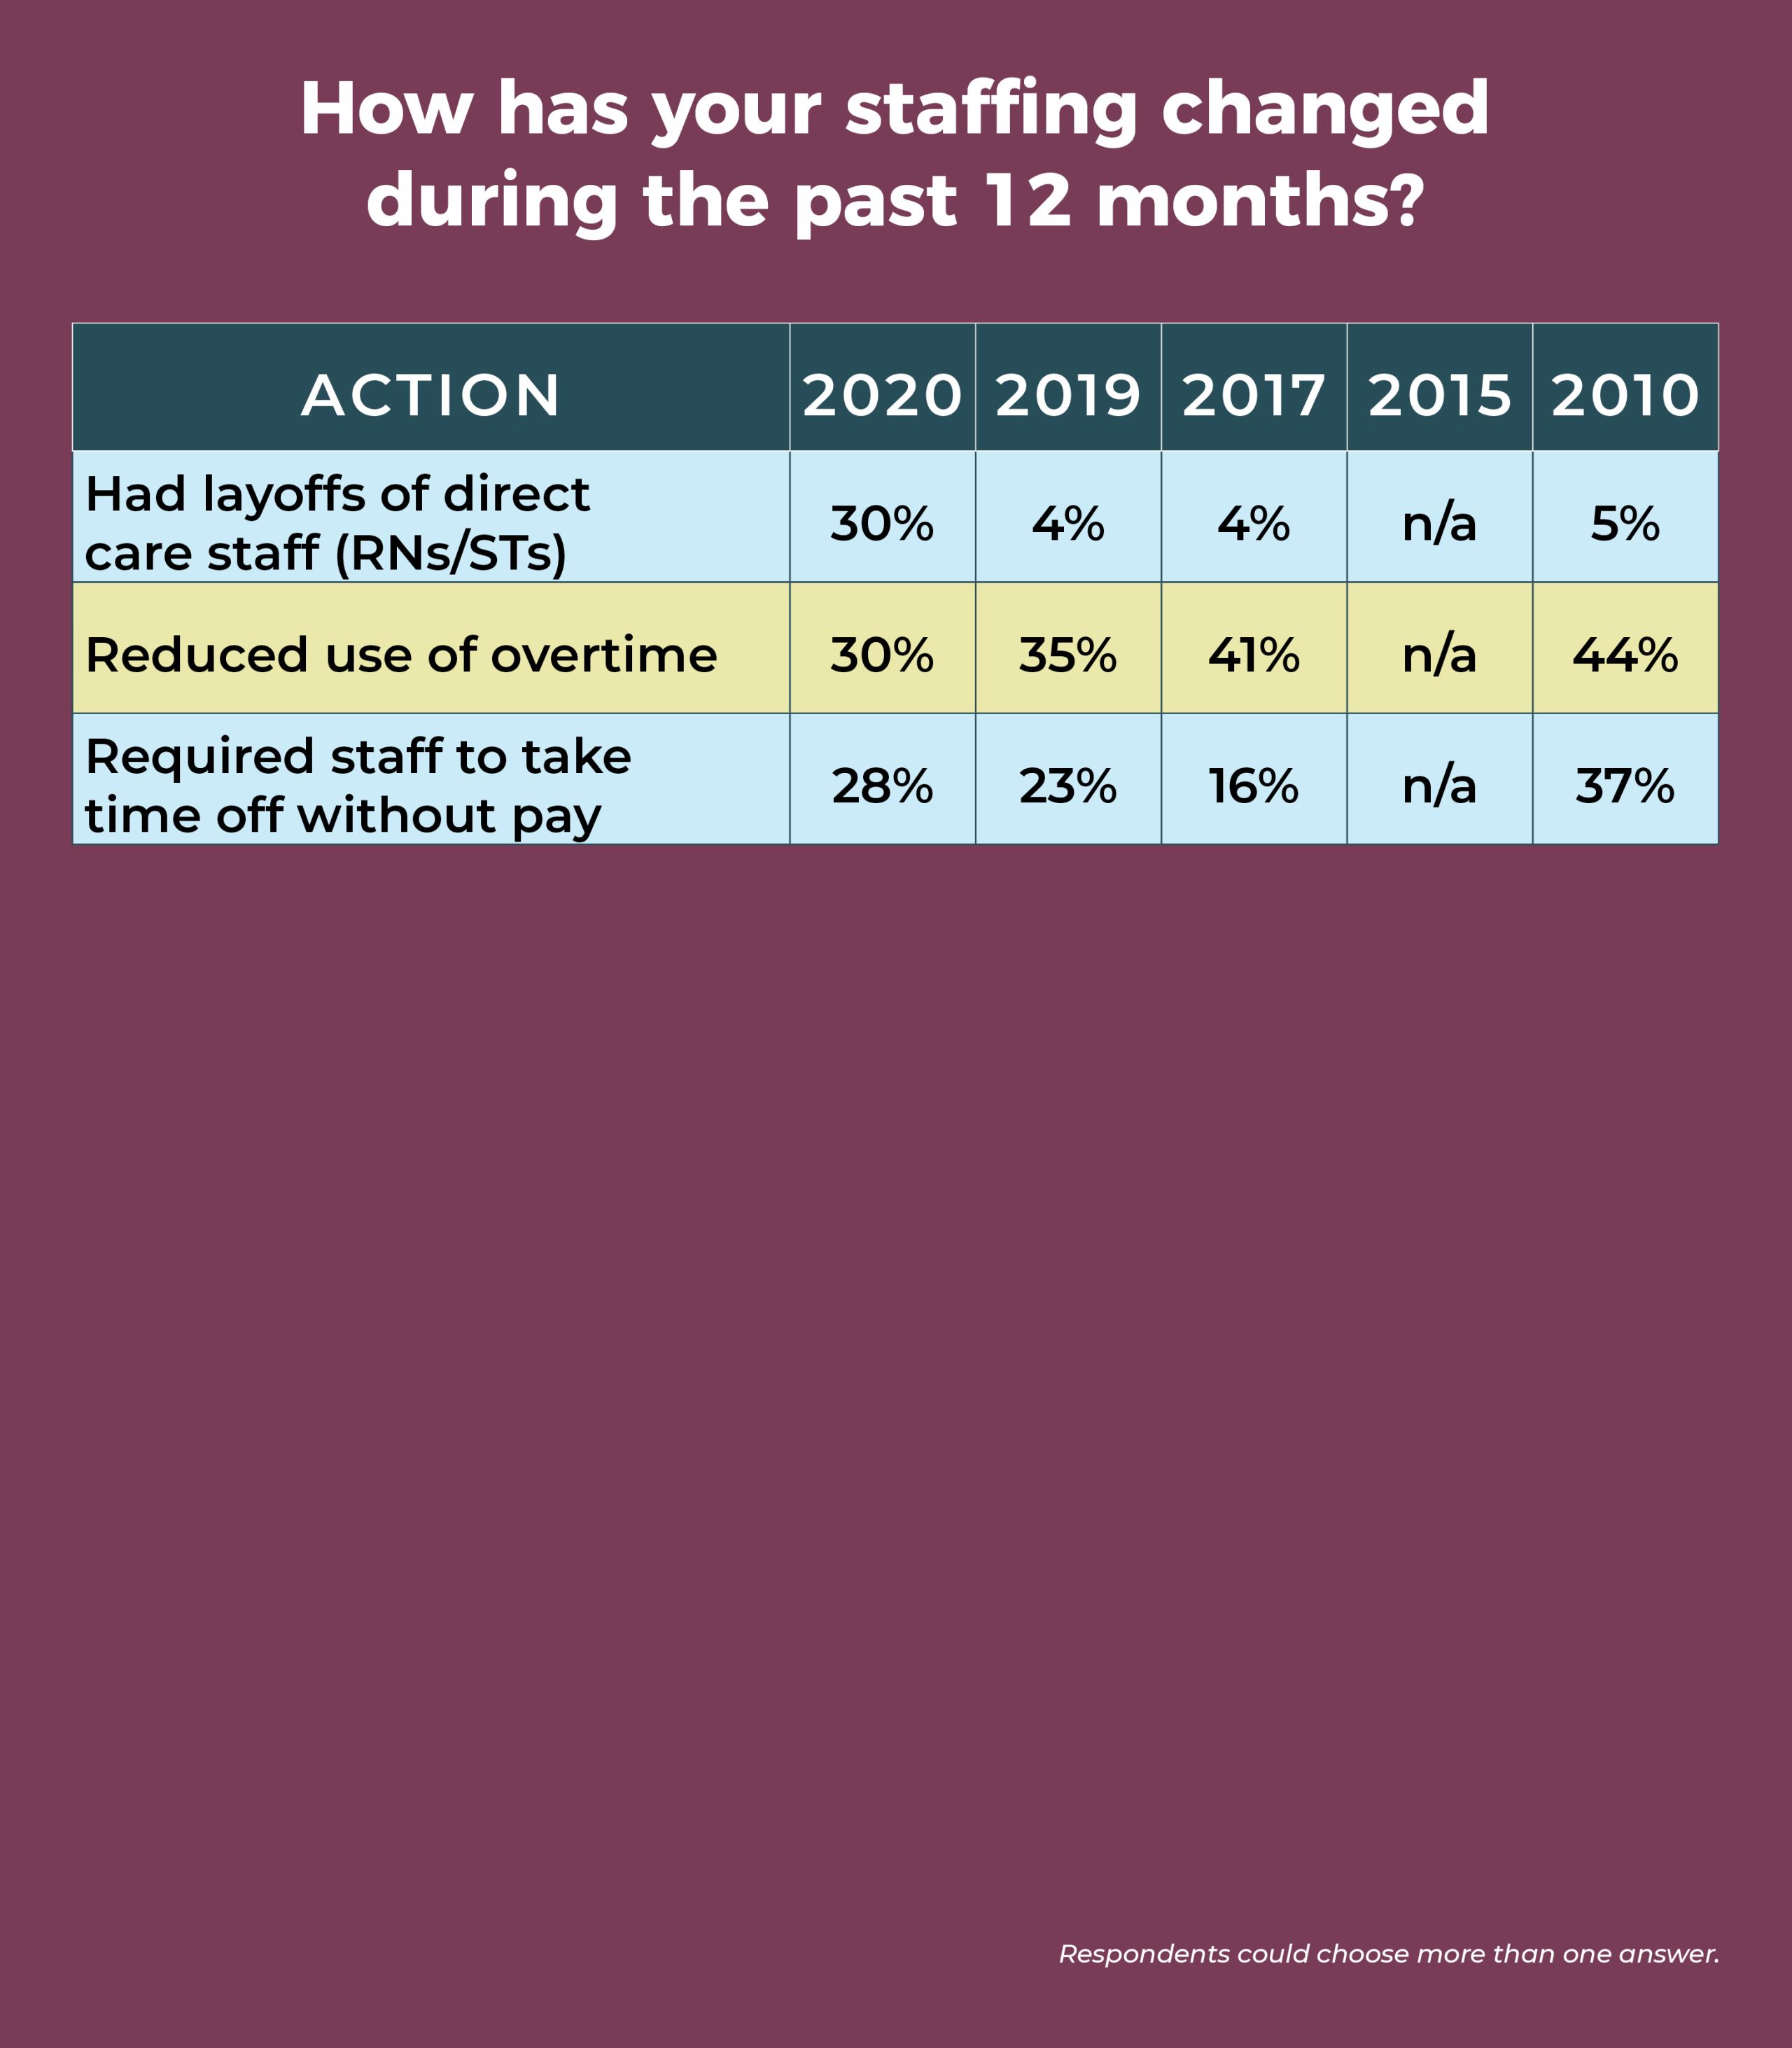
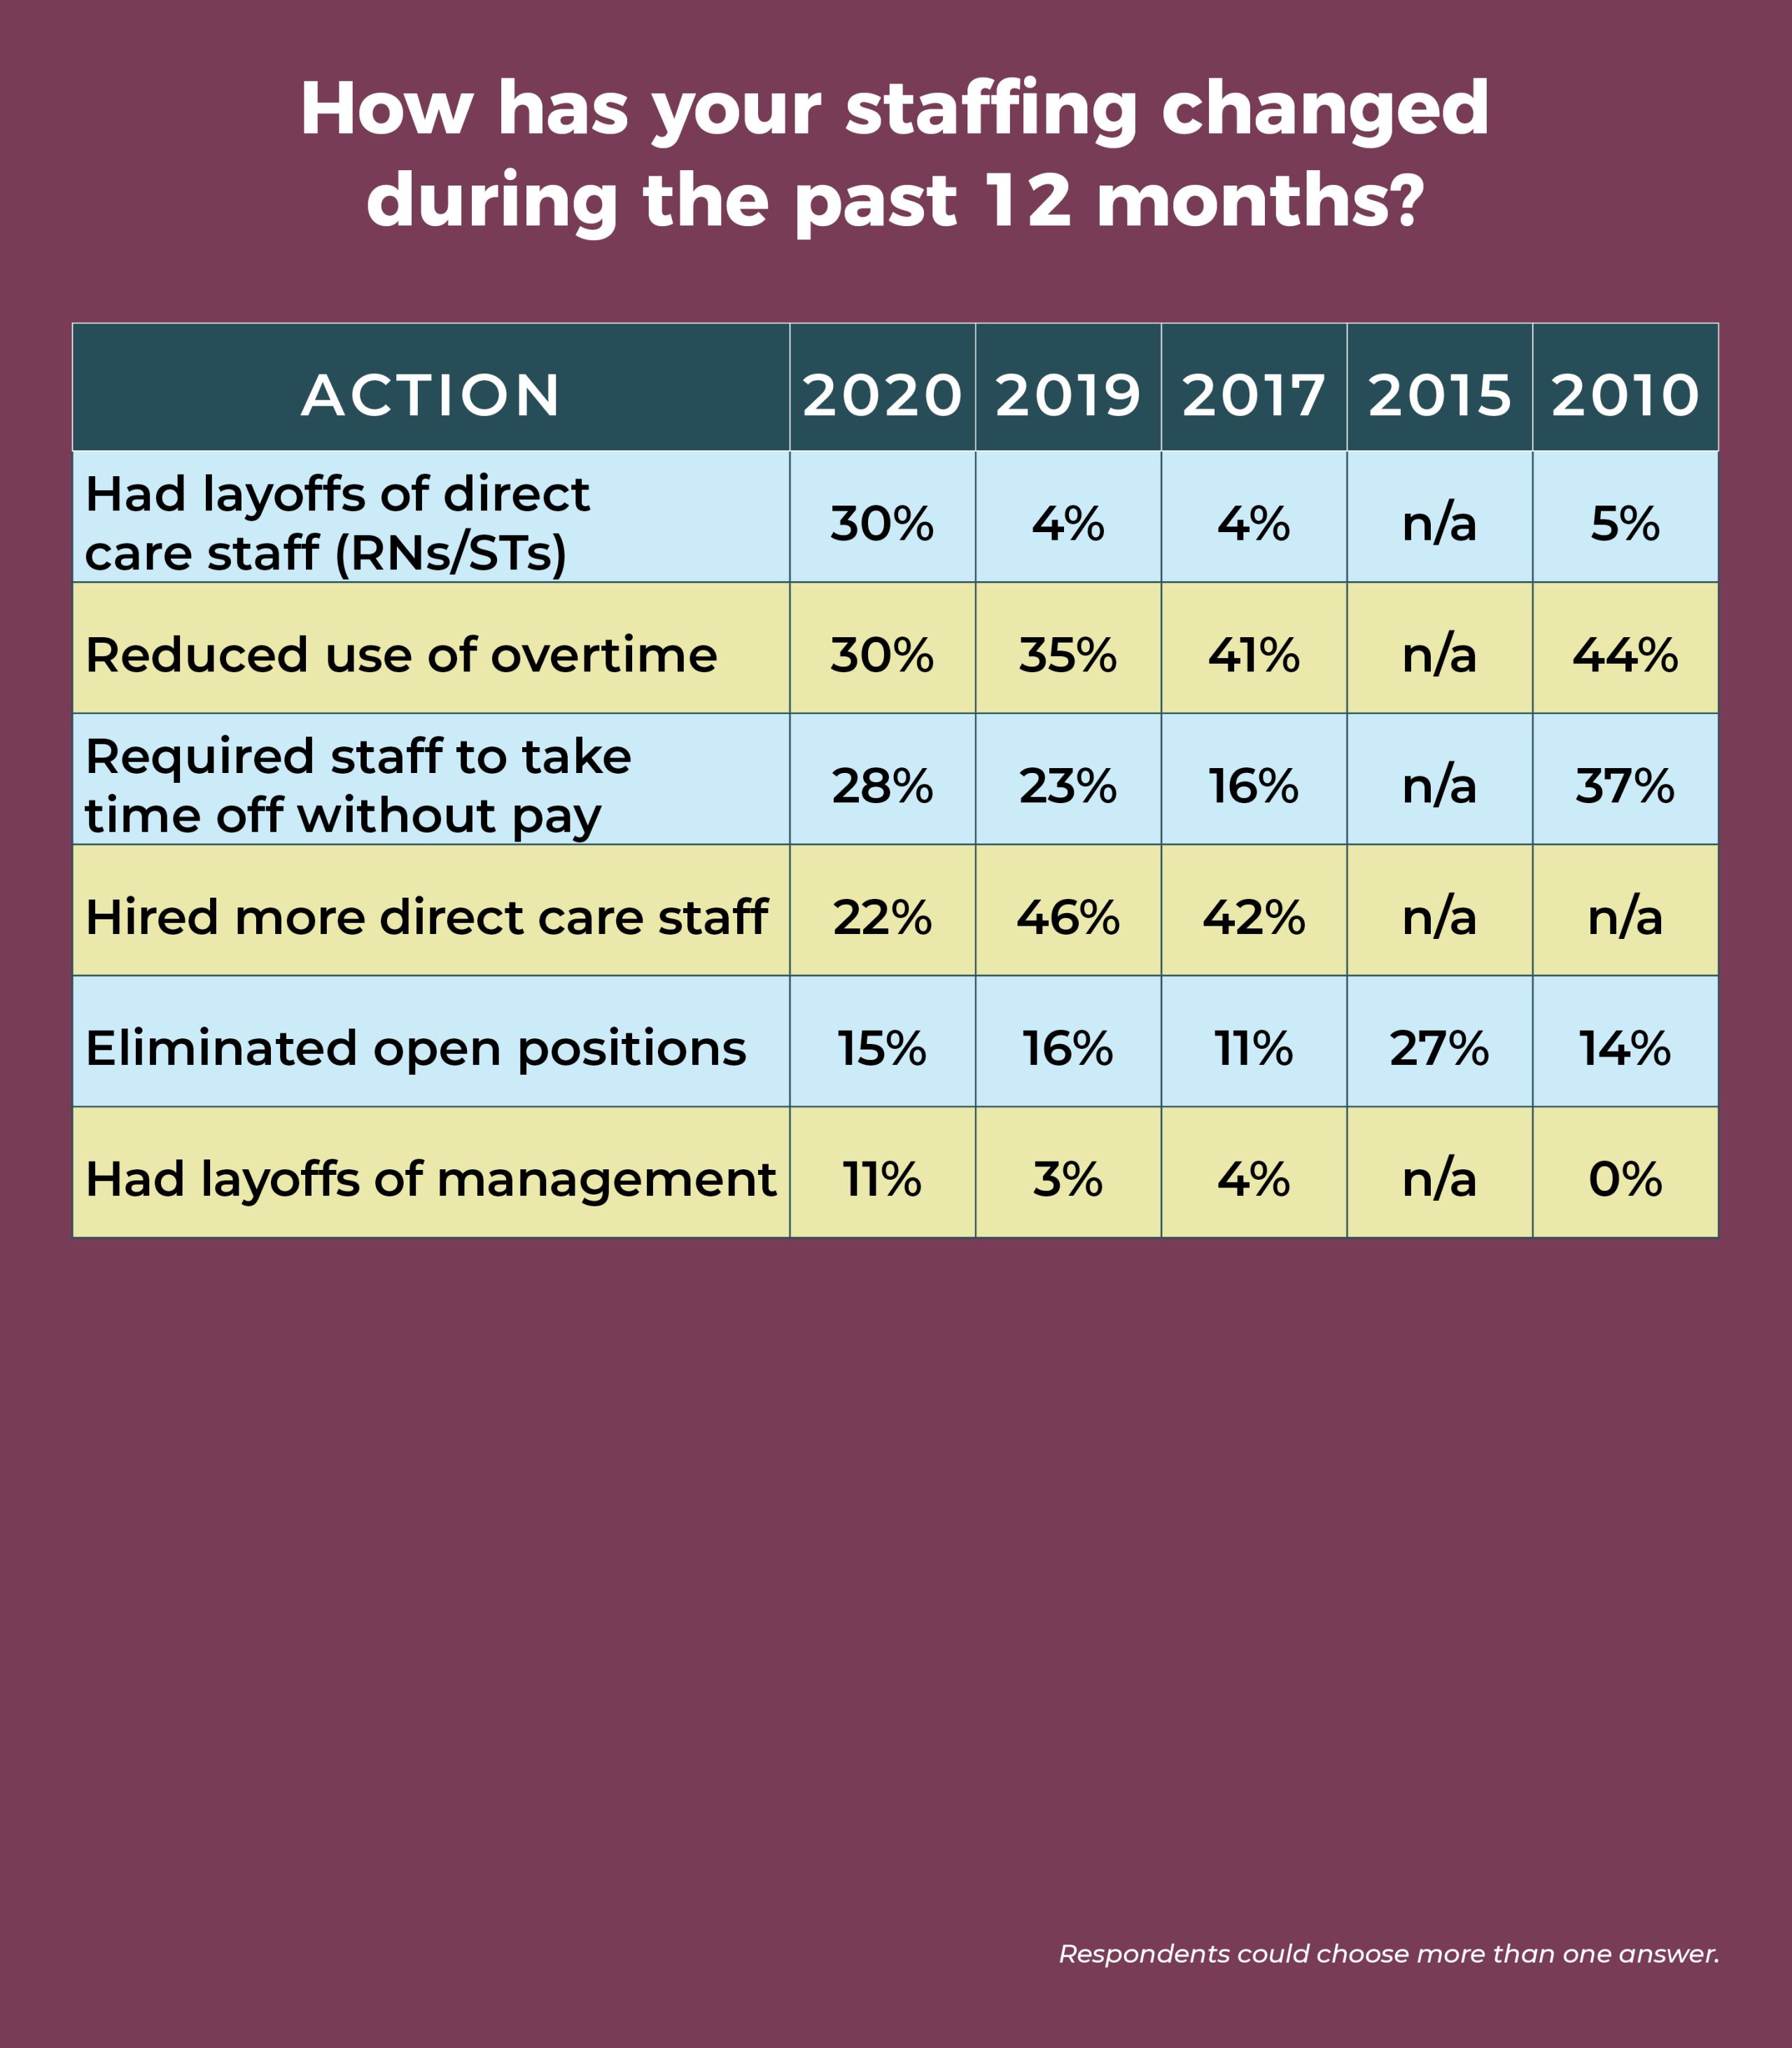
Nearly a third (30%) of ambulatory surgery center (ASC) leaders have experienced layoffs of direct care staff during the past year, according to the 2020 annual OR Manager Salary/Career Survey, up from a mere 4% in 2019. COVID-19 is the likely culprit: Most of the comments received in response to an open-ended question about the effects of COVID-19 cited staff-related issues such as furloughs (sidebar, “Impact of COVID-19”). Another hard-hit area was volume, with the percentage reporting decreased volume over the past 12 months more than doubling, from 20% in 2019 to 42% this year (vs 19% in 2015).
Overall, however, turnover and open positions remain stable. Nearly one-fourth (24%) of ASC leaders reported increased RN turnover, and 30% said the number of RN positions had increased, comparable to the 26% and 30%, respectively, seen in 2019. More than half of respondents (54%) have no open RN positions, and more than two-thirds (67%) have no open surgical technologist (ST) positions. This could be another effect of the pandemic and the associated economic downturn, which often brings hiring freezes and a tendency not to change jobs.
For ASC leaders who are still recruiting, half are finding it harder to recruit experienced OR nurses compared to 12 months ago, and nearly half (48%) report that it’s harder to recruit STs.

Other key findings of the survey include:
- Only 11% of respondents plan to add additional ORs within the next 12 months.
Fully 60% are not using data analytics to help with surgery scheduling.
Here is a closer look at some more survey results, including some data from the past decade.
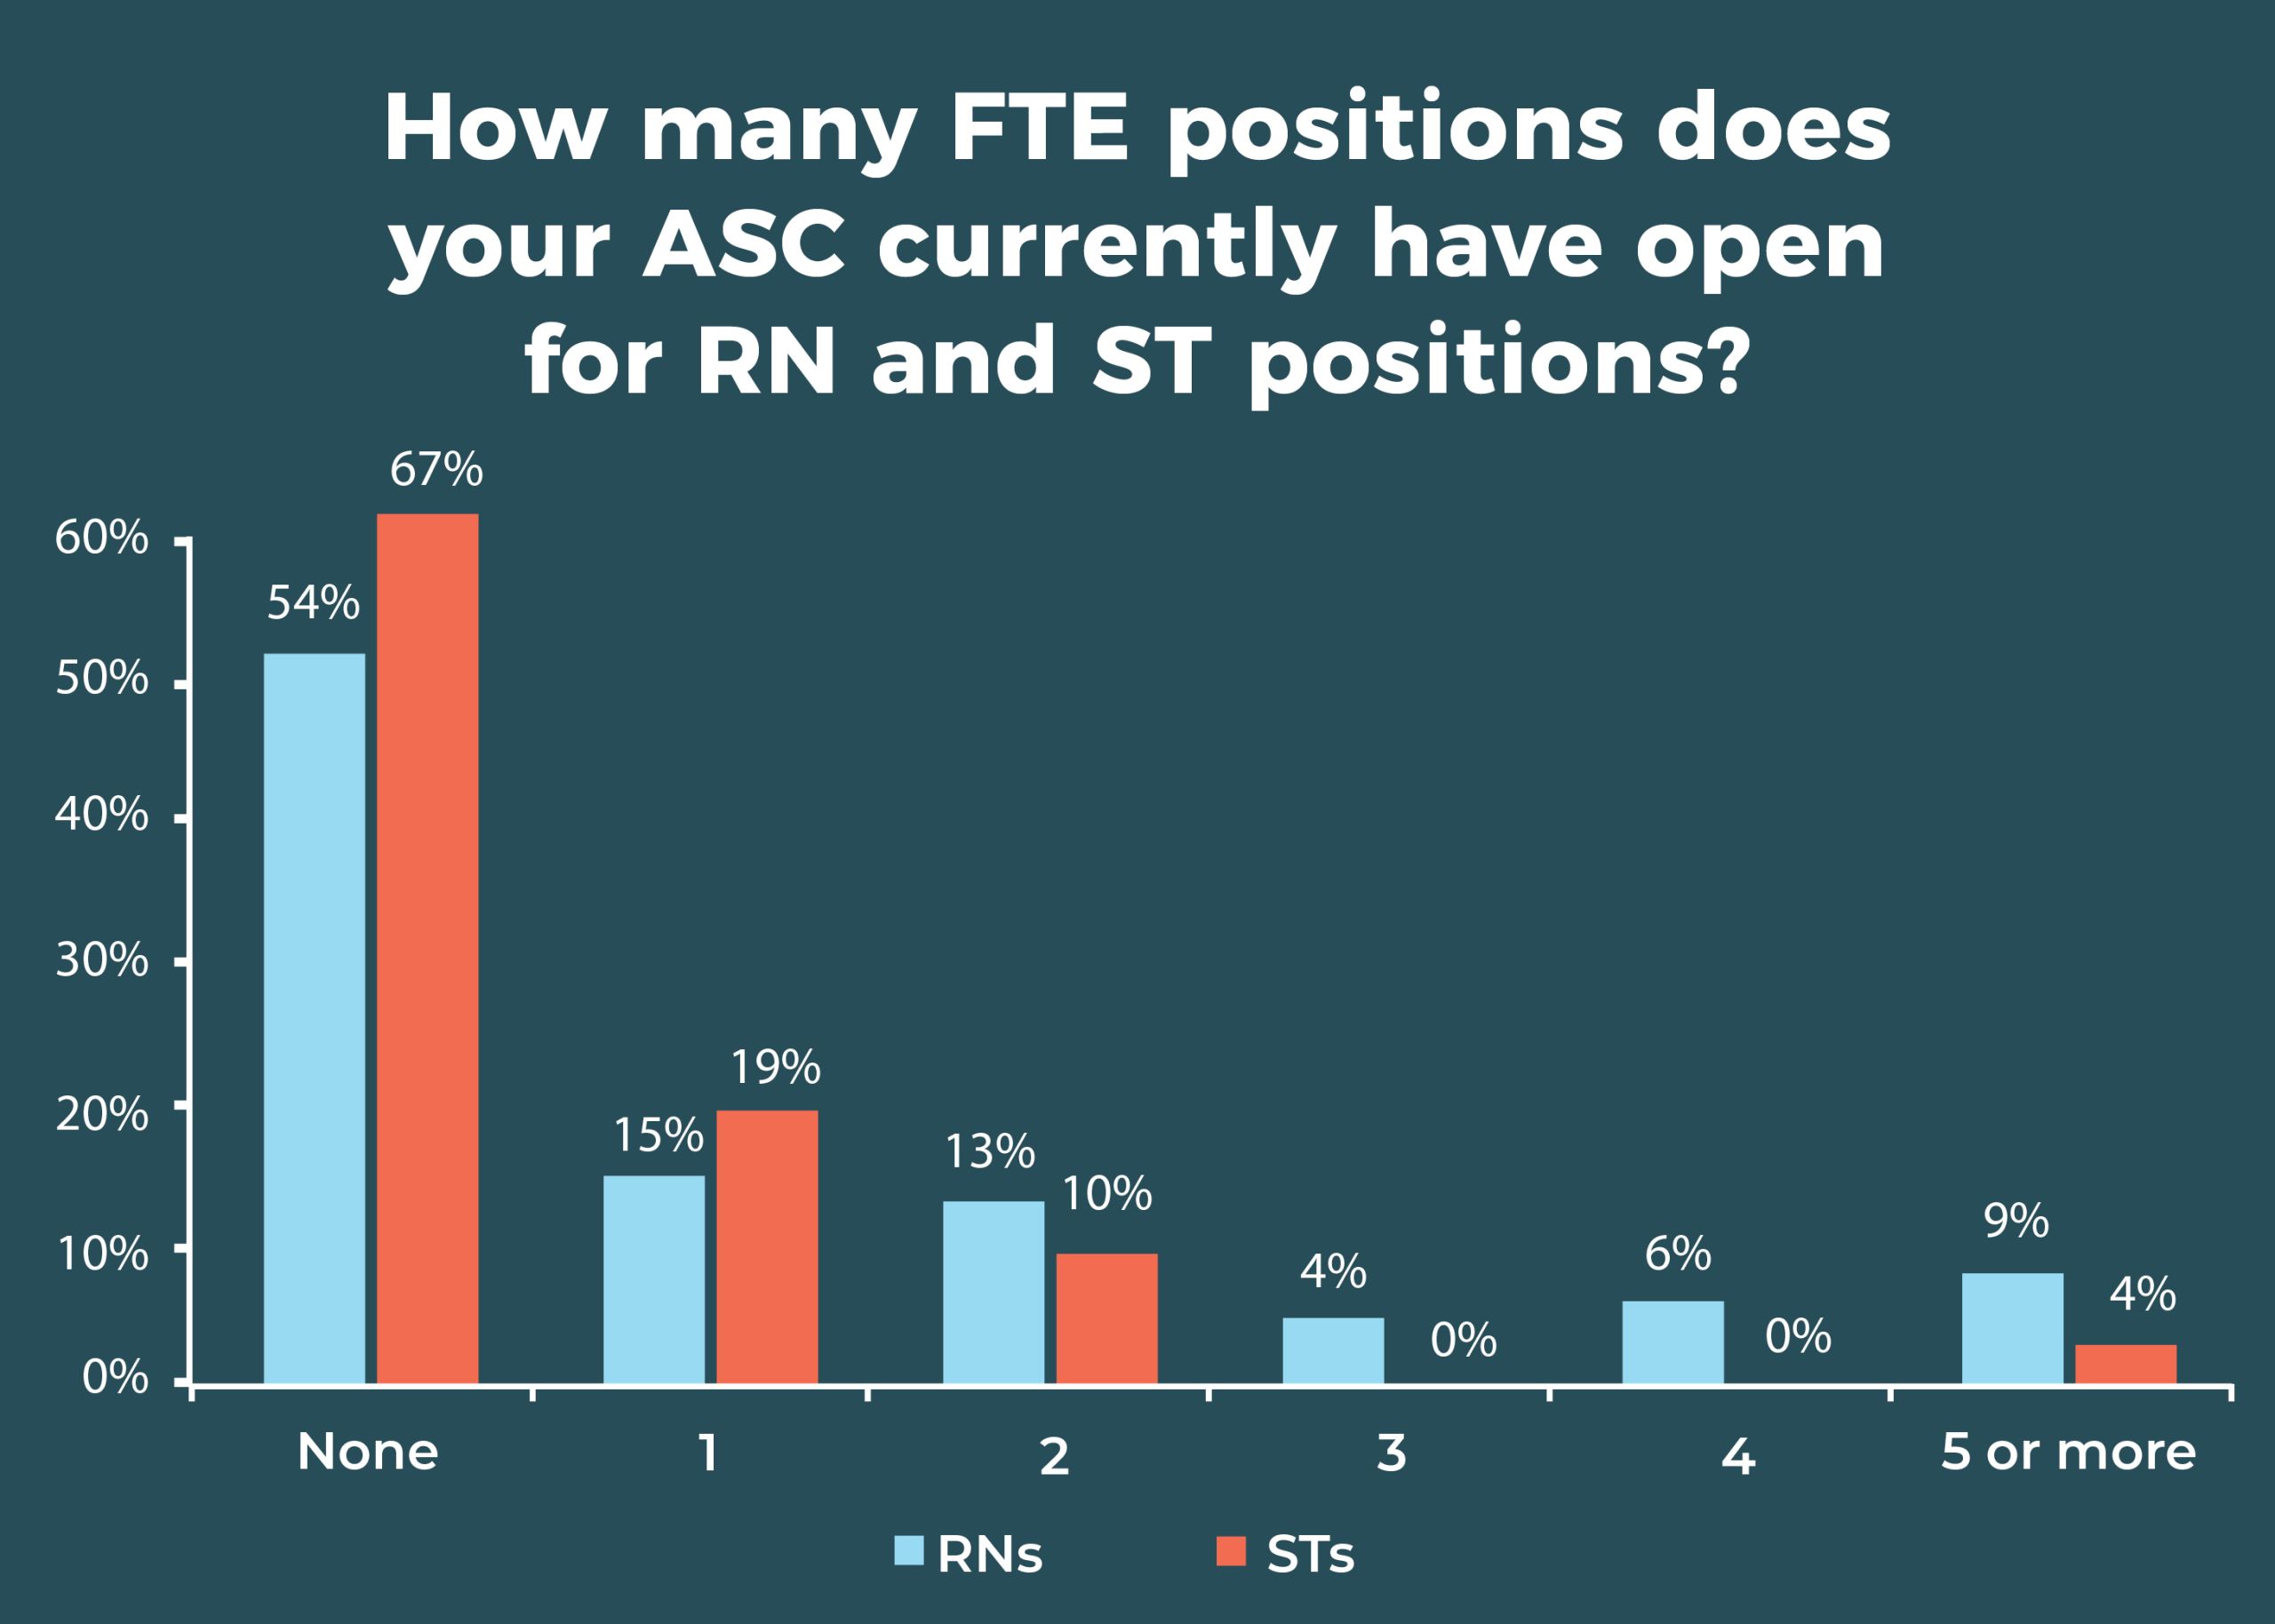

A total of 72% of respondents report that their ability to recruit new or inexperienced OR nurses has not changed in the past 12 months; 43% say recruitment for STs hadn’t changed. Although most respondents have no open RN or ST posi tions, 15% had space for 1 RN and 19% were seeking 1 ST. About one-fifth (22%) of ASC leaders report that the number of open ST positions increased over the past 12 months, whereas 59% said it remained the same.
The percentage of those reporting increased RN turnover has remained fairly consistent over the past 5 years, ranging from 22% to 30%. Similarly, the percentage reporting an increase in RN open positions ranges from 26% to 34%.
Congruent with the jump in the number of staff layoffs, the percentage of ASC leaders who hired more direct care staff over the past 12 months dropped from 46% last year to 22% this year. The percentage of those who increased use of agency or travel staff fell from 14% in 2019 to 4% this year.
Leaders aren’t immune to the staffing challenges; 11% reported management layoffs in the past year. That might seem like a small percentage until one considers that in the past it has consistently been below 5%, and in 2019, it was just 3%.


The average surgical volume was 4,510 procedures annually (compared to 5,115 in 2019), but there was a wide range of responses (250 to 30,000).
The uptake of care models—Accountable Care Organizations, joint ventures, Enhanced Recovery After Surgery (ERAS), Perioperative Surgical Homes, and dual-license facilities—was once again low. In all, 57% (vs 63% in 2019 and 59% in 2018) either do not have or do not plan to implement them in the next 6 months. Of those who had at least one of the care models or planned to implement, ERAS topped the list at 19%, followed by a joint venture with physicians and a management company or with physicians and hospitals (13% each).
In an open-ended question, we asked how the migration of traditionally inpatient procedures (for example, total joints, spine, and cardiac procedures) from the hospital to ambulatory care settings was affecting ASC leaders and their organizations. Of the 51 who responded, 21 reported no or minimal effects. A few are planning to implement these procedures, and others are already adding them to their services. Sample comments include:
- “This is a great migration. The biggest struggle is changing the mindset of employees who aren’t familiar with such a model and are, understandably, nervous about the change. We have already created a total joint program from the ground up, which staff found very exciting. We are currently working on pricing out vascular services for our center.”
- “Provides opportunities for growth, but is difficult to grasp as a small, freestanding ASC with the nearesthospital 45 minutes away.”
- “We are embracing it with open arms, ready to train, employ, and bring on employees trained for such procedures.”
- “Has increased, but reimbursement is so low, may stop doing these procedures.”
Four ASC leaders mentioned that COVID-19 has affected plans for initiating these procedures.
Most ASC leaders have yet to see the impact of artificial intelligence (AI). When asked about the effect of AI on surgery in general and on their own organizations, half of the 51 respondents said it hadn’t played a role, and four others said the effect was unknown. A few commented on AI’s potential:
- “I believe it will help meet a younger population here in Hawaii to reach the remote patients on outer islands who wouldn’t otherwise have access to the available care on other islands.”
- “There is a place for AI in complex surgery. It could be used in an ASC but is much too expensive right now.”
- "Will impact the way we provide service.”
Only one ASC leader reported currently using AI, but did not specify how.

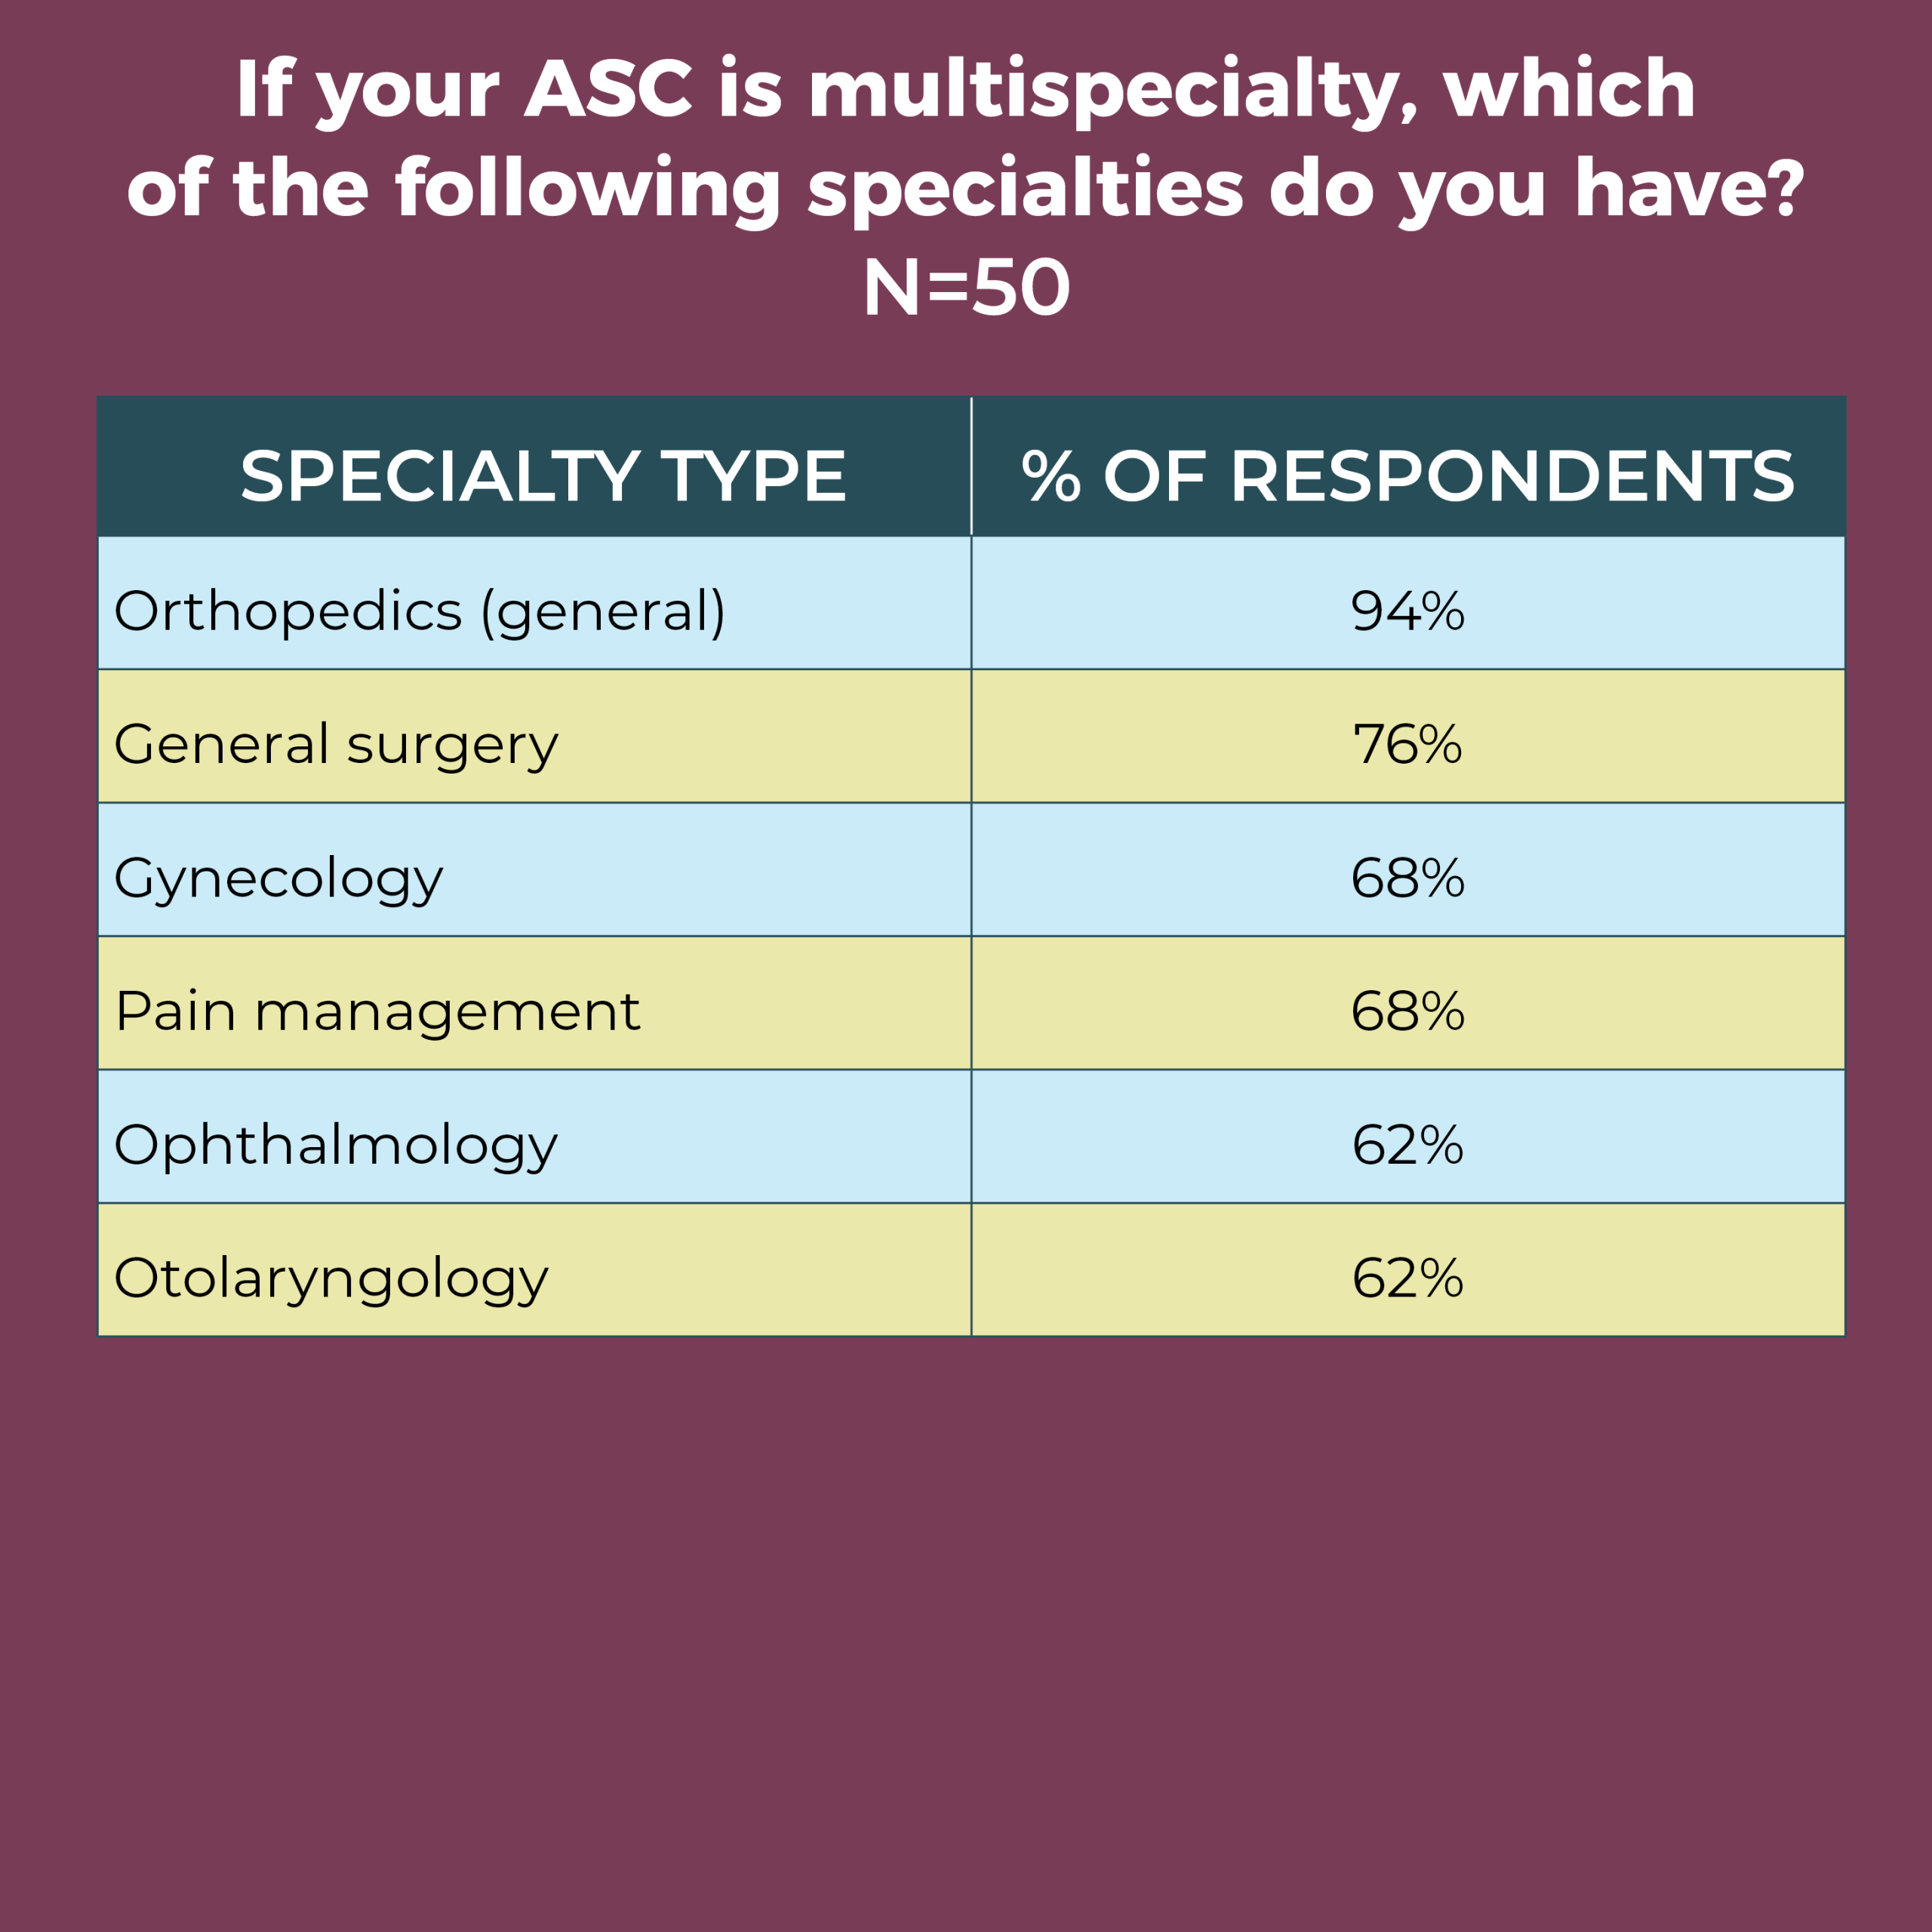
In all, 41% of respondents work in a physician-owned ASC, and 28% in a hospital-owned facility. A total of 72% work in a multispecialty ASC, with the remaining based in a single-specialty facility.
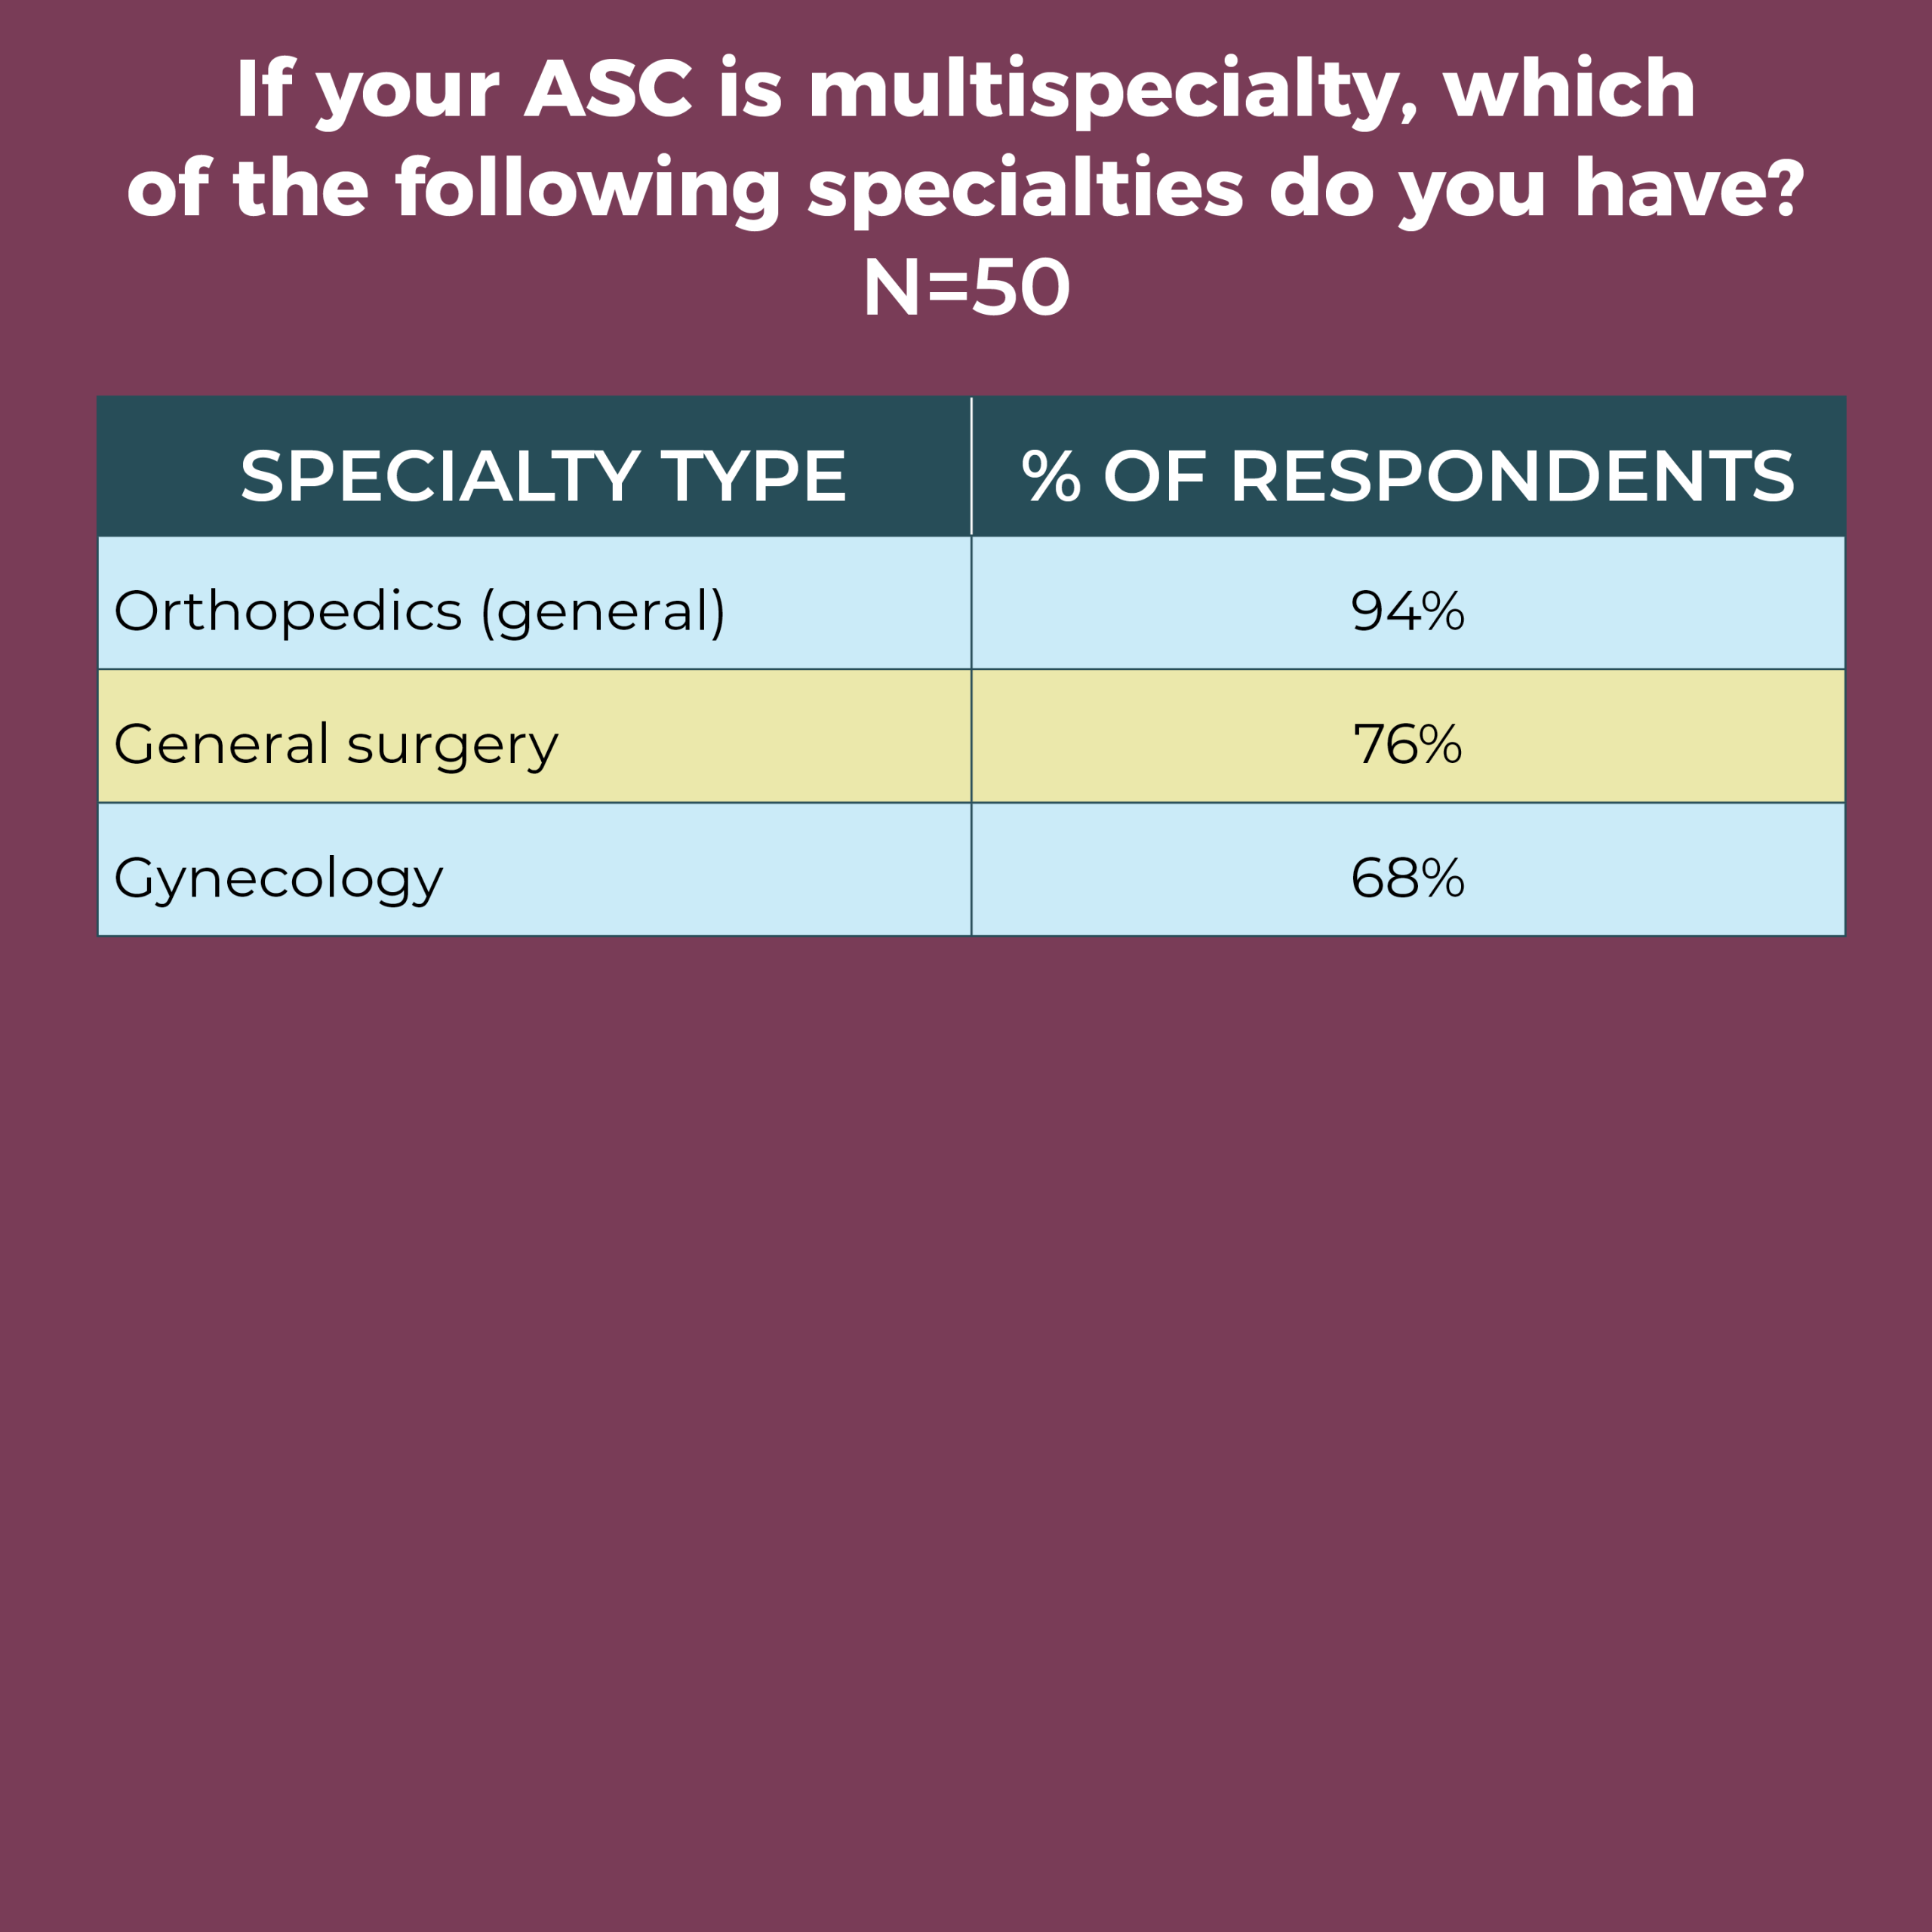
The most common single specialty was orthopedics (32%), followed by ophthalmology (21%) and gastroenterology (16%). Orthopedics was also the most common specialty among multispecialty ASCs (94%), followed by general surgery (76%), gynecology (68%), and ophthalmology and otolaryngology (both 62%). Nearly half of respondents (46%) added a specialty not on the list of options, with podiatry the most common.
The number of specialties remained the same for 61% of ASC leaders, although more than one-quarter (26%) reported an increase.

The effects of the pandemic have left ASC leaders with unprecedented challenges to face. Working with staff to regain volume and achieve financial stability will be a prime goal. It remains to be seen what long-term changes COVID-19 will have on ASC leaders and their teams.
Cynthia Saver, MS, RN, is president of CLS Development, Inc, Columbia, Maryland, which provides editorial services to healthcare publications.

Data for the OR Manager Salary/Career Survey were collected from April 14 to June 5, 2020. The survey list comprised nurse managers of ASCs who were either OR Manager subscribers or part of an external list. The survey was closed with 69 usable responses. The margin of error is ±5 percentage points at the 95% confidence level.

OR Manager thanks those who generously took time to complete this year’s survey. We appreciate your help in gathering this information, which will be useful to your colleagues around the country.

In all, 51 respondents answered the question about how COVID-19 has affected their facilities and staffs, with all of them mentioning lost volume and/or staff effects such as furloughs, reduced overtime, and layoffs. Several reported closures that have ended; one ASC closed for 2 months, and four others were still closed at the time of the survey. Some ASC leaders reported that the facilities are reopening, but at lower volumes.
Sample comments include:
- “Furloughed staff for 7 weeks, had to change/add policies, lowered number of patients in facility, slowed process of patient flow."
- “We have drastically decreased our volume. Currently, the facility is only open half of the day 4 days per week and closed 1 day per week due to no cases.”
- “Only performing urgent/nonelective procedures. Running at about 20% volume. 50% of staff furloughed. Will likely change our plans for adding services and implementing an EMR [electronic medical record] ($$$).”
Perhaps this comment best reflects the reported issues: “We have lost a staggering amount of income and volume resulting in the furloughing of over 80% of staff.”
Survey: COVID-19 is a worry, but compensation remains stable


The COVID-19 pandemic is top of mind for ambulatory surgery center (ASC) leaders, finds the OR Manager 2020 Salary/Career Survey. Most of the 69 ASC leaders who completed the survey responded to an open-ended question about how the pandemic had affected their facility and staff, with the most frequent comments related to closures, reduced volumes, and furloughed staff. COVID-19 also popped up in several responses to an open-ended question about what keeps leaders up at night.
Overall, however, the survey results paint a stable picture when it comes to factors such as salary, compensation, and satisfaction, other than an uptick in total compensation: 53% earn $120,000 or more in annual total compensation, an increase from 42% in 2019. Annual salary amounts also rose, but to a lesser degree: 59% reported earning $100,000 per year or more, compared to 52% last year and 54% in 2015. Most ASC leaders remain satisfied with their jobs (76% vs 74% in 2029), although this is still lower than the 83% reported in 2017.
Additional survey highlights include:
- More than half (55%) of ASC leaders plan to retire in 2029 or later, but a hefty 28% plan to leave between 2020 and 2024, creating a potential leadership vacuum.
- The average raise was 3%, comparable to last year’s 3.19% and higher than the 2.3% increase in the consumer price index for 2019.
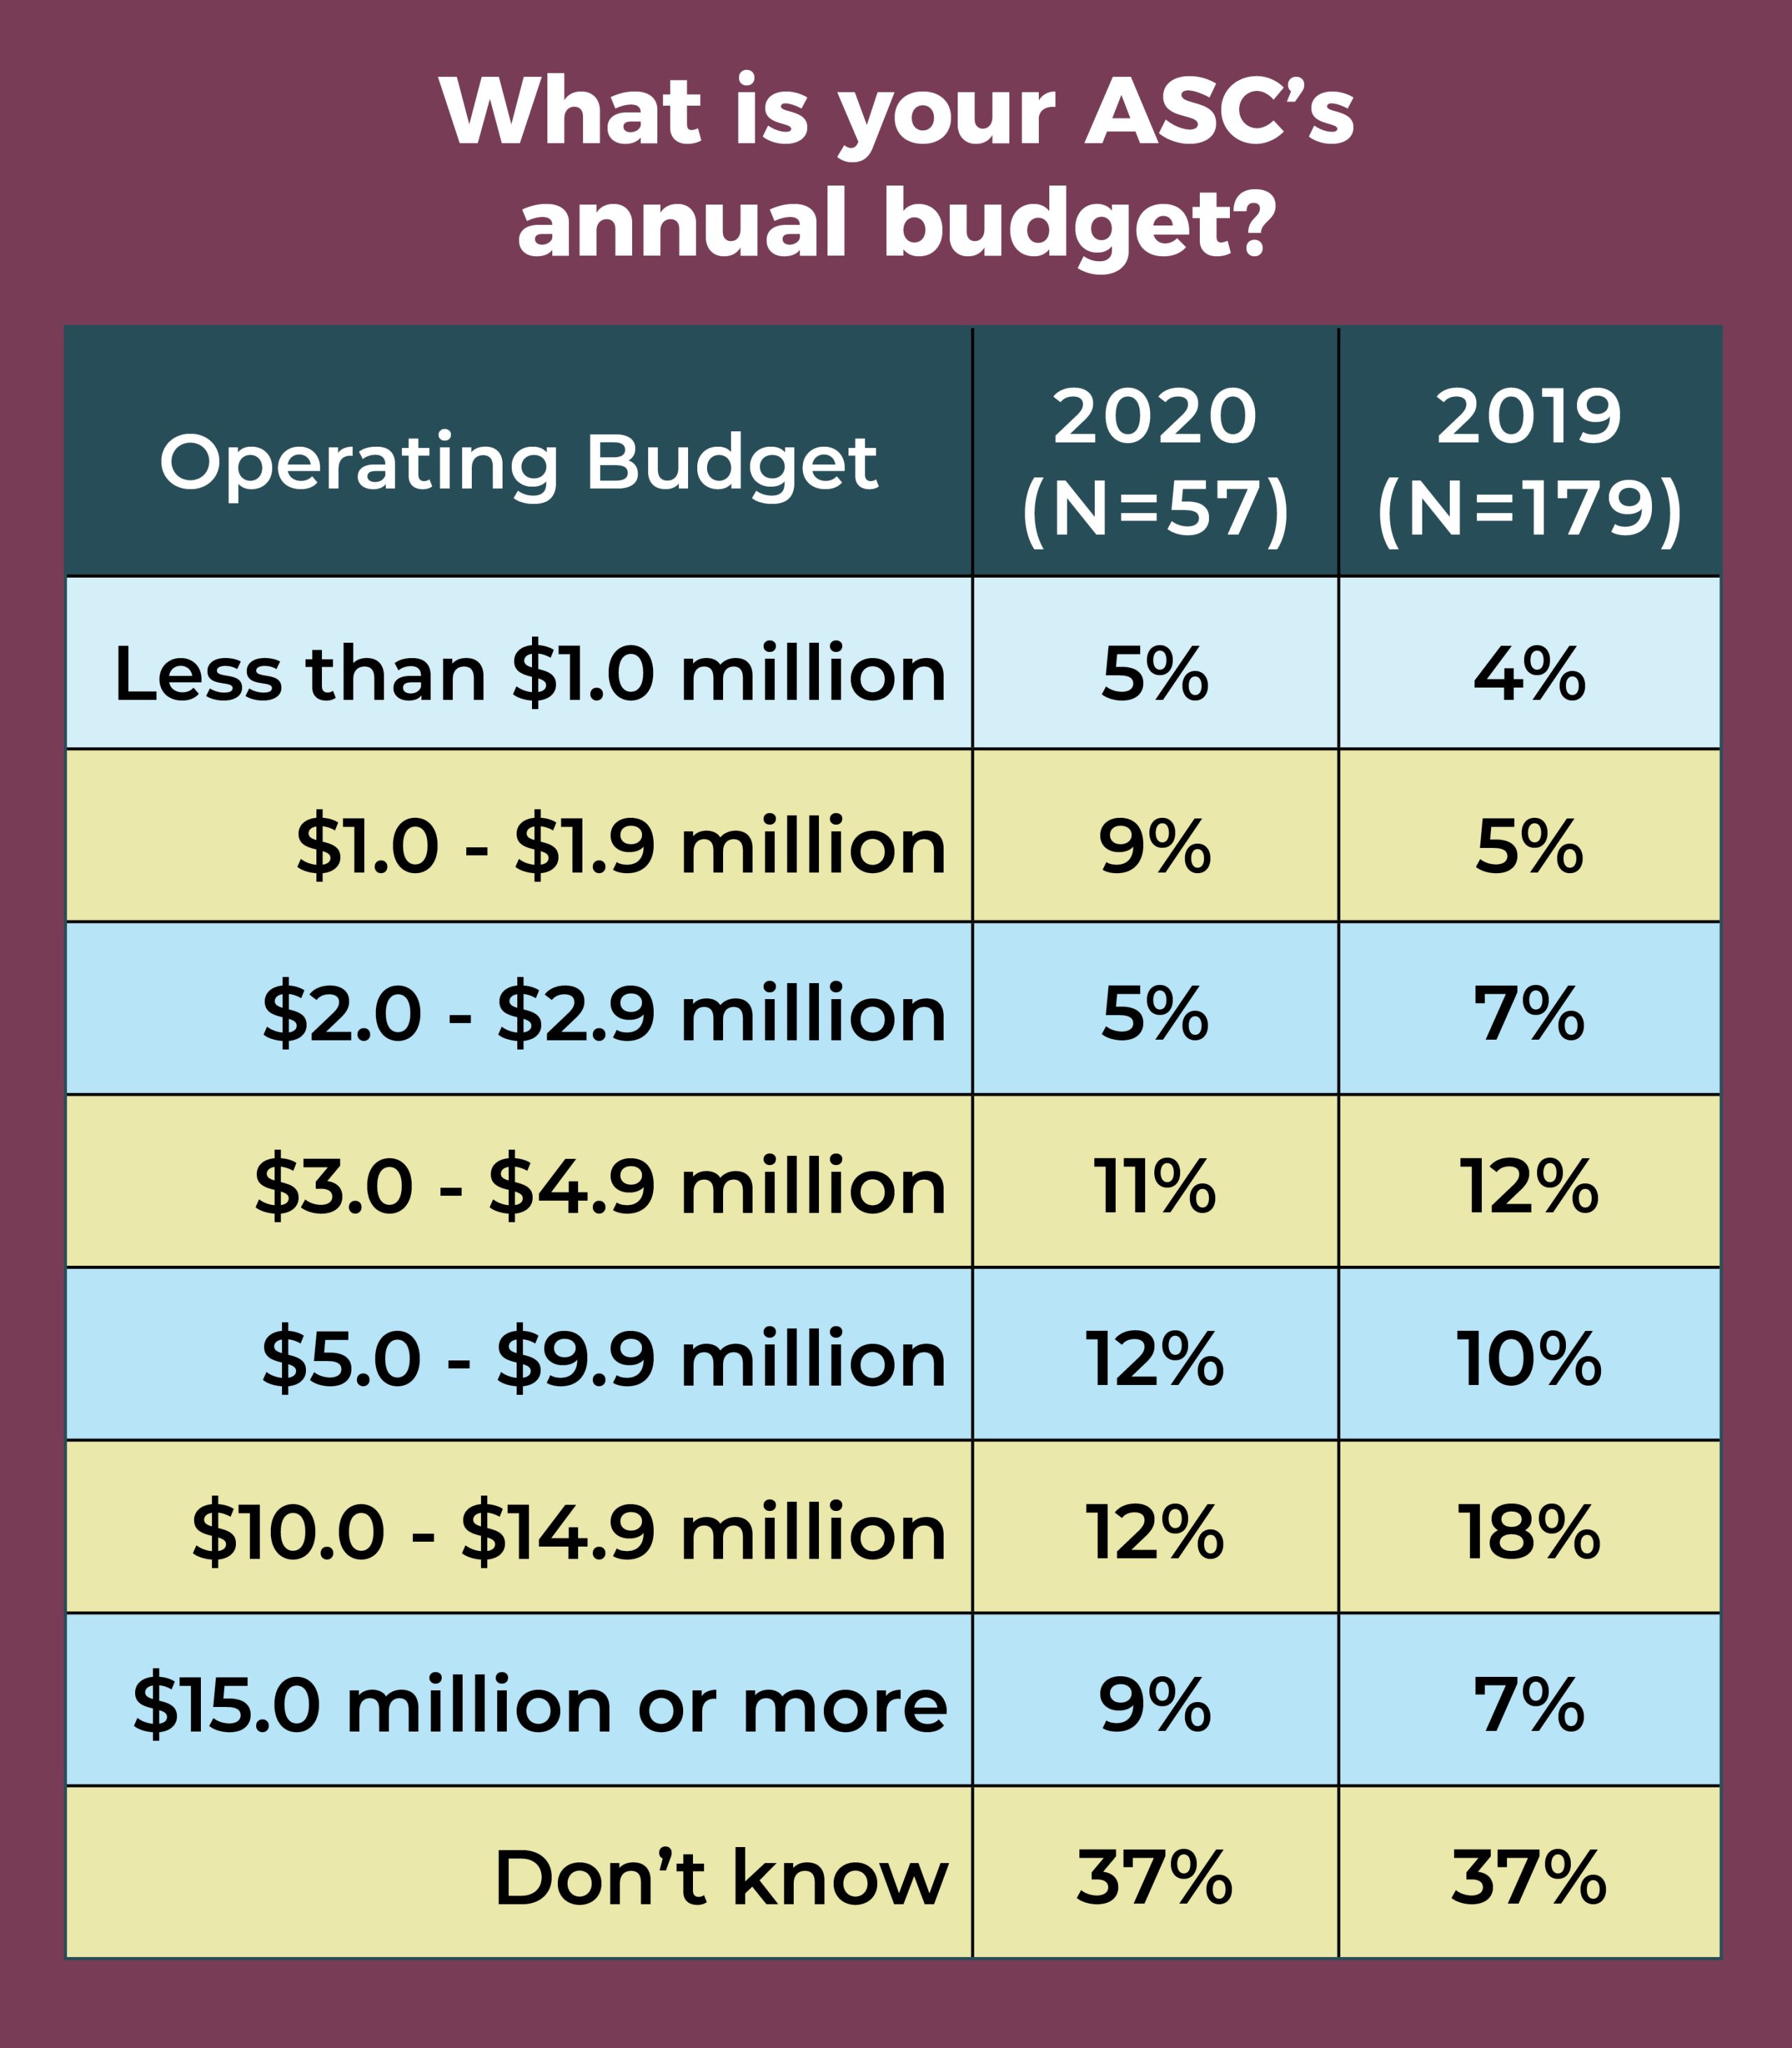
- A significant percentage of respondents do not know their ASC’s annual operating budget (37%, the same as in 2019).
Here are some additional findings.

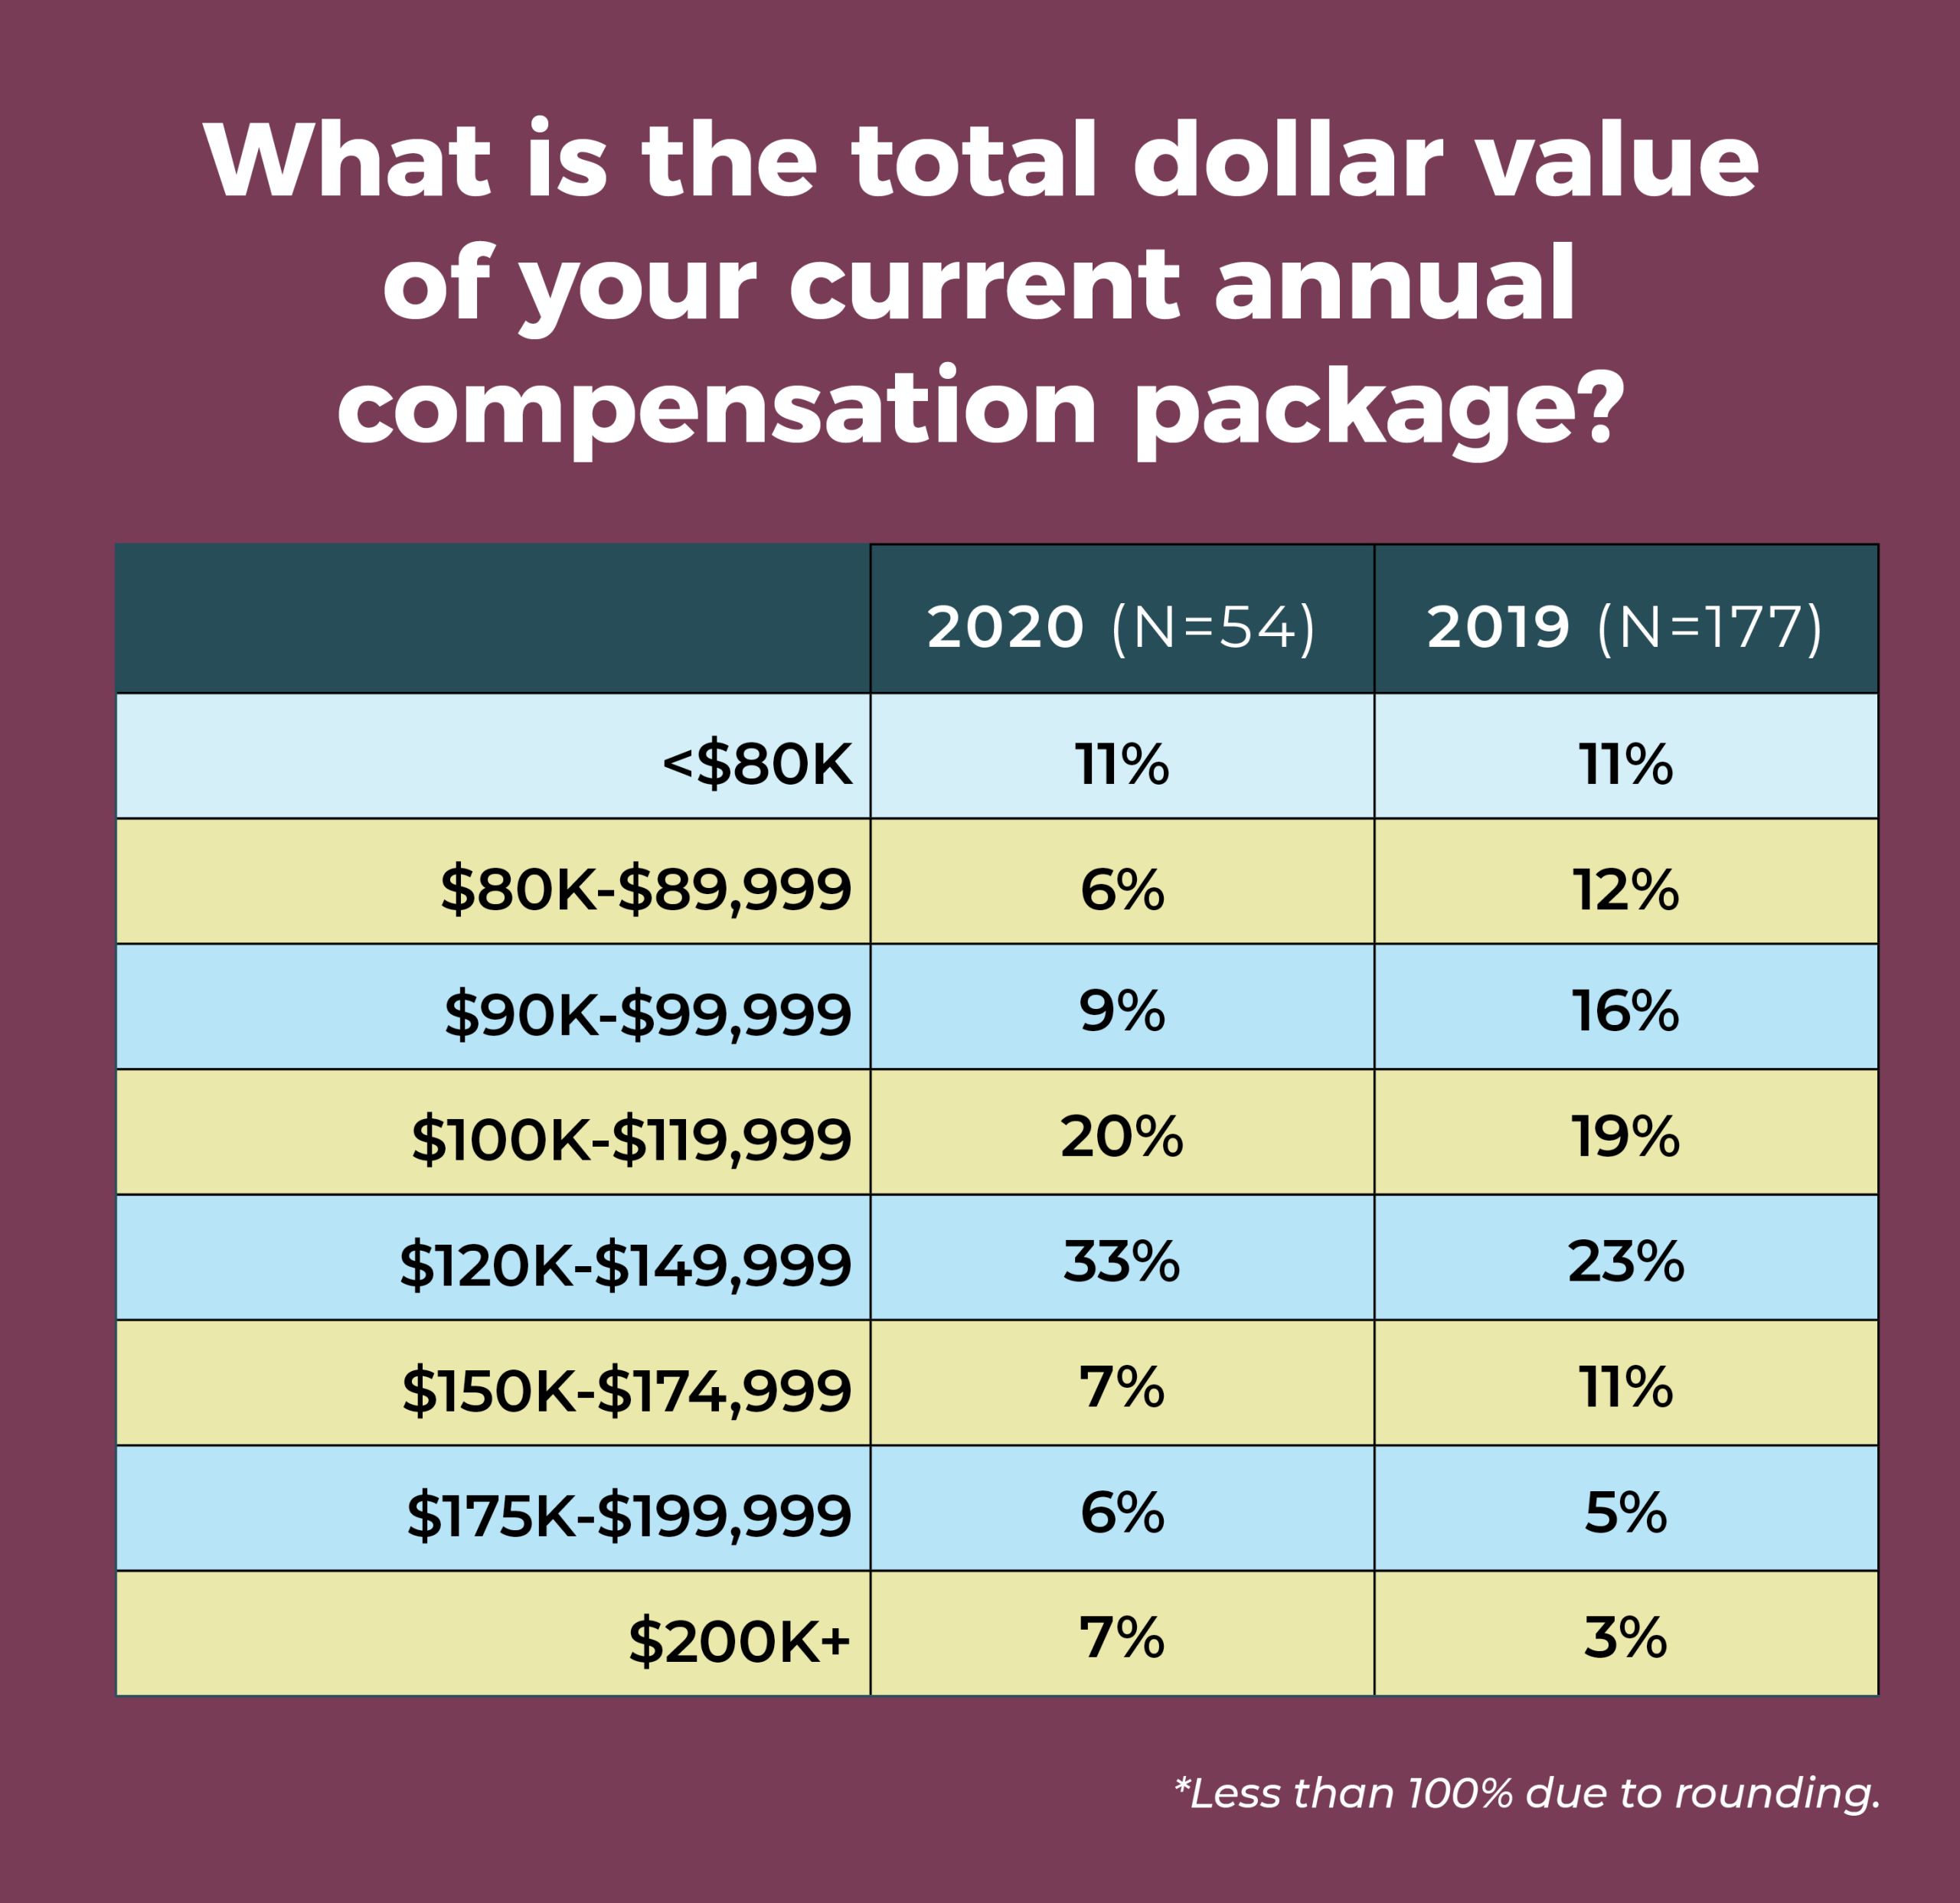

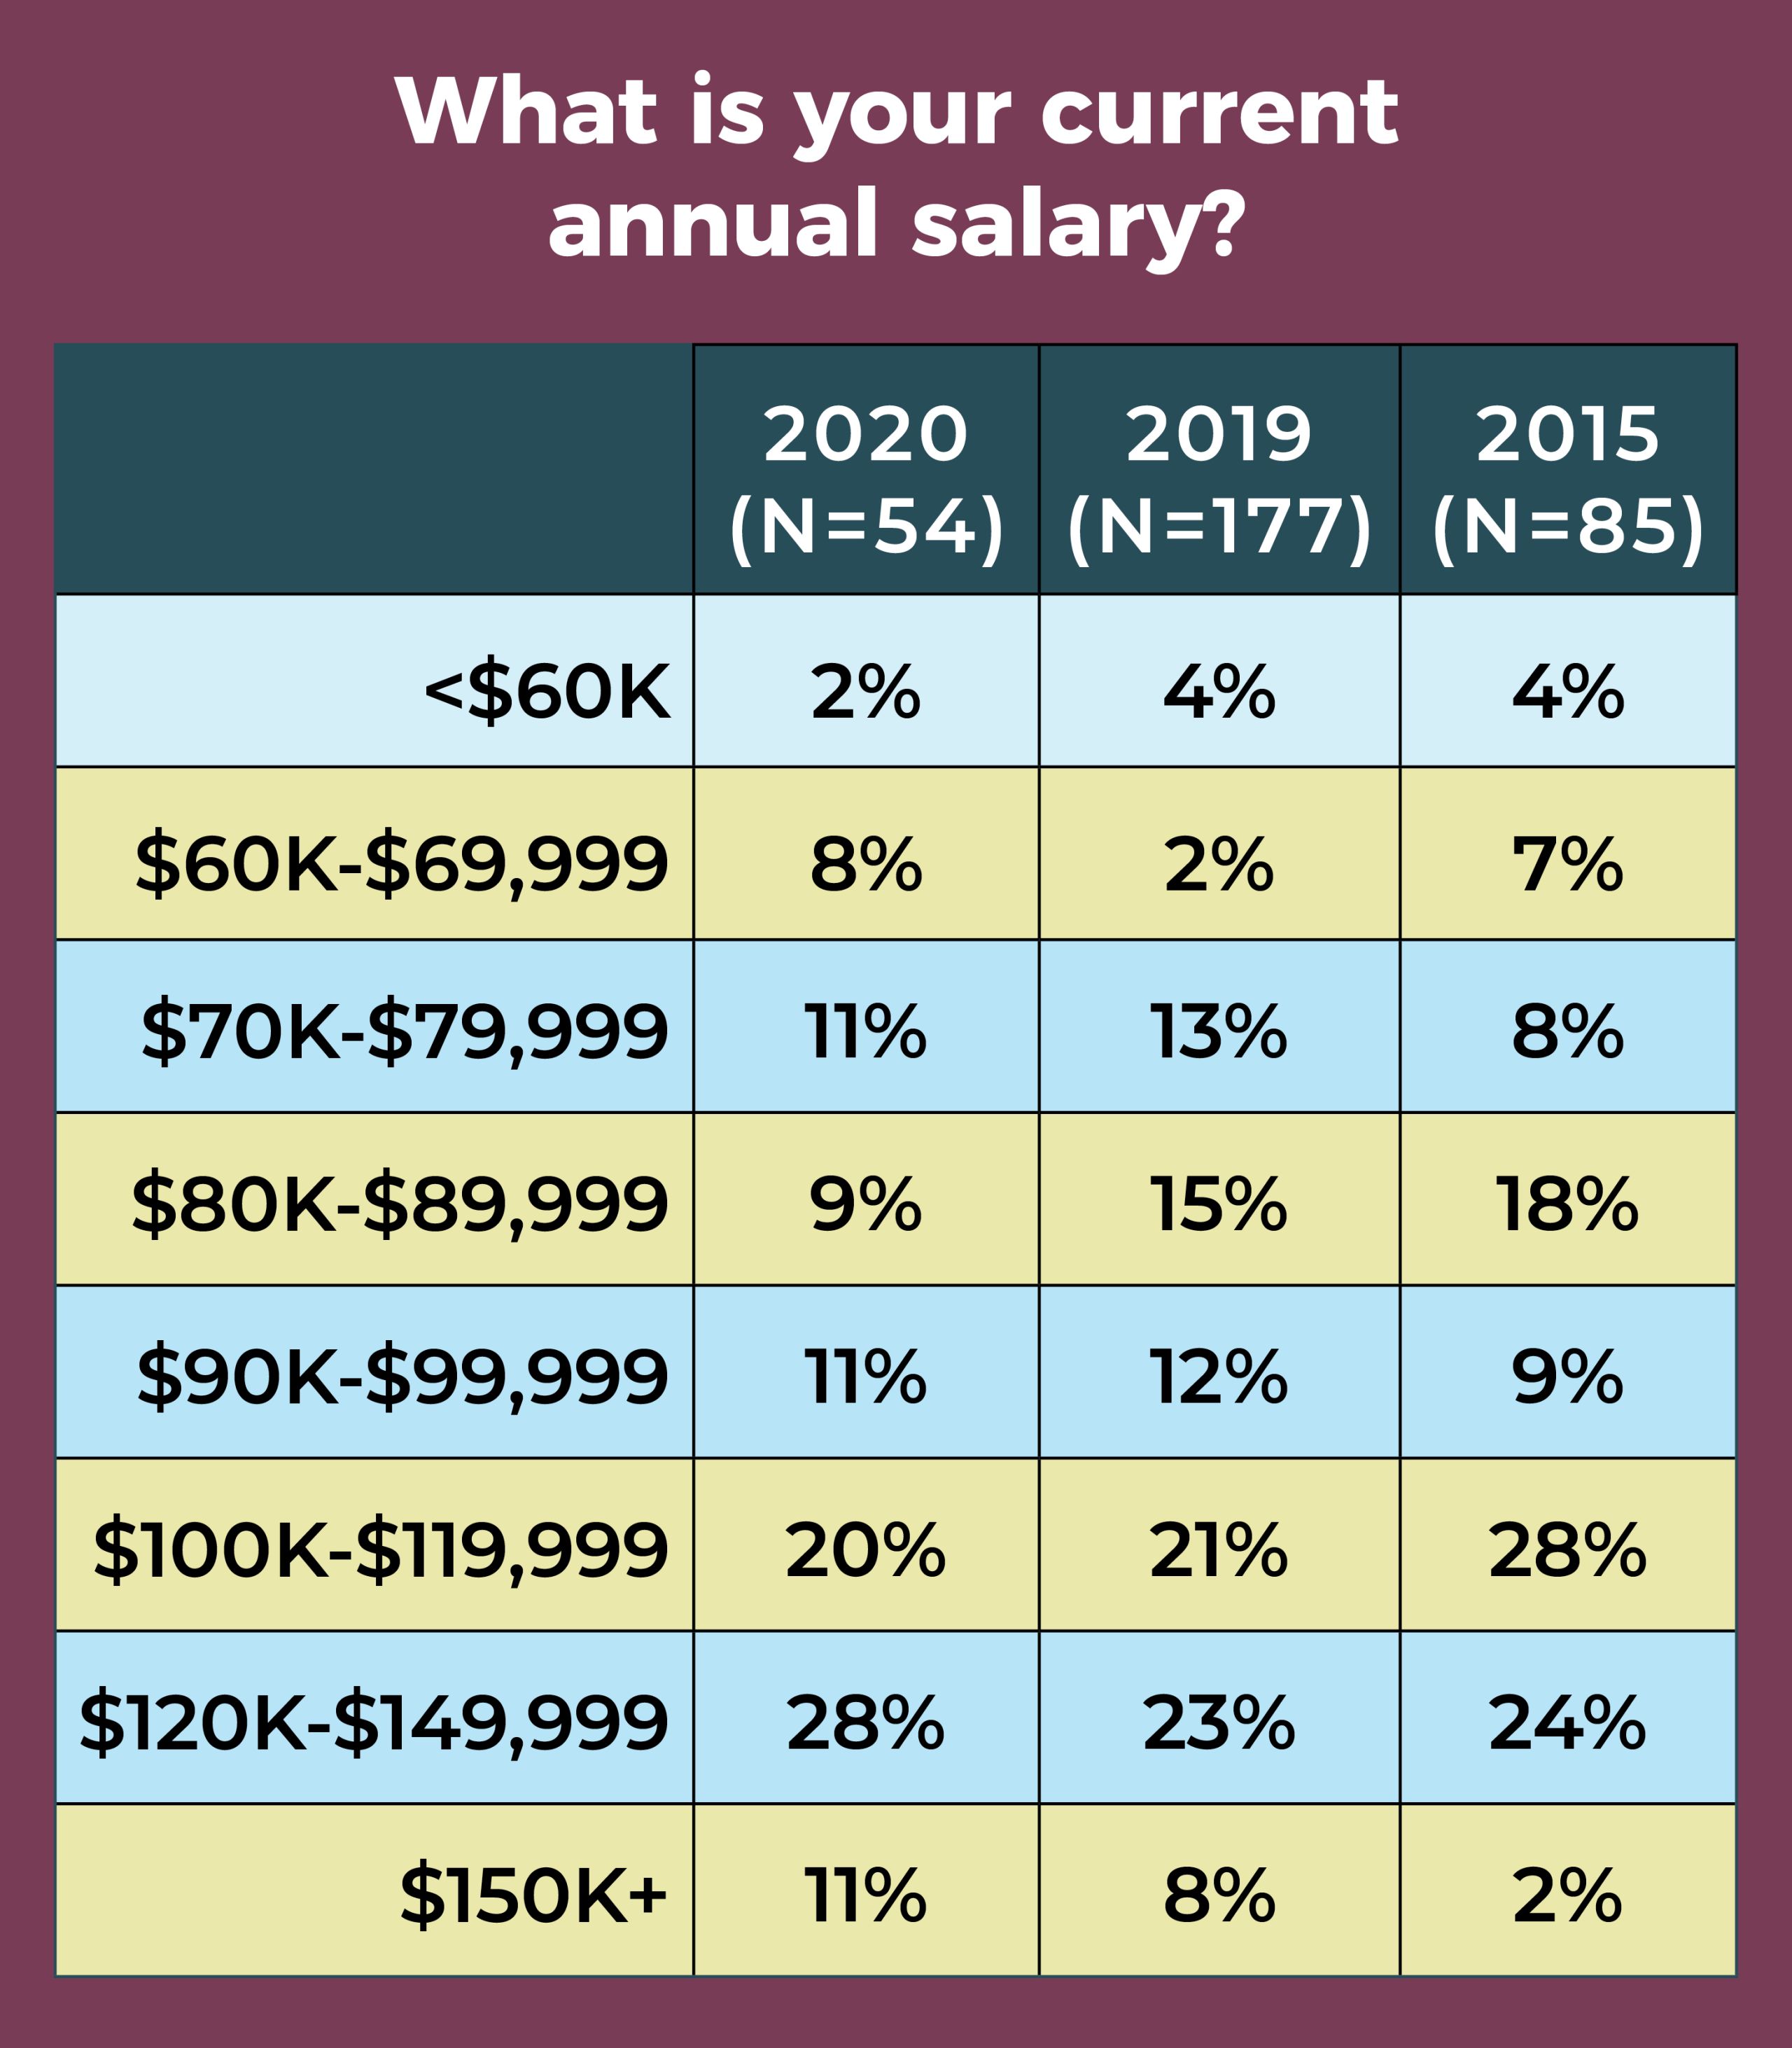
A total of 28% of respondents this year (vs 23% in 2019) reported an annual salary range of $120,000 to $149,999. Only 11% earn $150,000 or more, and only 2% earn less than $60,000.
One-third of respondents reported a total compensation in the range of $120,000 to $149,999, compared to 23% in 2019. The next most common range was $100,000 to $119,999 (20%). Only 7% earn $200,000 or more in total compensation, and 11% earn less than $80,000.

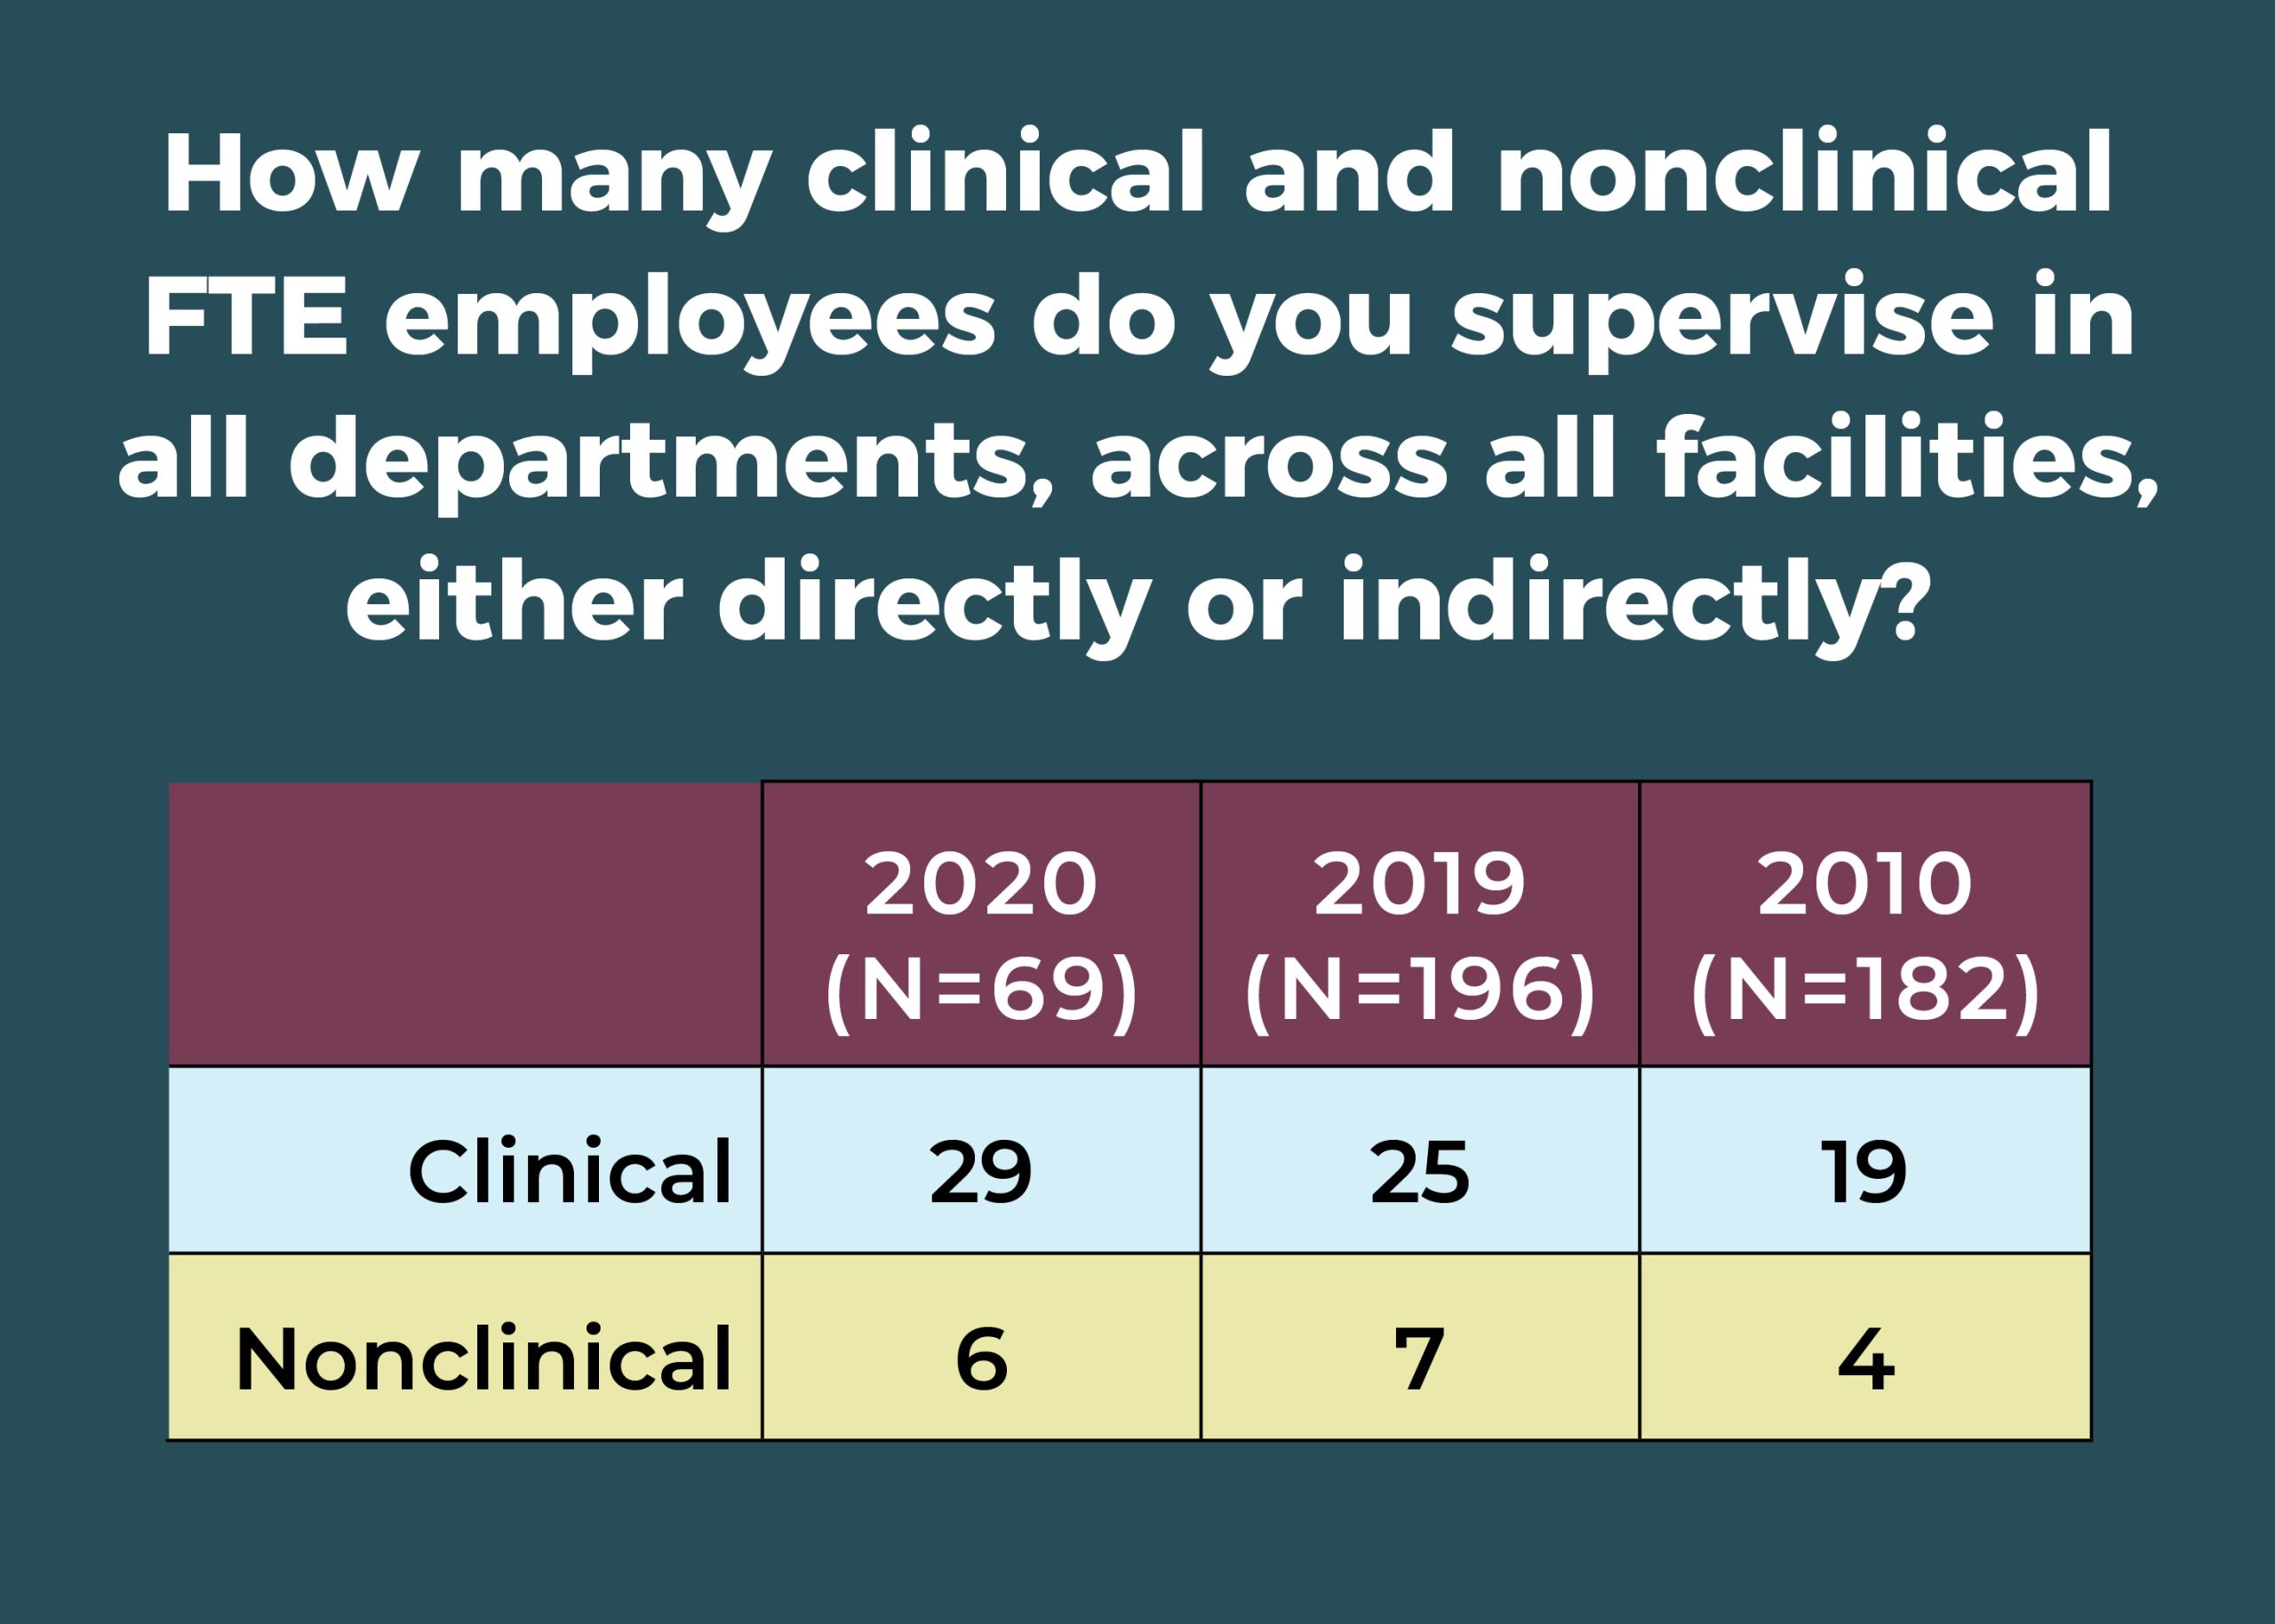
ASC leaders supervise an average of 35 full-time equivalent (FTE) employees, compared to 32 in 2019, 39 in 2015, and 24 in 2010. The breakdown is 29 clinical employees and 6 nonclinical employees.
Nearly one-quarter (24%) of ASC leaders manage a budget between $1.0 million and $2.9 million, and 11% are responsible for a budget in the range of $3.0 million to $4.9 million.
The vast majority of respondents (81%) oversee one to five ORs (vs 77% in 2019). As in 2019, the most common response was two ORs (29% in 2020 vs 24% last year), and 6% reported managing 10 or more, compared to 7% in 2019.

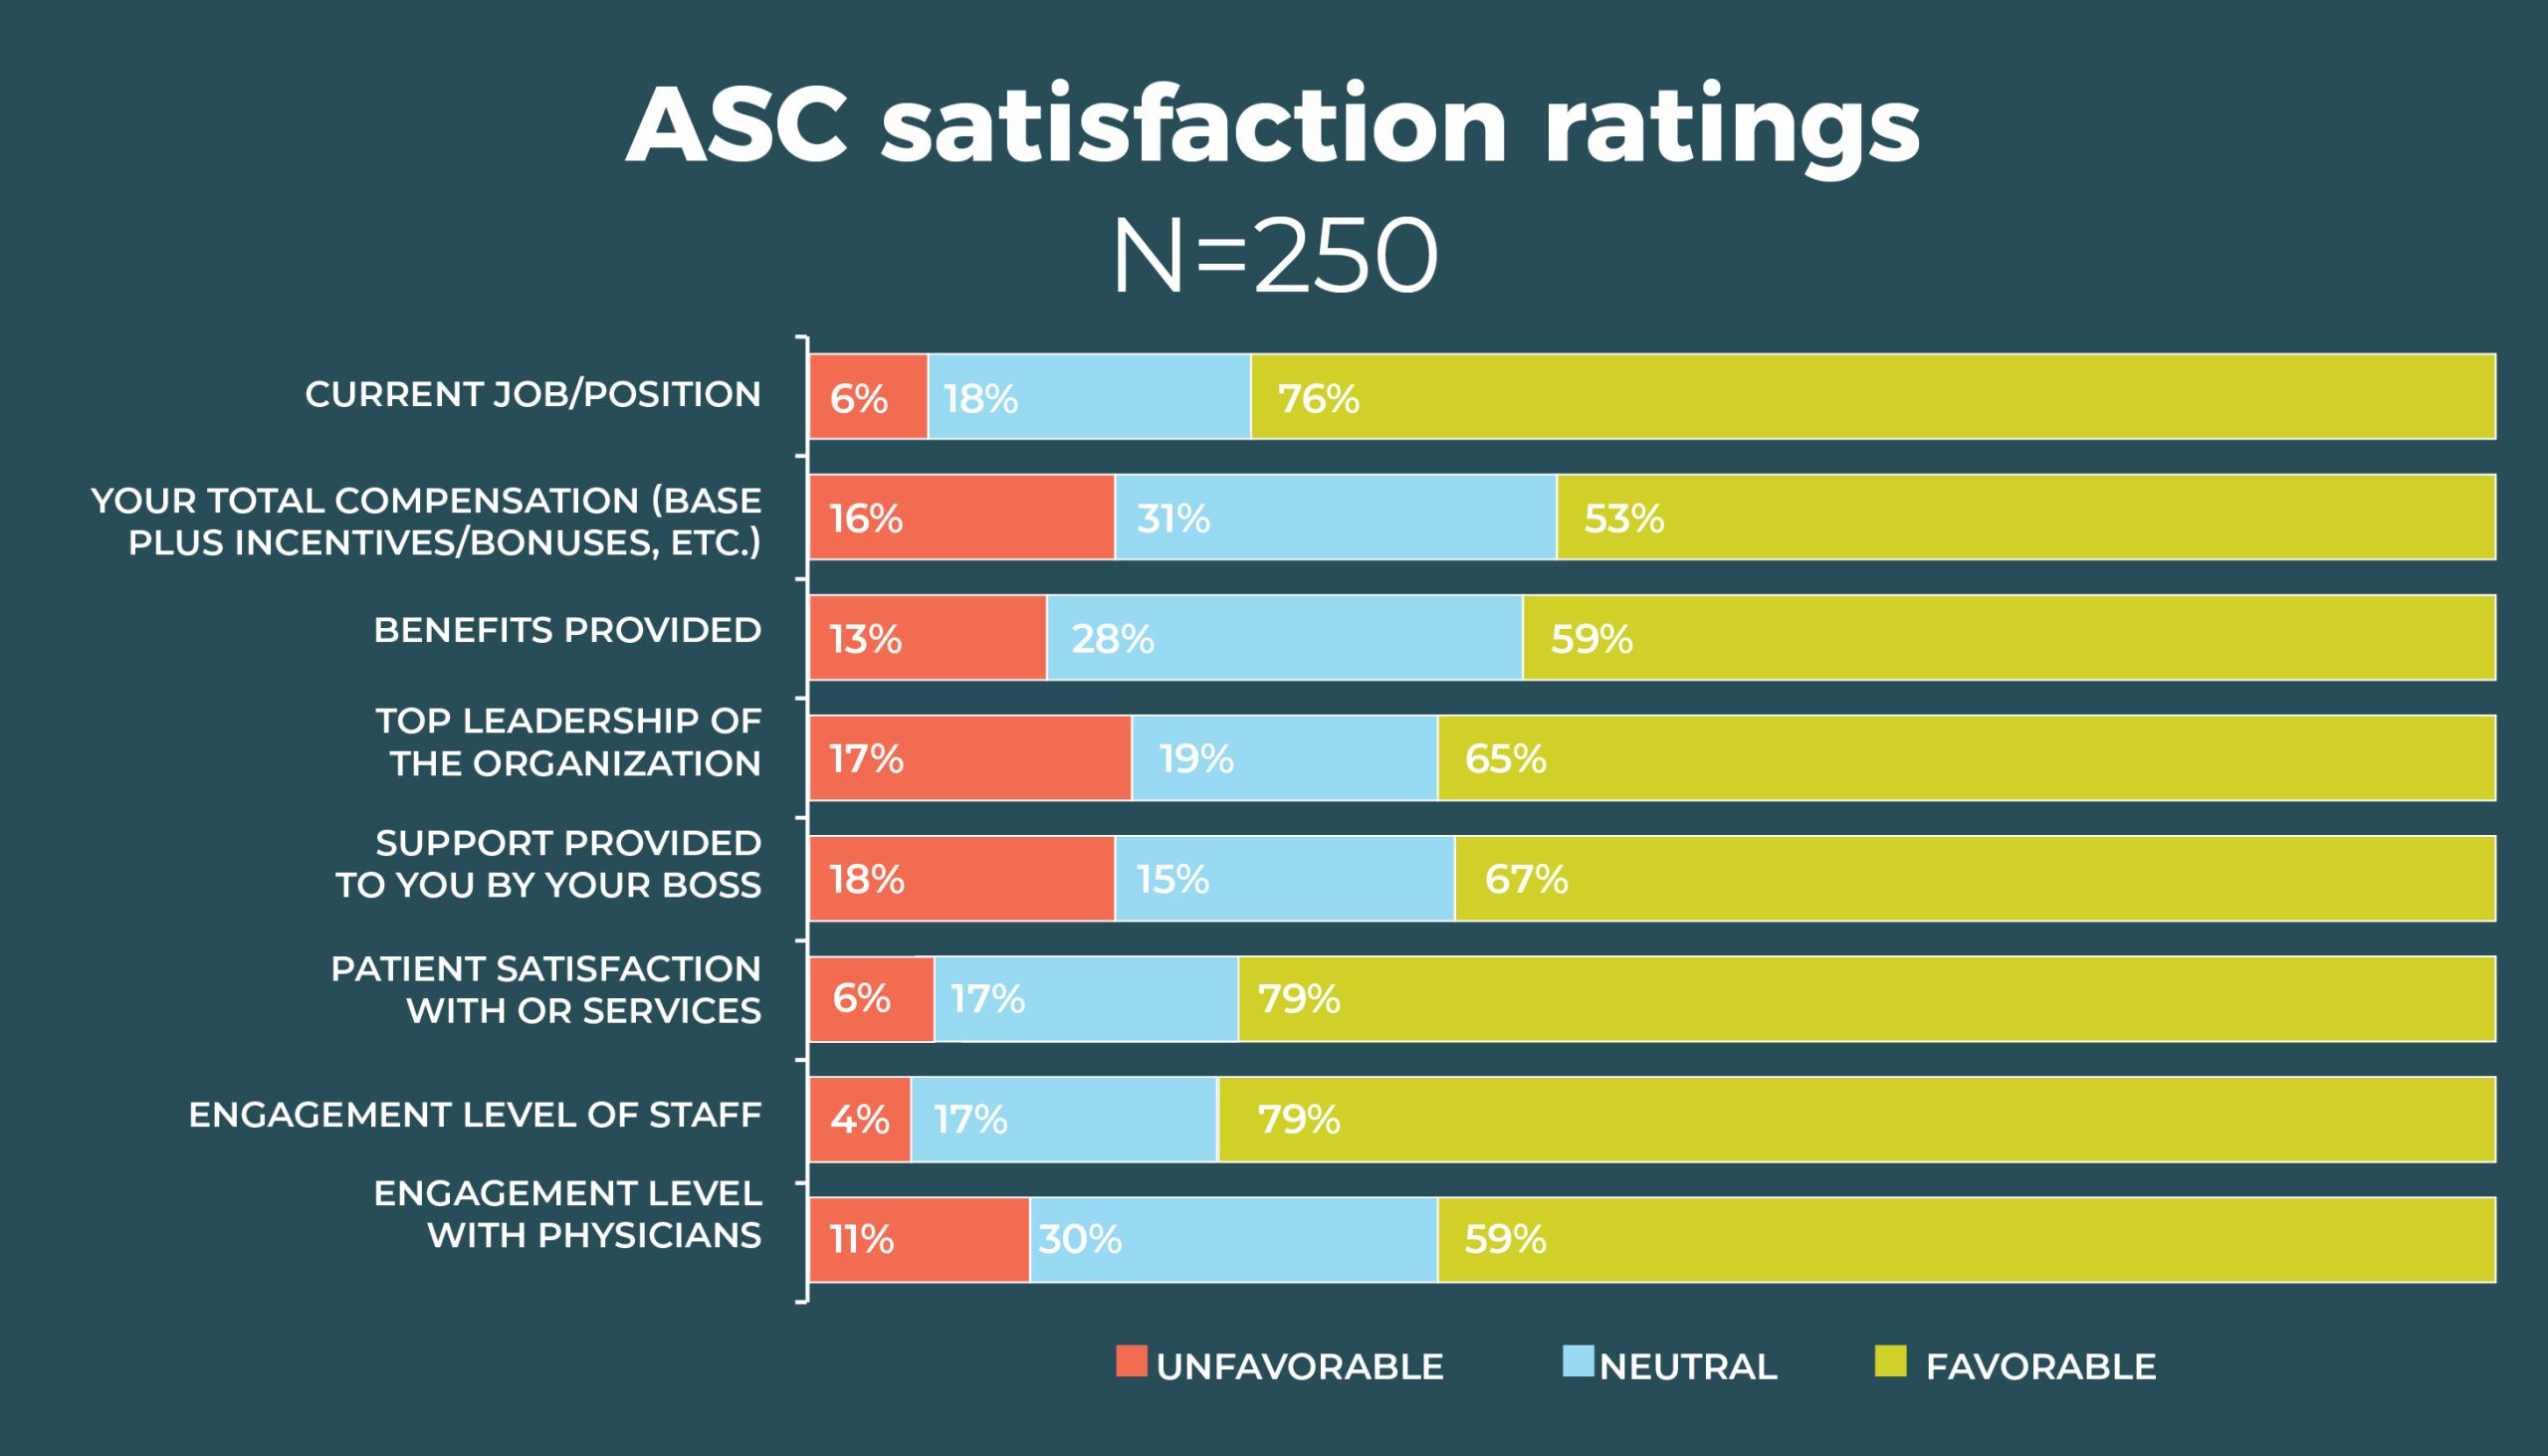

ASC leaders rank patient satisfaction with OR services the highest among satisfaction measures (94%, comparable to the 92% from 2019).
The next highest was staff engagement, which at 79% was a bit higher than the 72% figure from 2019.
Slight upticks in satisfaction were seen with benefits (59% vs 58% in 2019), top leadership in the organization (65% vs 63%), and support provided by your own boss (67% vs 62%). Only two areas showed a slight decline in satisfaction since 2019: total compensation (53% vs 56%) and physician engagement (59% vs 63%).
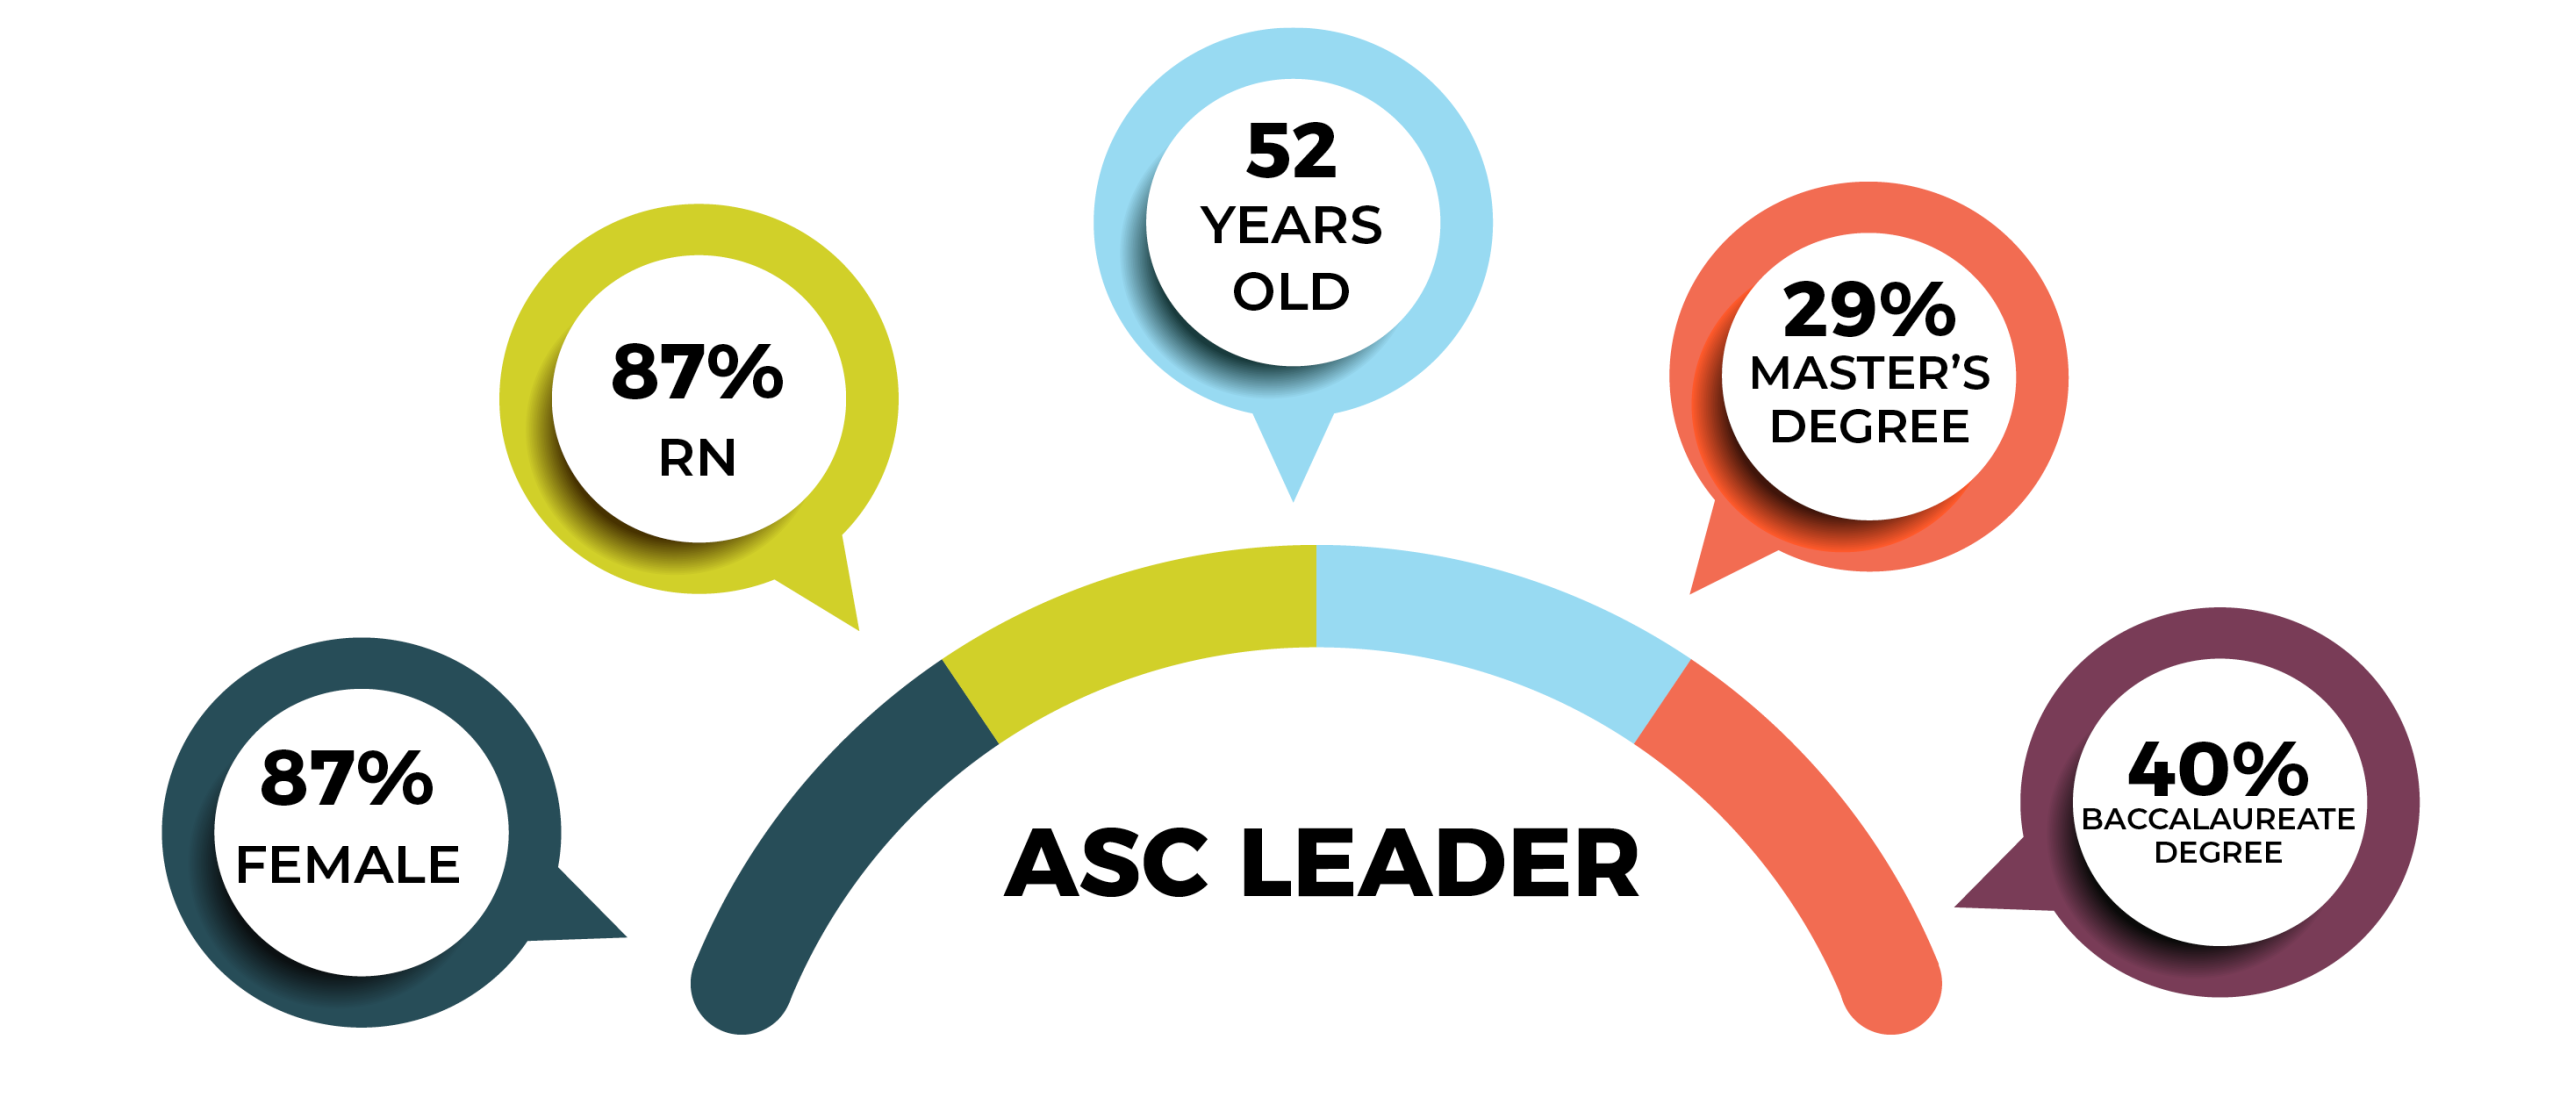

Overall demographics are listed in the infographic (p 28). The average age of the respondents was 52 years, a year younger than the 53 years for nurses reported in the 2017 National Nursing Workforce Survey.
A total of 36% of ASC leaders hold a baccalaureate degree in nursing as their highest level of education, down from 42% in 2019 and 48% in 2010; 29% hold a master’s degree, comparable to last year’s 30%. (Just 14% held a master’s degree in 2010.) No respondent had a doctorate degree. The most common titles were administrator/administrative director (38%), followed by director (33%), and nurse manager (20%).
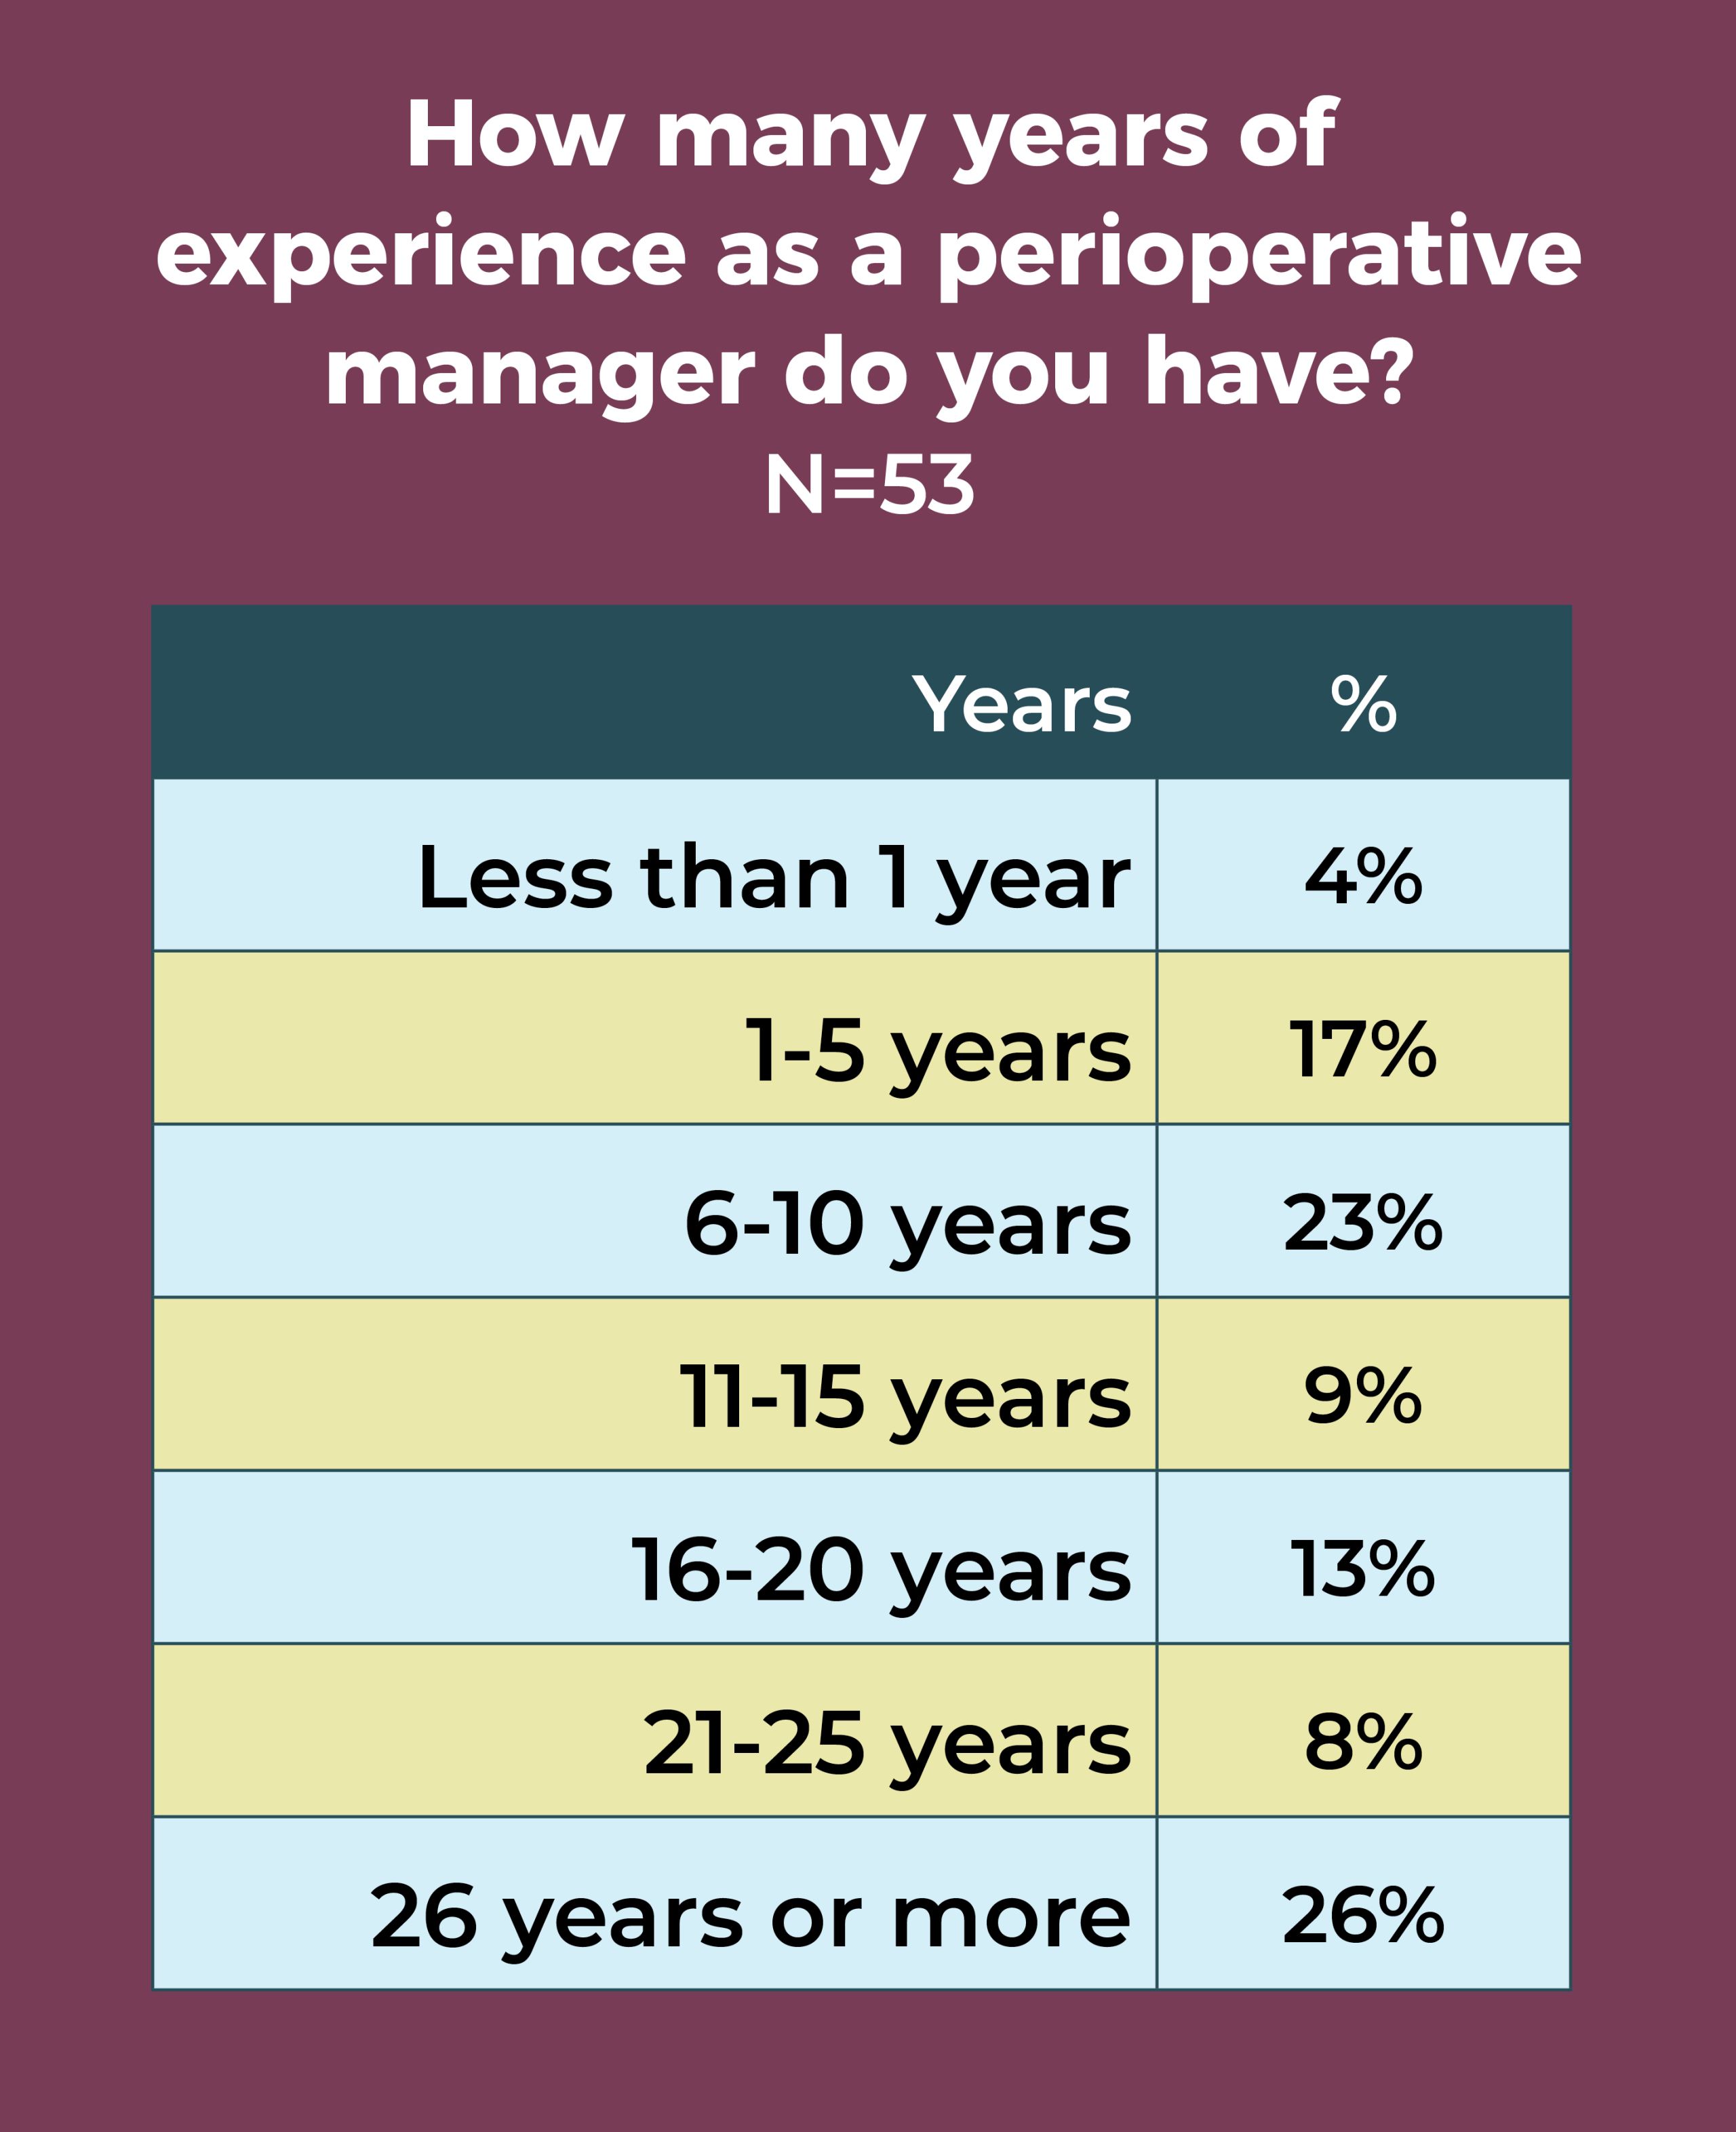
Just 20% of respondents say they have 5 years or less experience, whereas 26% have 26 years or more of experience, and 56% have more than 10 years under their belts. These numbers suggest a need for succession planning.
Not surprisingly, ASC leaders work hard, with 36% spending 41 to 45 hours a week on the job; 30% spend 46 to 50 hours. Nearly one-quarter (24%) work more than 50 hours a week, and only 10% work fewer than 40 hours.
A total of 43% of respondents reside in the South, 23% live in the Midwest, 19% in the West, and 15% in the Northeast.


In all, 51 respondents shared the one thing about their job that keeps them up at night. Thirteen cited staffing as their top concern, with comments such as:
- “Staff personalities and conflicts.”
- “Lack of perioperative nurses to backfill retiring nurses.”
- “Worrying that we will keep the staff we currently have. My plan has always been to retire at the end of 2020, but I think it may be sooner than later.”
The next two most common concerns, each cited by eight participants, were COVID-19 and safety (staff or patient)/regulation. Sample comments include:
- “Currently, with COVID-19, it is ensuring the continued safety of my staff.”
- “Adapting processes for patient safety relating to COVID-19.”
- “Is every clinician prepared to manage a patient emergency in the ASC setting?”

Examples of other concerns include scheduling patients who don’t meet ASC criteria, block time scheduling, lack of support from upper leadership, and physician challenges. A few respondents were more self-reflective, with comments such as:
- “Making sure I have done everything I am supposed to, and if I am doing a good job, what I can do better.”
- “Fear of the unknown; am I missing something?”
- “Deciding how I can be more helpful and coalesce strategies to work together with other ASCs in the area.”

Four respondents reported that work worries didn’t keep them awake.
Uncertainty abounds for ASC leaders as they navigate a healthcare environment changed by the pandemic. Leaders will need to call on their expertise to help staff (and themselves) move forward to ensure patients receive the best possible care.
Cynthia Saver, MS, RN, is president of CLS Development, Inc, Columbia, Maryland, which provides editorial services to healthcare publications.