

OR Manager
2019 Career & Salary Survey


Staffing and surgical volume vie for 'top challenge' facing OR leaders


Staffing headaches for OR managers continue, according to the 2019 annual OR Manager Salary/Career Survey, with more than a third of respondents reporting that the percentage of open positions compared with 12 months ago has increased for both RNs and surgical technologists (STs).
The clock has to be turned back to 2014 to find better news, when the percentages of those reporting an increase was 11% for RNs and 12% for STs. That same year, nearly two-thirds said turnover rate for both RNs and STs had stayed the same. In 2019, only about half of respondents say turnover has been stable, and more than a third say RN turnover has increased.
In addition to staffing challenges, many OR leaders (40%) have to contend with increases in surgical volume, compared with 47% last year, although 42% reported no change in volume, up from 35% last year. However, this question was asked slightly differently this year, so comparisons are tentative.

Other key findings of the survey include:
- Adoption of new models of care remains slow. In all, 31% of respondents (compared with 33% last year) reported that none of the care model options listed in the survey, including Enhanced Recovery After Surgery (ERAS) and the Perioperative Surgical Home (PSH), have been implemented or are planned for implementation in the next 6 months. However, adoption of ERAS jumped from 42% in 2018 to 53% this year.
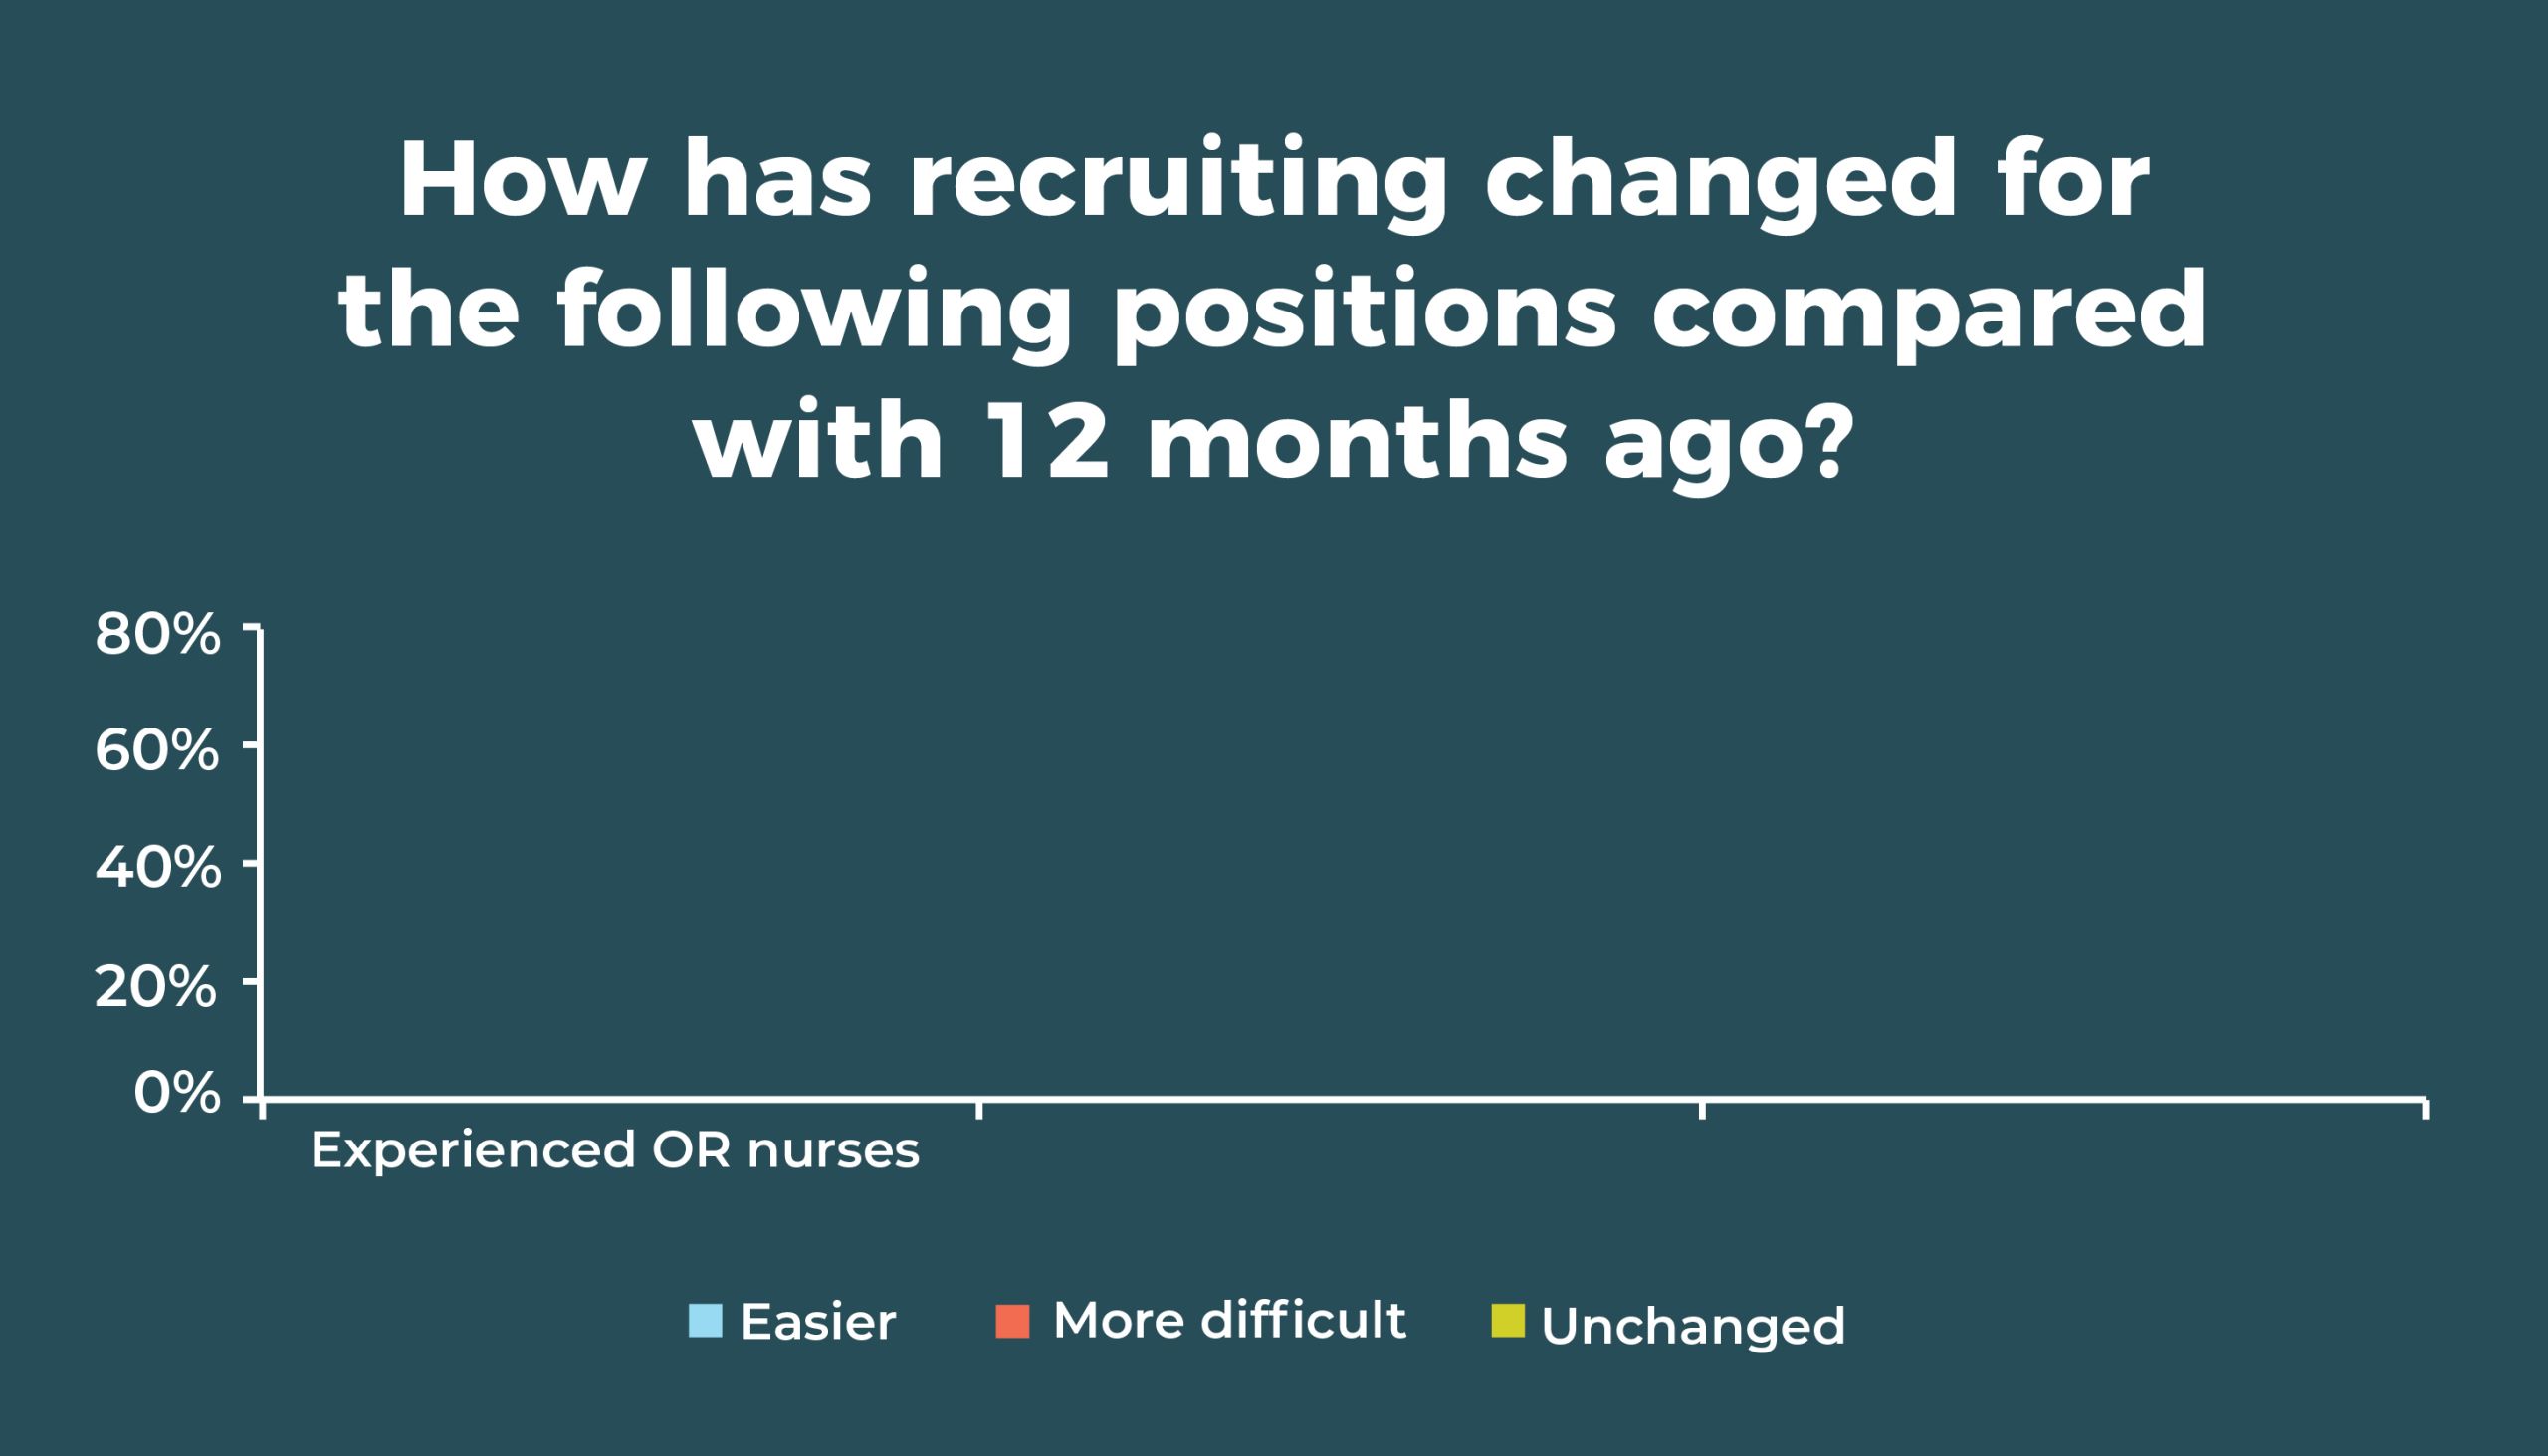
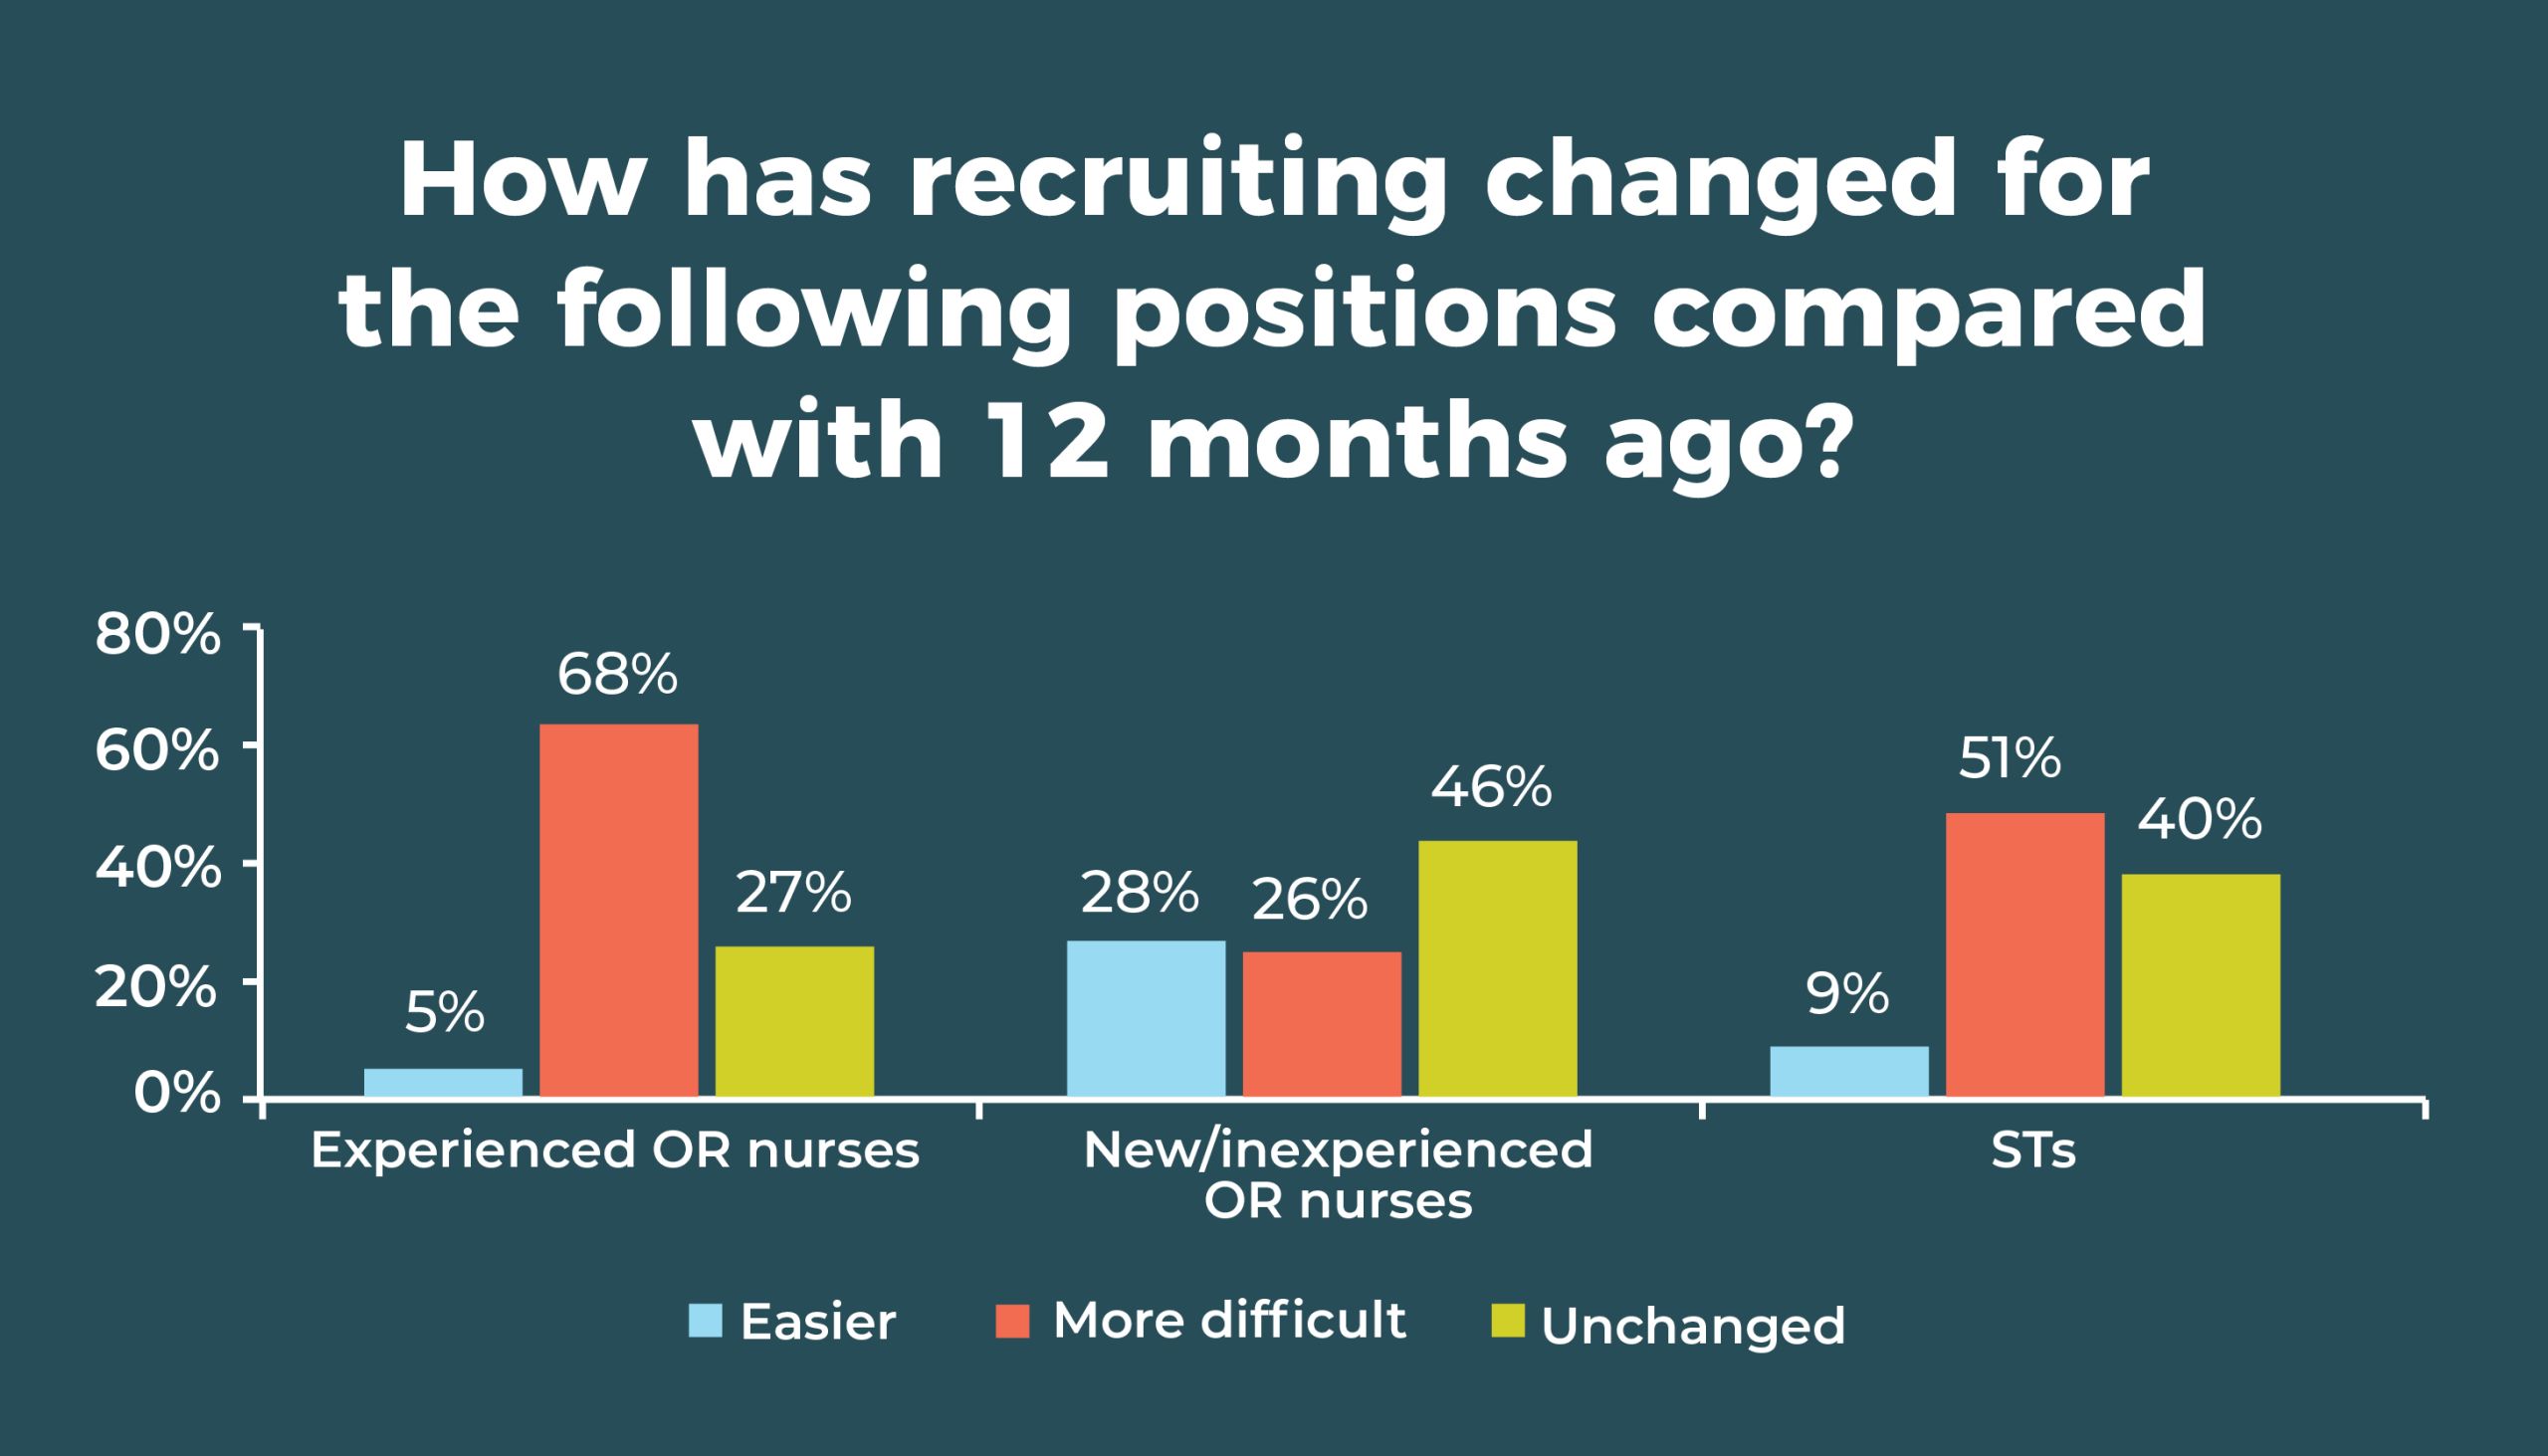
- Data related to staff recruitment indicate just how stubborn staffing challenges have remained. More than two-thirds (67%) of respondents say it’s more difficult to recruit experienced OR nurses (similar to 66% in 2018), and 51% say it’s more difficult to recruit STs (similar to 52% in 2018). Only new and inexperienced OR nurses result in positive double digits, with 28% of respondents saying it is easier to recruit nurses at this level compared with 12 months ago.
- Slightly less than one-fourth (24%) of respondents plan to add ORs within the next 12 months.
- Most respondents (59%) have a preoperative optimization clinic.

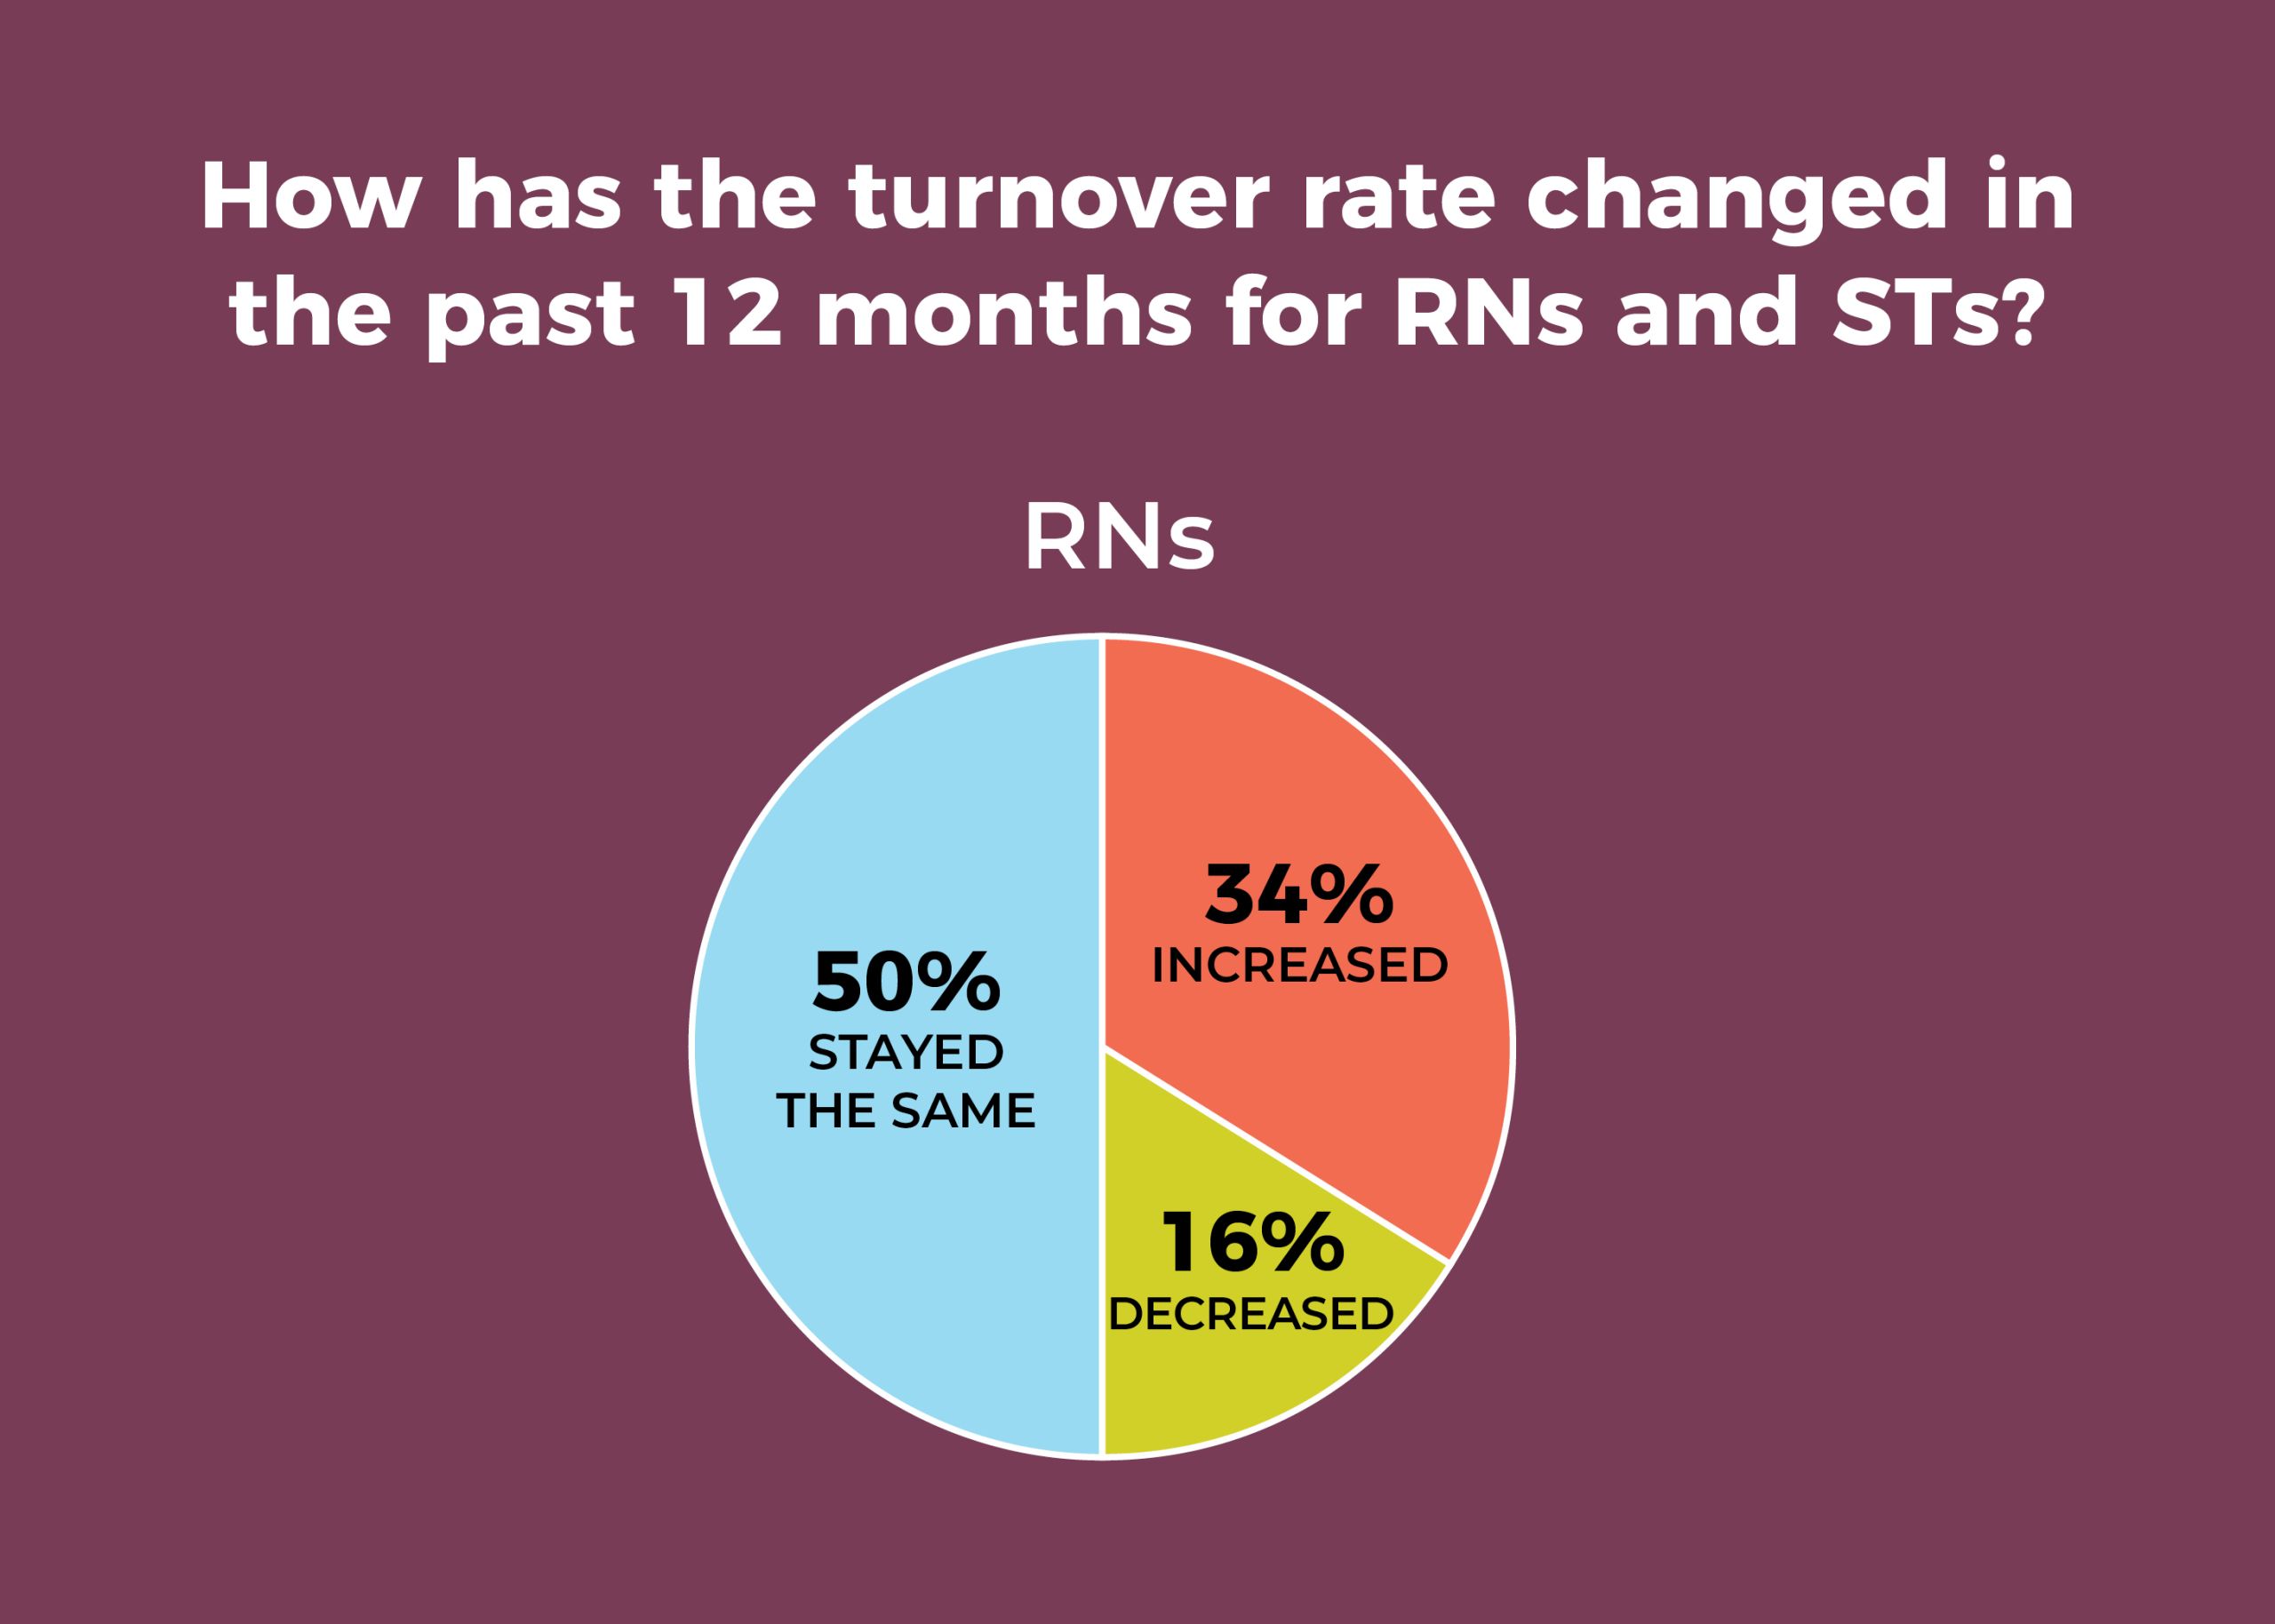
Turnover continues to trouble OR leaders, with more than a third (34%) reporting that the turnover rate for RNs has increased in the past 12 months, and only 16% reporting a decrease. The percentage of RN turnover in the past 12 months ranged from 0 to 75%.
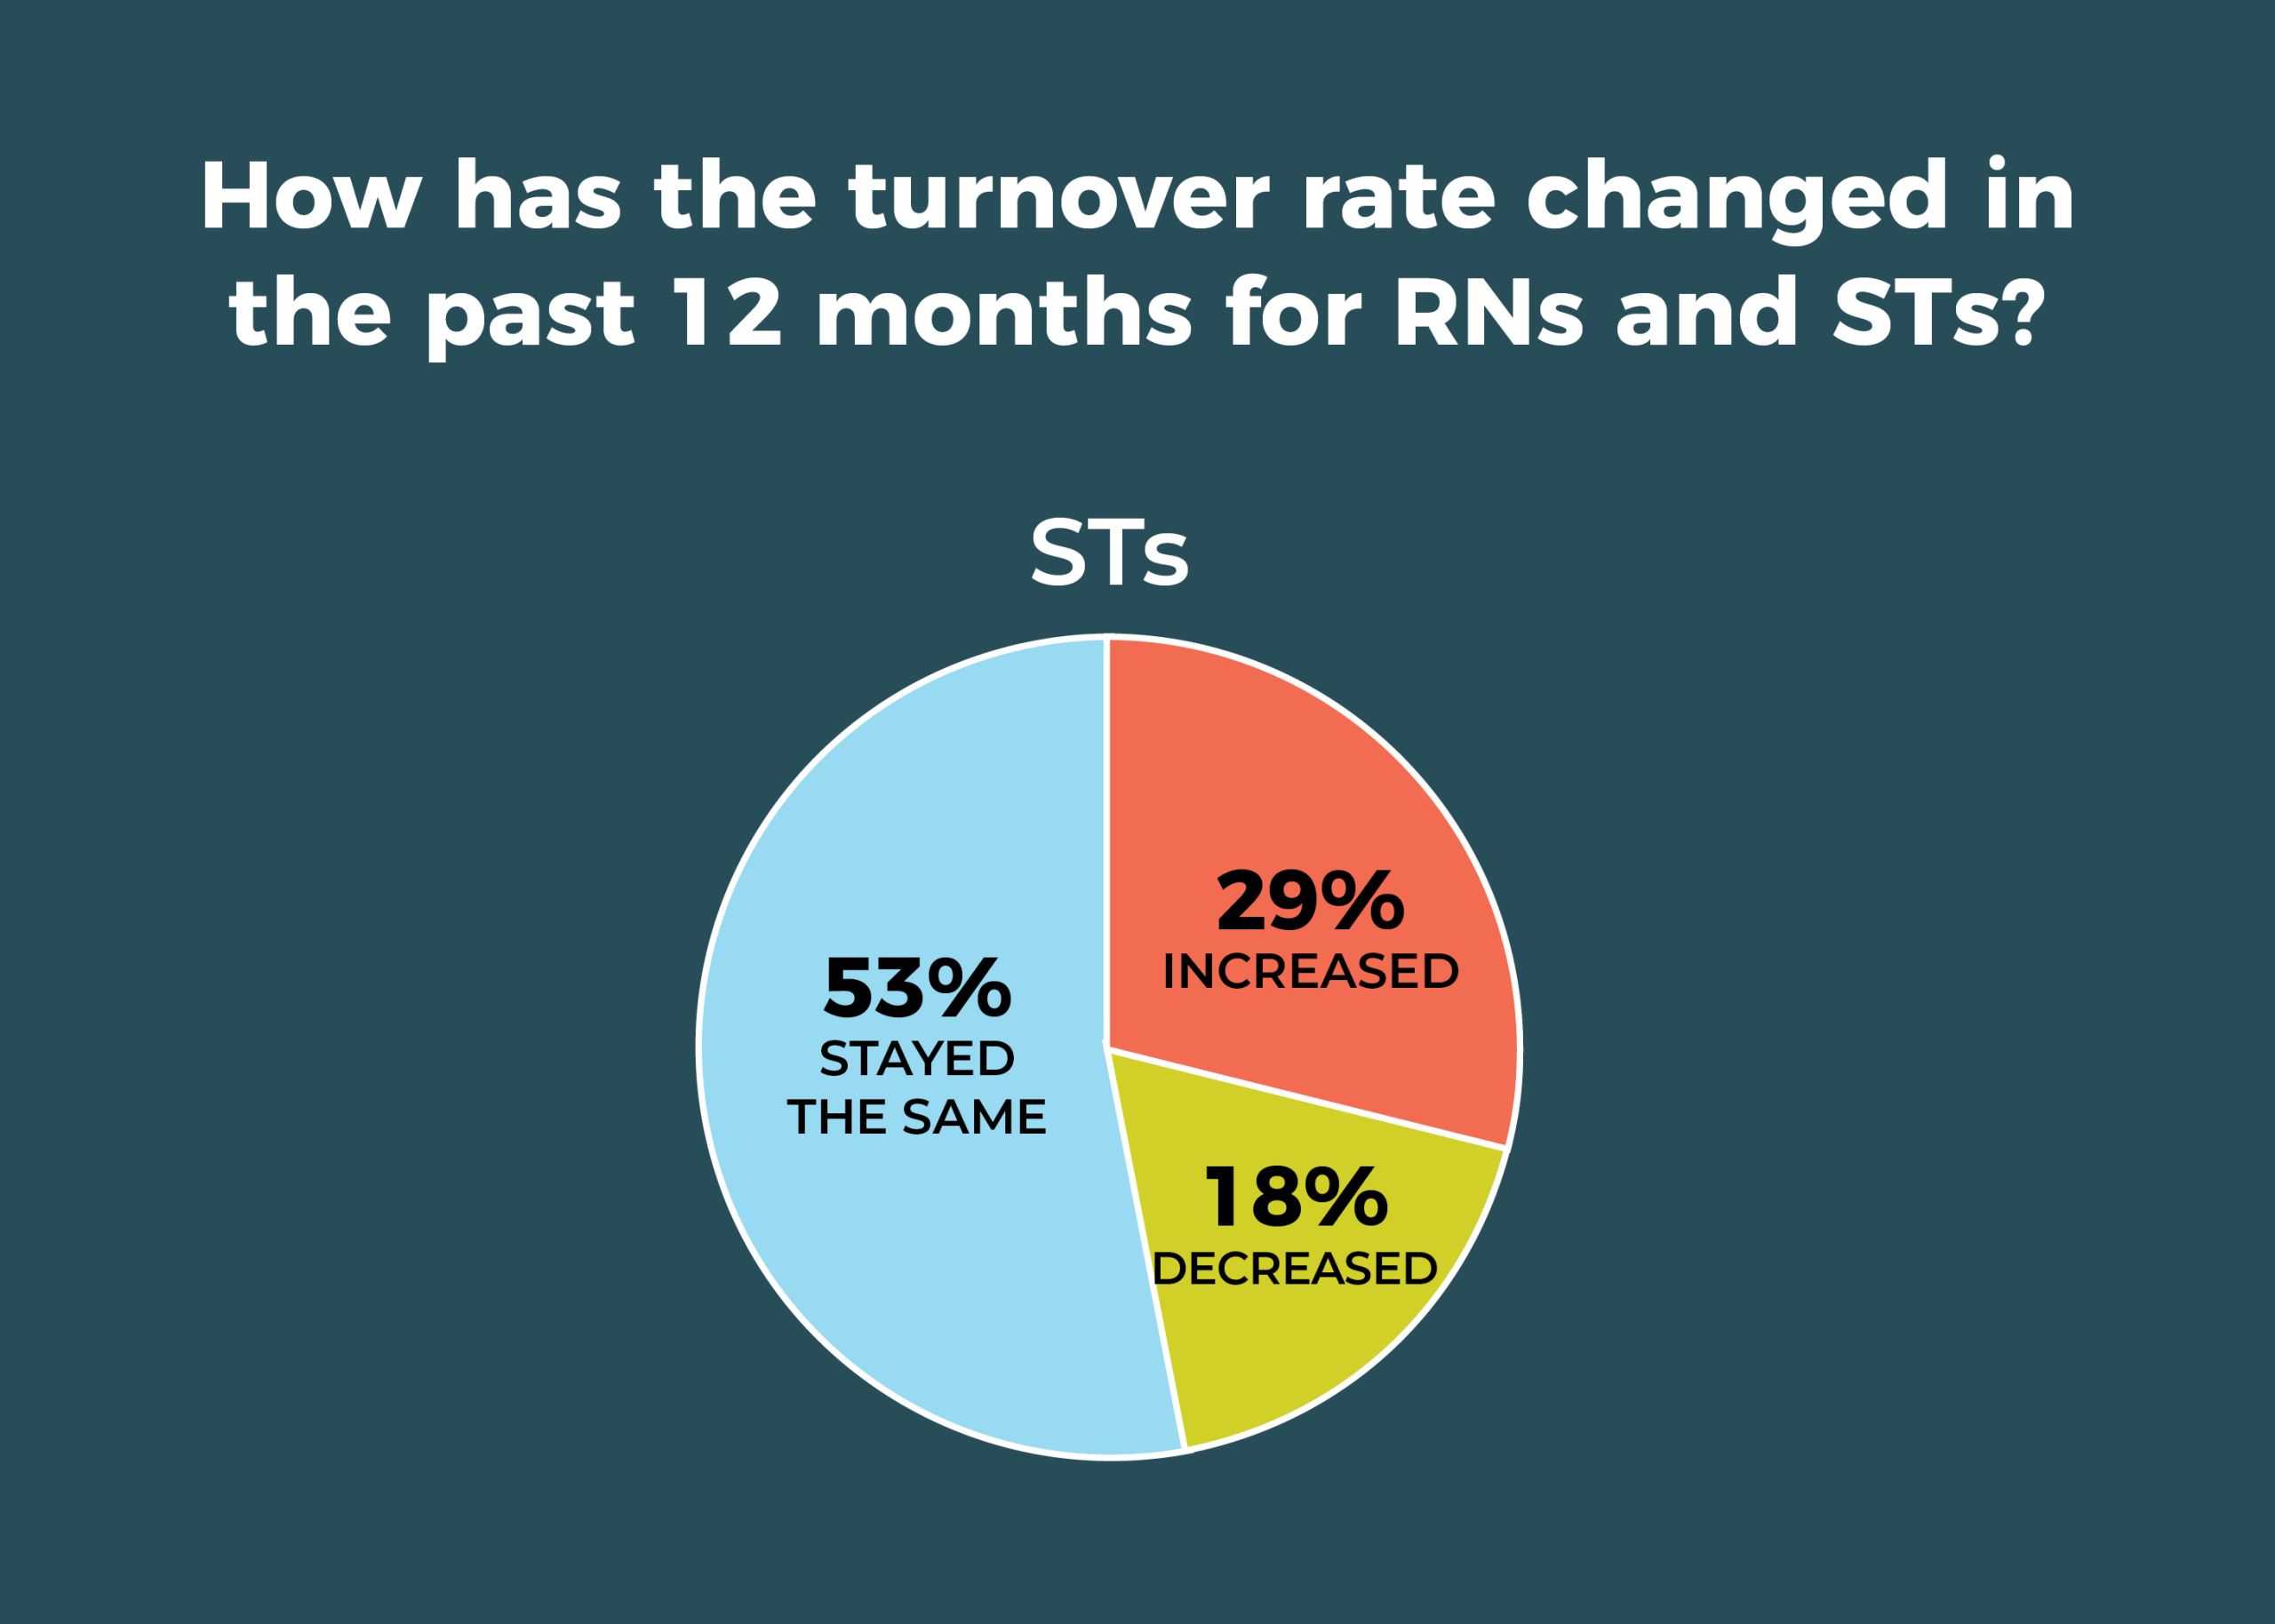
ST positions are slightly less troublesome, with 29% of respondents reporting an increase in turnover. And there was a glimmer of good news: 18% said ST turnover has decreased, up from 11% last year. It will be interesting to see if that trend holds.
For both RNs and STs, about half (50% and 53%, respectively) of respondents reported turnover has stayed the same. The percentage of ST turnover in the past 12 months ranged from 0 to 70%.
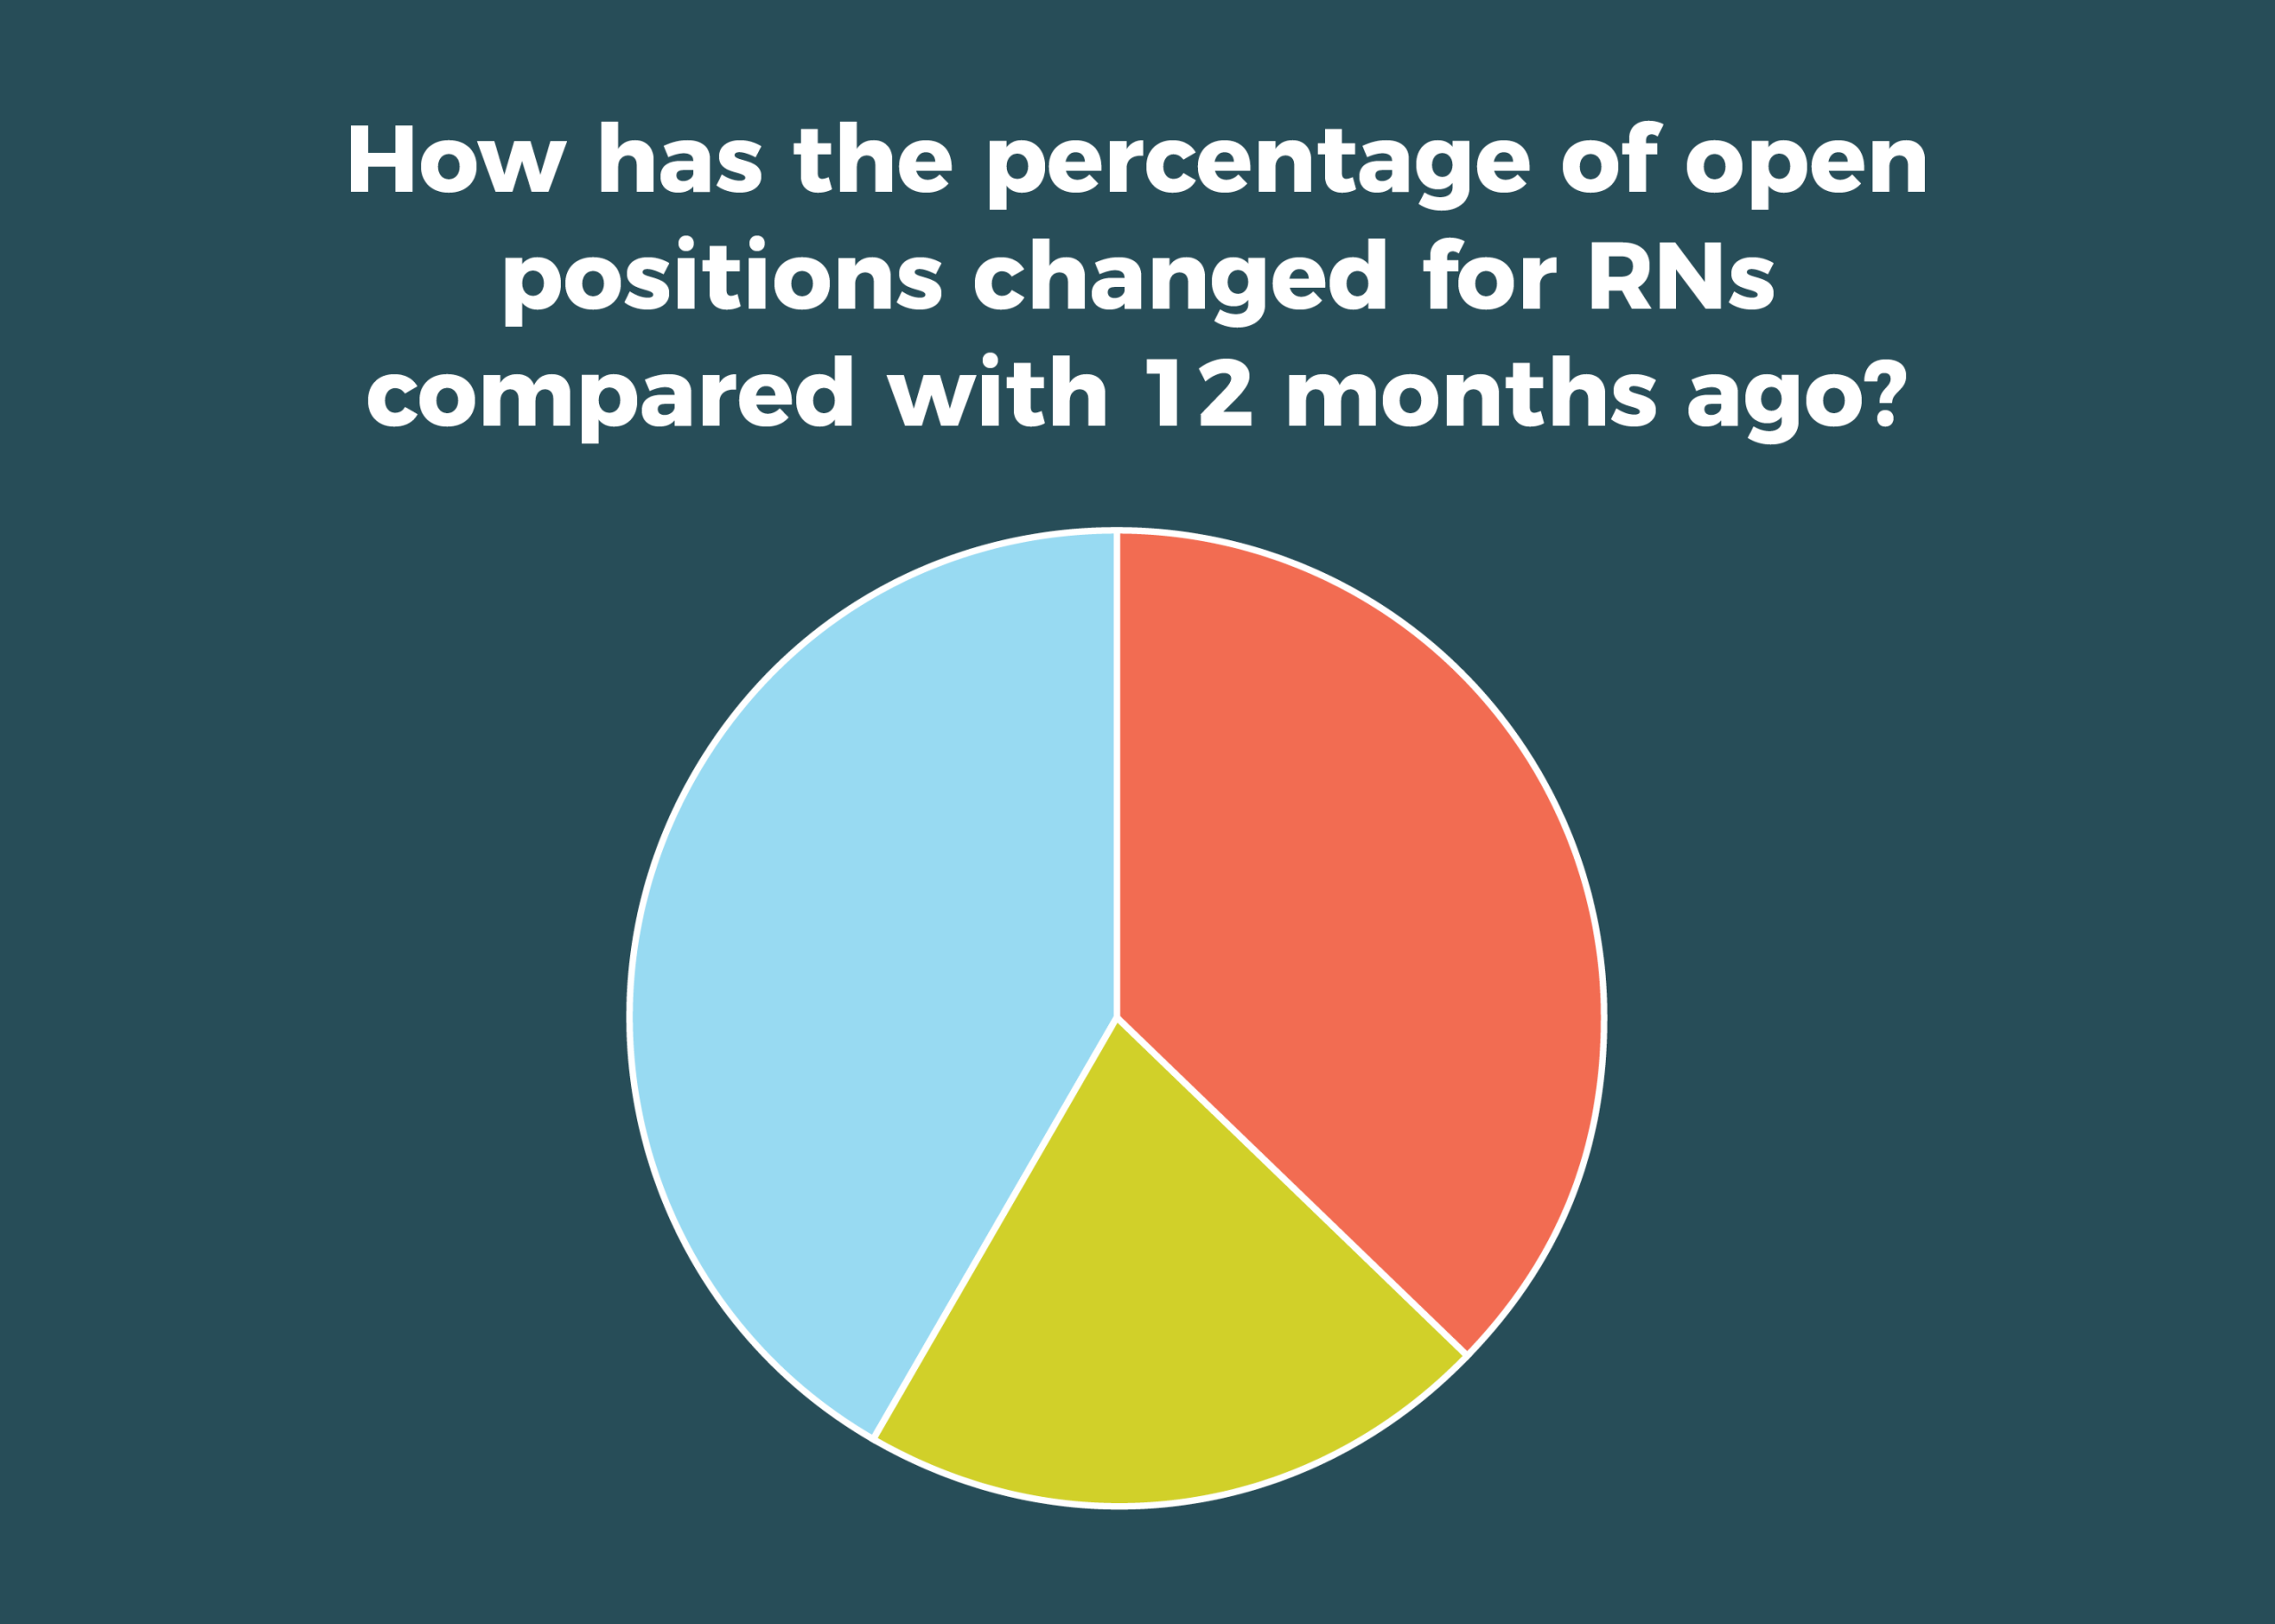
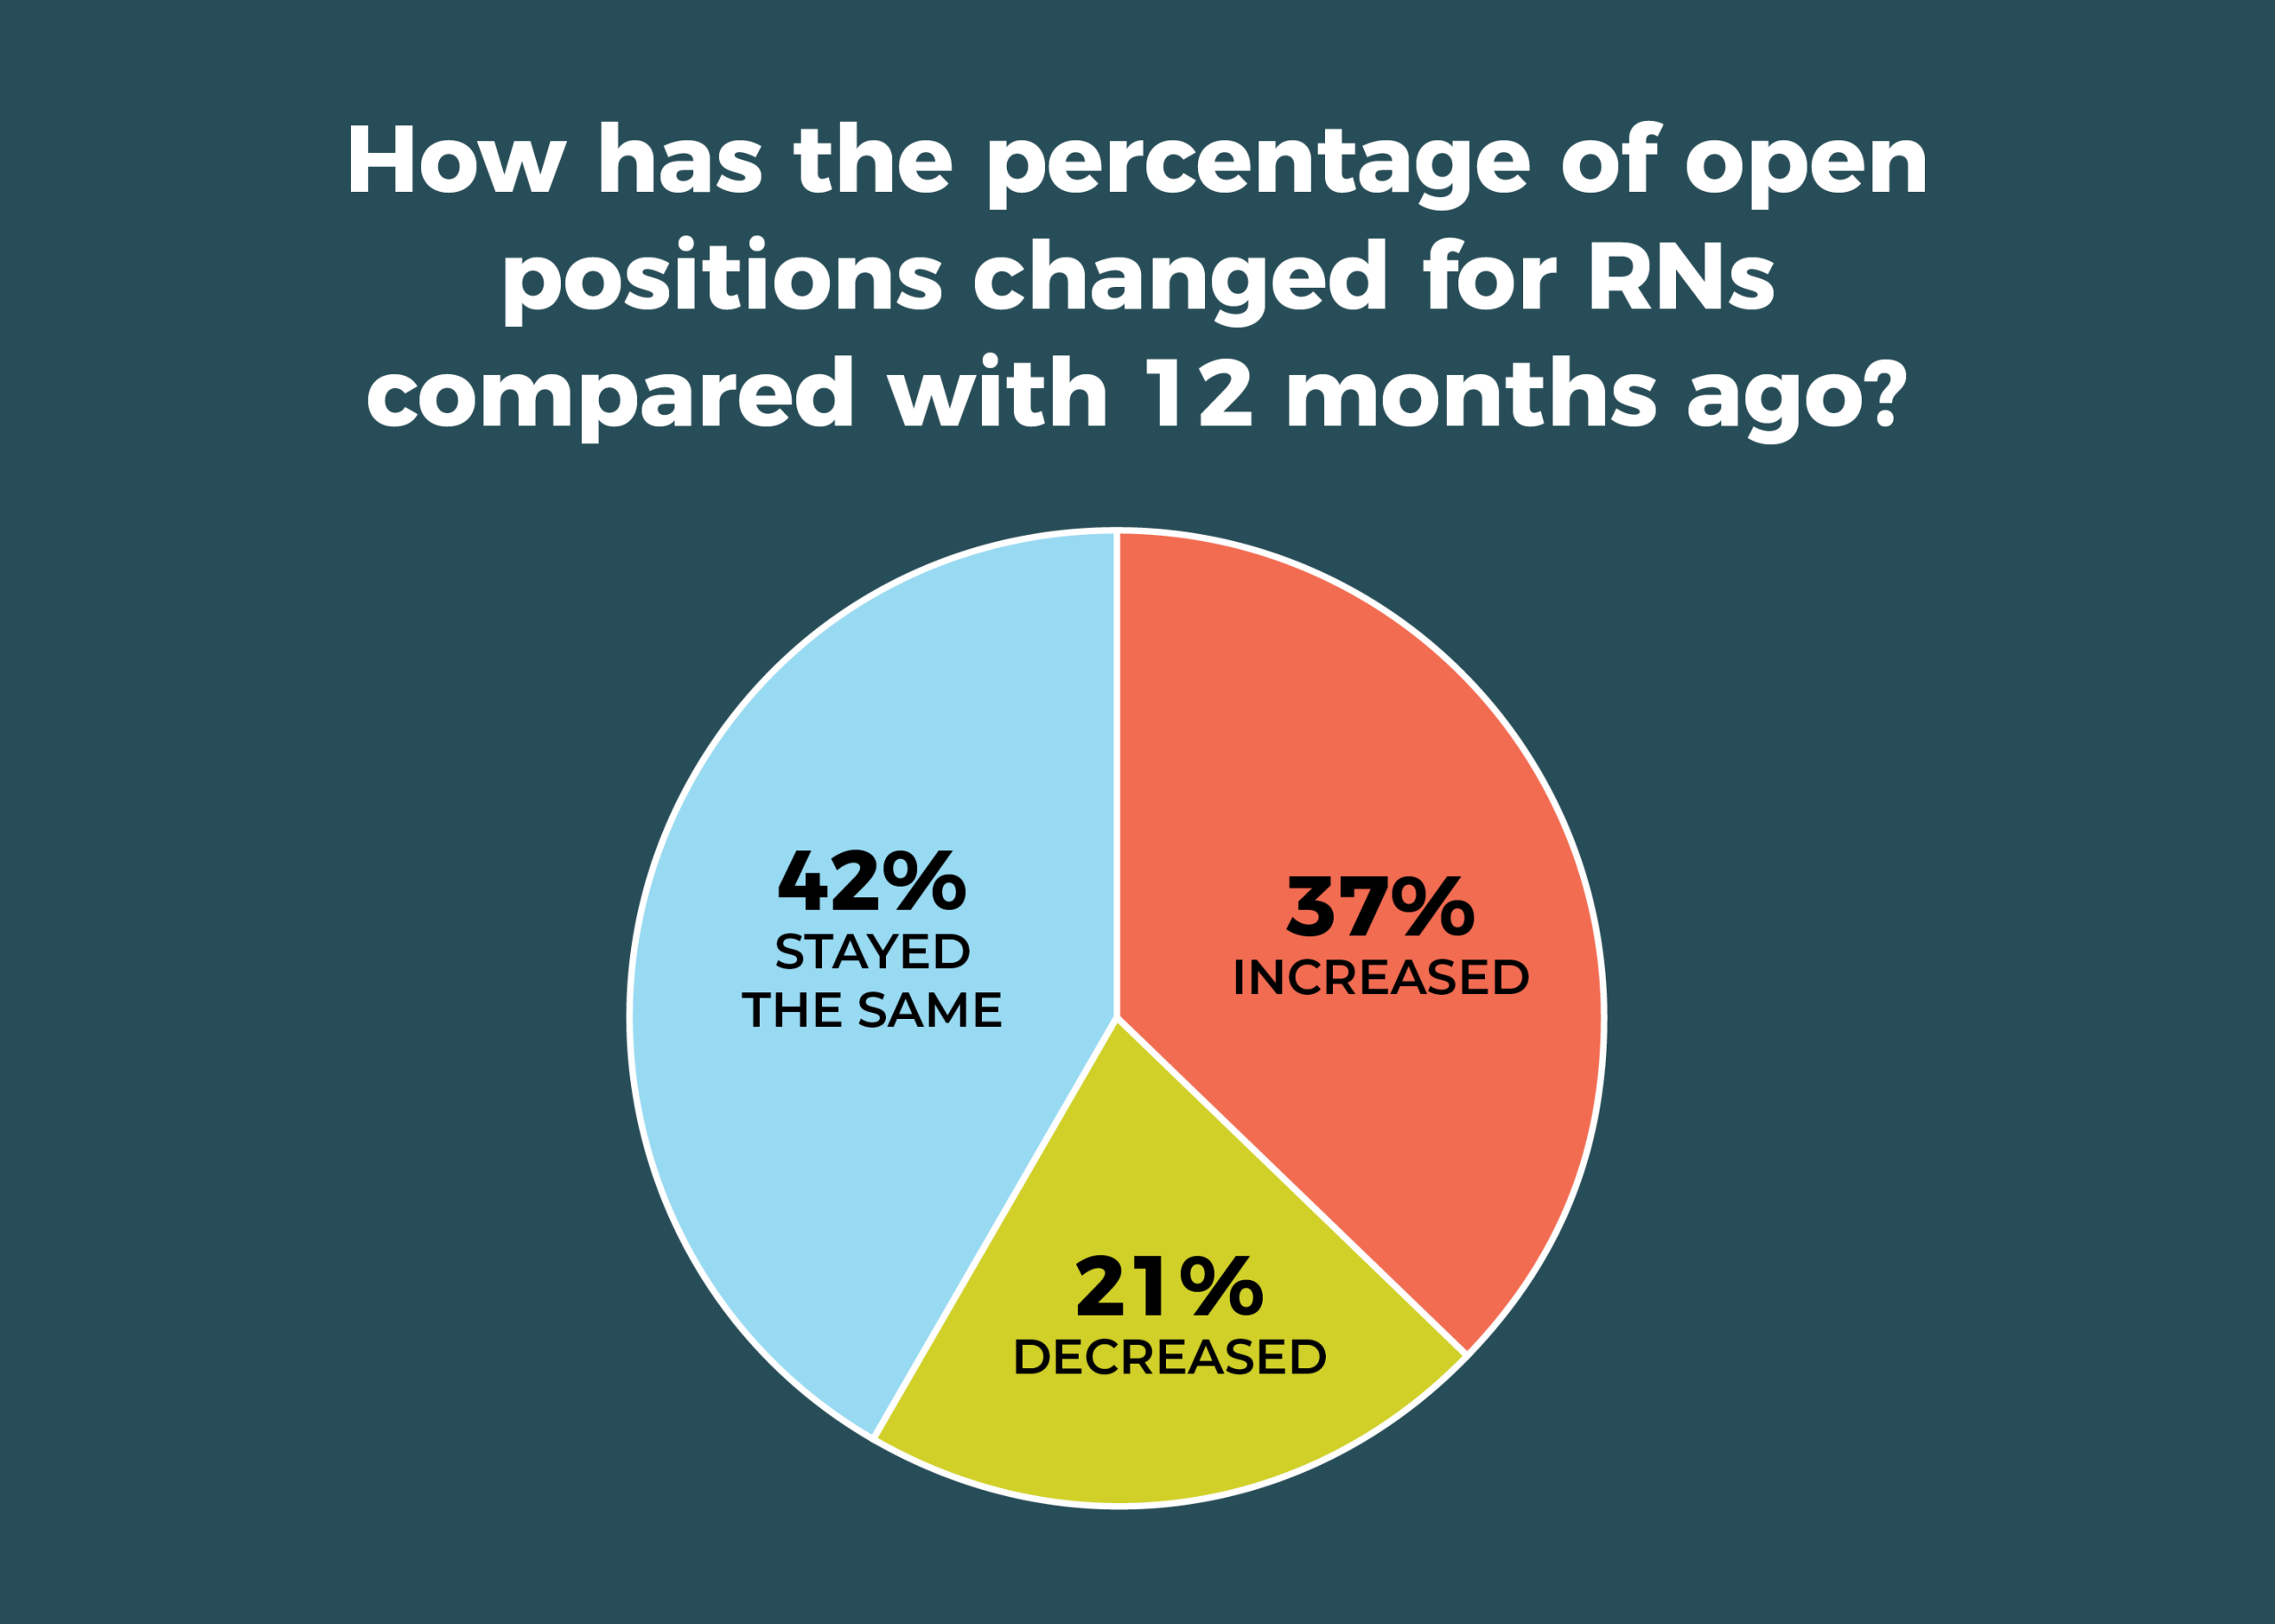
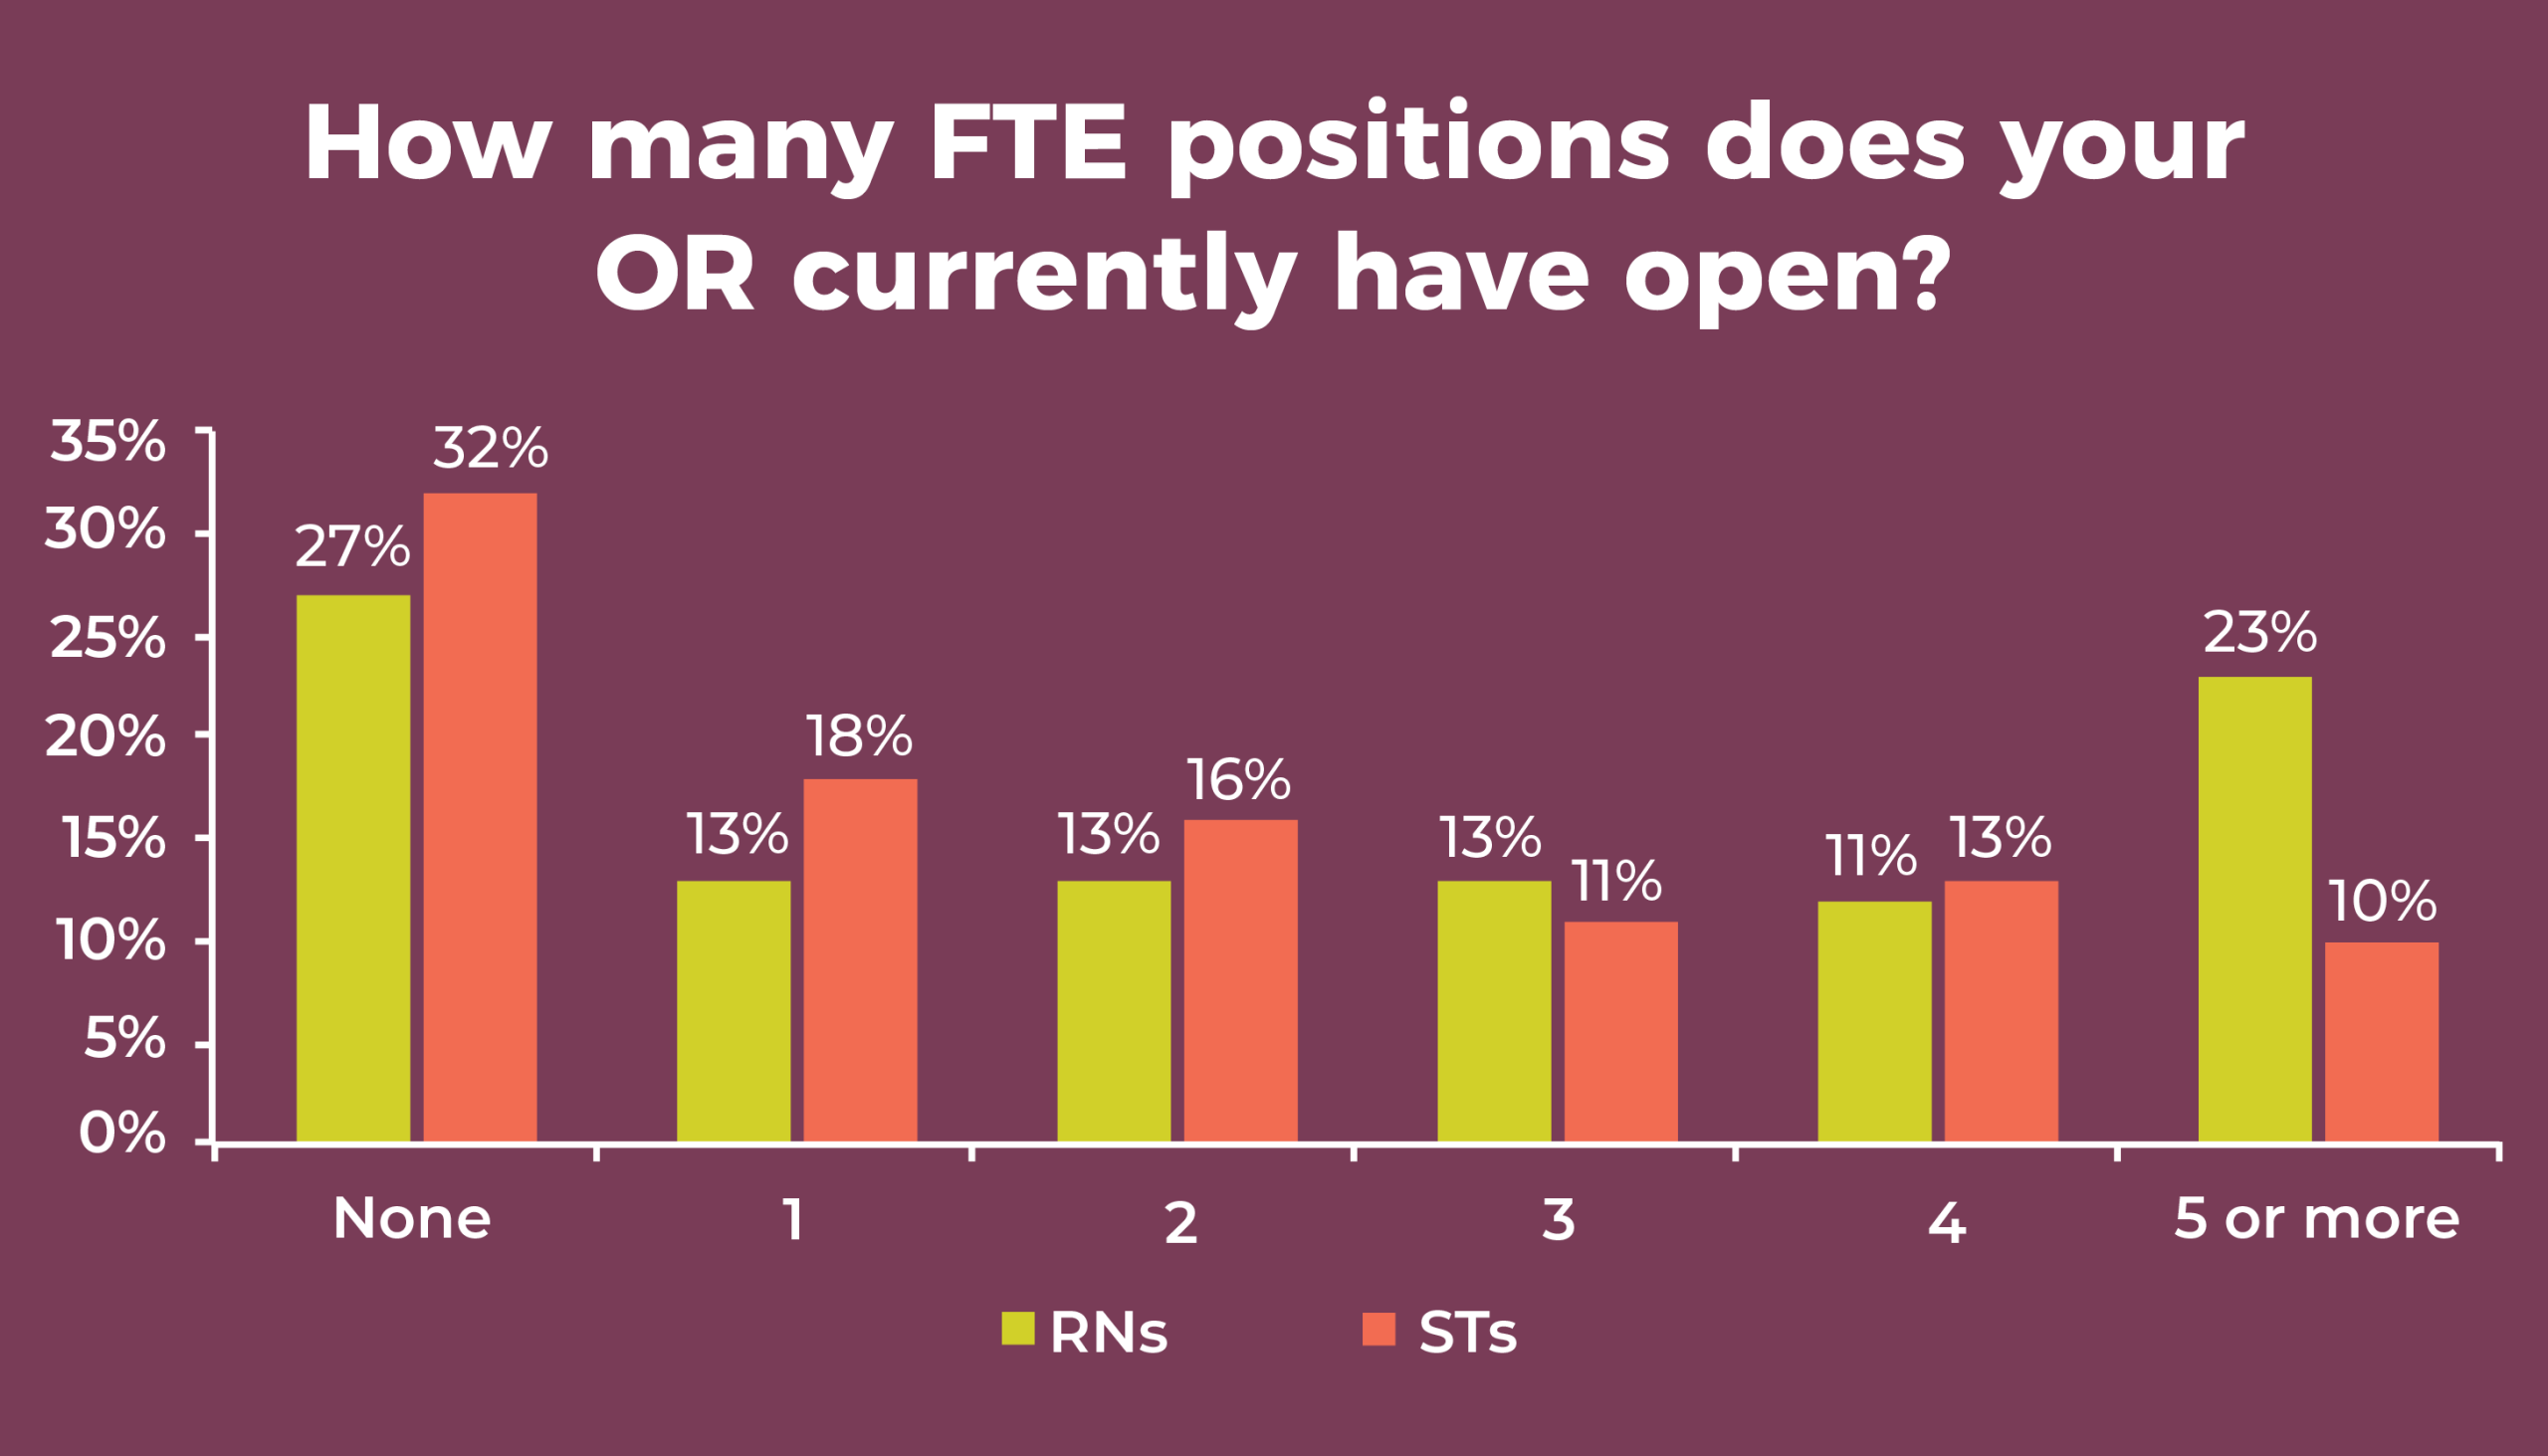
The percentage of open full-time equivalent (FTE) positions for RNs in the past 12 months again increased for more than a third (37%) of participants (the same as last year and comparable to 33% reported in 2017), with only 21% (vs 17% in 2017) reporting a decrease. More than a quarter (27%) said they have no open RN positions (the same as last year), but nearly one-fourth (23%) said they have five or more—similar to the 21% reported in 2018.
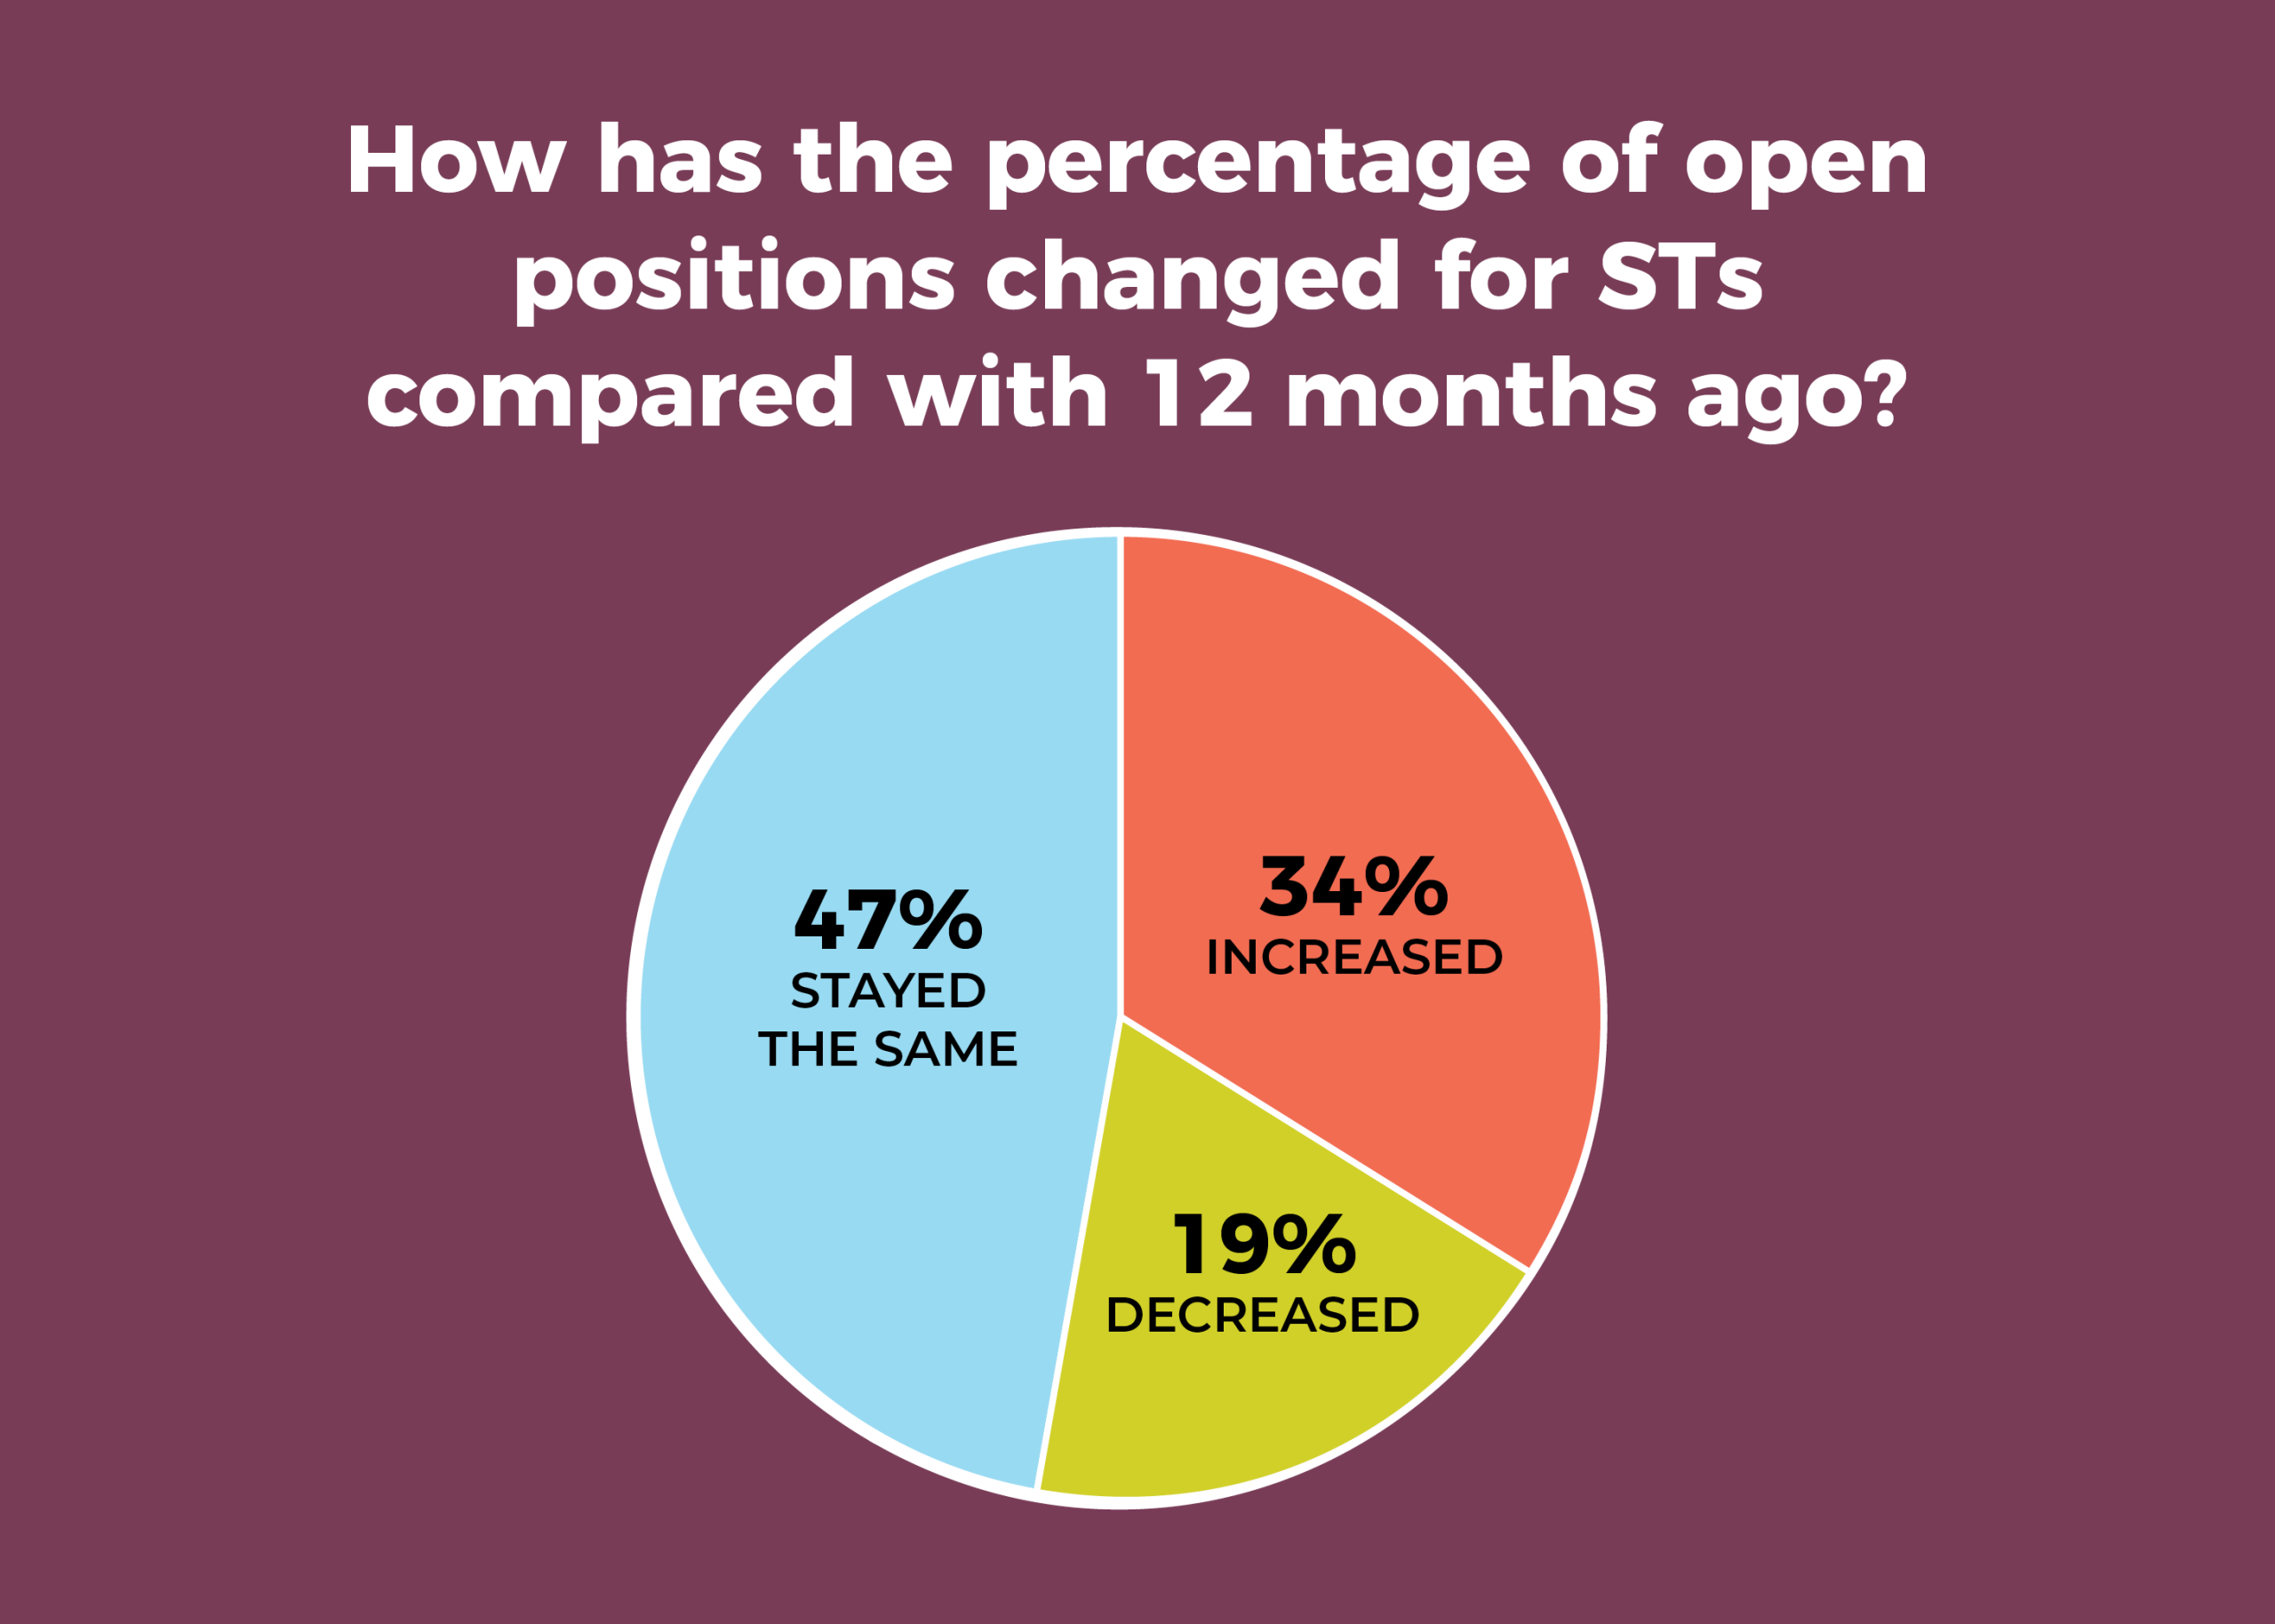
The percentage of respondents reporting an increase in ST open FTE positions declined from 37% in 2018 to 34% this year. In all, 19% reported a decrease, the same as in 2017 and slightly higher than the 14% reported in 2018. Nearly a third (32%) of respondents said they have no open ST positions, essentially unchanged from 33% in 2018. Only 10% said they have five or more open ST positions, the same as last year.


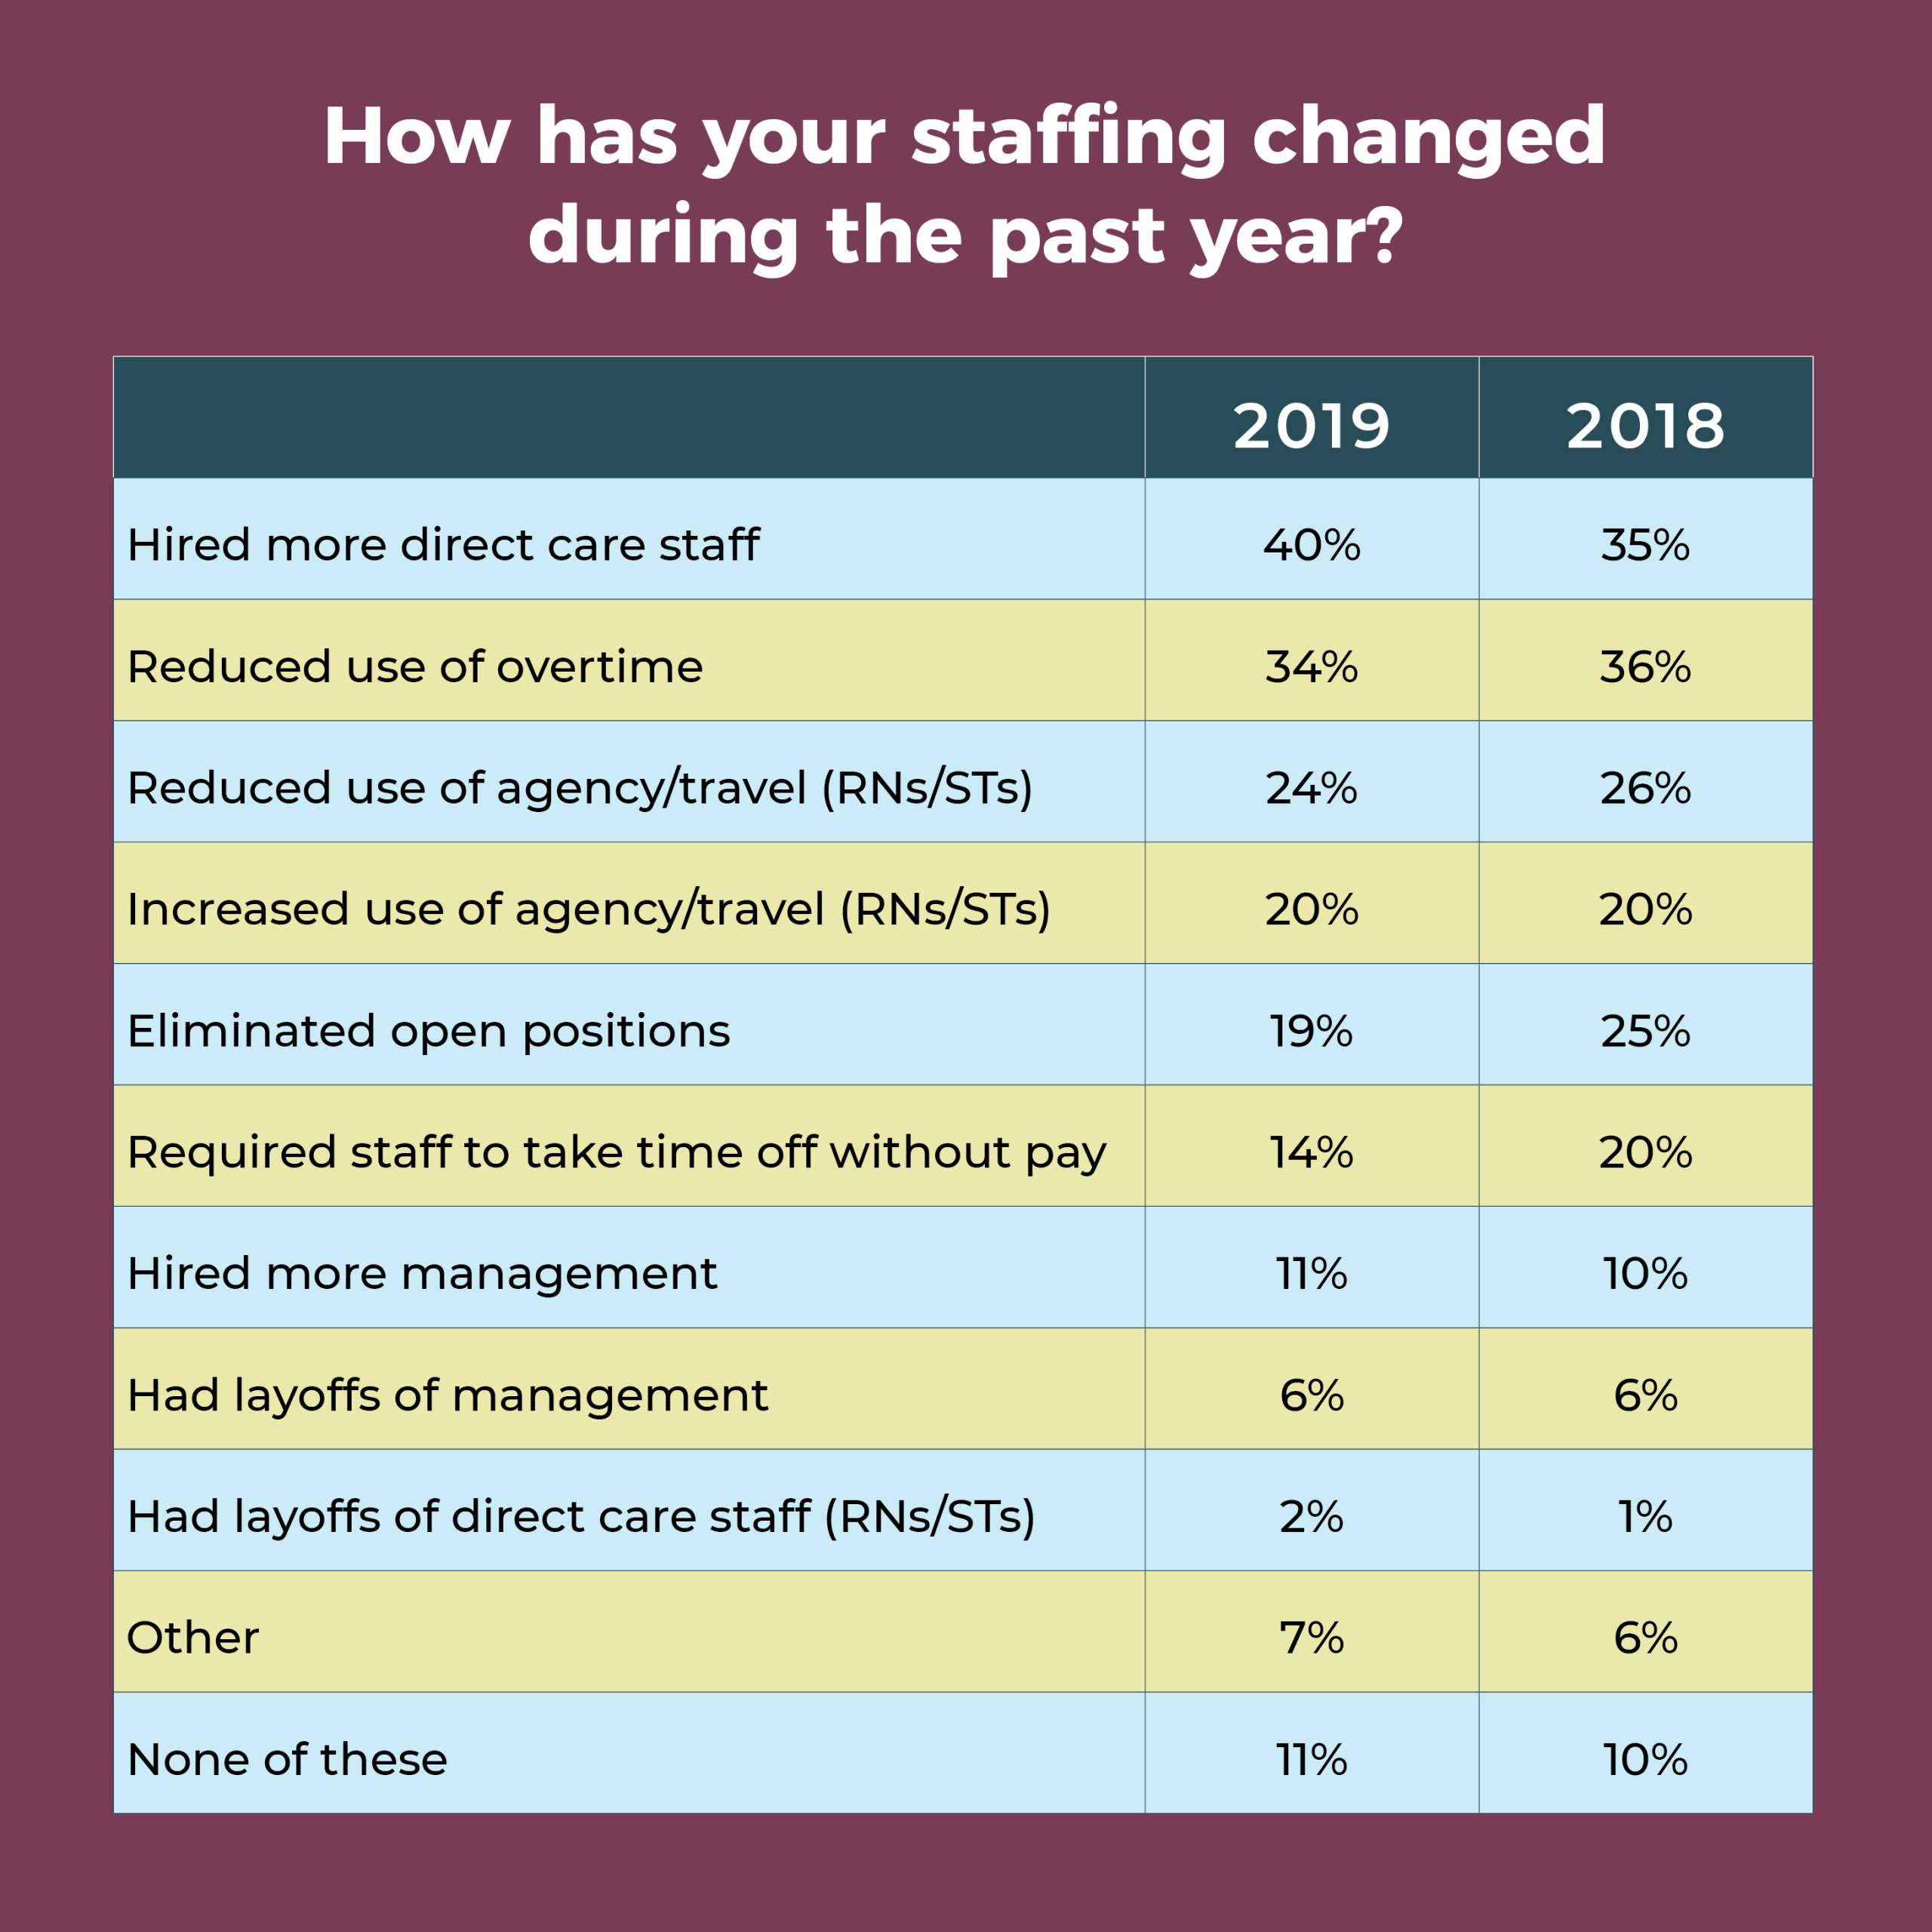
Given the frequency of staff transitions and the number of open positions, it’s not surprising that 40% of respondents hired more direct care staff in the past year, up from 35% in 2018 and 34% in 2017. In addition, 20% reported using more agency and travel staff, as was the case in 2018.
At the same time, however, OR leaders continue to address financial pressures through staffing actions. More than a third (34%) have reduced the use of overtime, comparable to the 36% reported in 2018, and 24% have reduced the use of agency and travel staff, similar to the 26% reported last year. Other staffing actions include:
- Eliminating open positions. This year, 19% of respondents said they have had to do this, compared with 25% in 2018 and 31% in 2017. Could this mean staff are so lean that further cuts aren’t feasible?
- Requiring staff to take time off without pay. This trend is turning downward, with just 14% of respondents resorting to this strategy, compared with 20% last year and 24% in 2017.

Finding staff hasn’t gotten any easier for OR leaders since the 2018 survey results were reported. Only 5% of respondents said it is easier to recruit experienced OR nurses compared with 12 months ago, similar to last year’s 6%, and up from 2% in 2017.
OR leaders have been focusing more on recruiting new or inexperienced OR nurses because experienced nurses are so difficult to find. However, it’s also challenging to find new or inexperienced OR nurses; 26% of respondents said it has been more difficult to recruit this group compared to 12 months ago. In 2018, 25% reported difficulty, up from 16% in 2017.

When considering an applicant’s qualifications, 45% (comparable to 44% last year) of OR leaders require a candidate to have a baccalaureate degree in nursing (BSN), and 59% (similar to 57% last year) require an associate degree in nursing (ADN). Only 12% require certification (double the 2018 number), and 10% don’t require either a degree or certification.

More than half (51%) of OR leaders said it has been more difficult to recruit STs, comparable to the 52% reported last year. Only 9% said it has been easier vs 11% in 2018.


A total of 313 respondents provided usable data for the question on how surgical volume has changed over the past 12 months. In all, 18% reported volume has decreased, the same as in 2018, with the percentage of decrease ranging from 1% to 75%. The percentage of increased volume ranged from 2% to 50%. Of those who provided a percentage for the increase, 67% said it was 10% or less. (Most OR leaders reporting an increase did not provide a percentage, so that figure should be interpreted cautiously.)
ERAS was the most popular of the care model options in the survey, with more than half of participants (53%) saying it has been implemented or planned to be implemented in the next 6 months. The next highest was Accountable Care Organization (33%) followed by Clinically Integrated Networks (20%) and the Perioperative Surgical Home (12%).
Optimal care delivery depends on reimbursement, and more than 300 of respondents shared their “biggest concern” in this area. Payer mix topped the list, with more than 75 mentions. For example, one person noted, “Payer mix for our population is a concern as a large portion of the population surrounding our small community hospital has Medicaid.”
Bundled payments and documentation requirements weren’t far behind. Most respondents believe bundled payments are insufficient to cover costs, and loss of reimbursement can occur with the increasingly complex documentation requirements. “My biggest concern about reimbursement today is meeting documentation requirements,” one respondent noted.
Another respondent summed up the situation by saying, “Reimbursement continues to decline, capital cost continues to escalate, and documentation has become too complex.”
Other concerns included not receiving reimbursement for new technology, decreased reimbursement for critical access hospitals, and proper filing of claims.


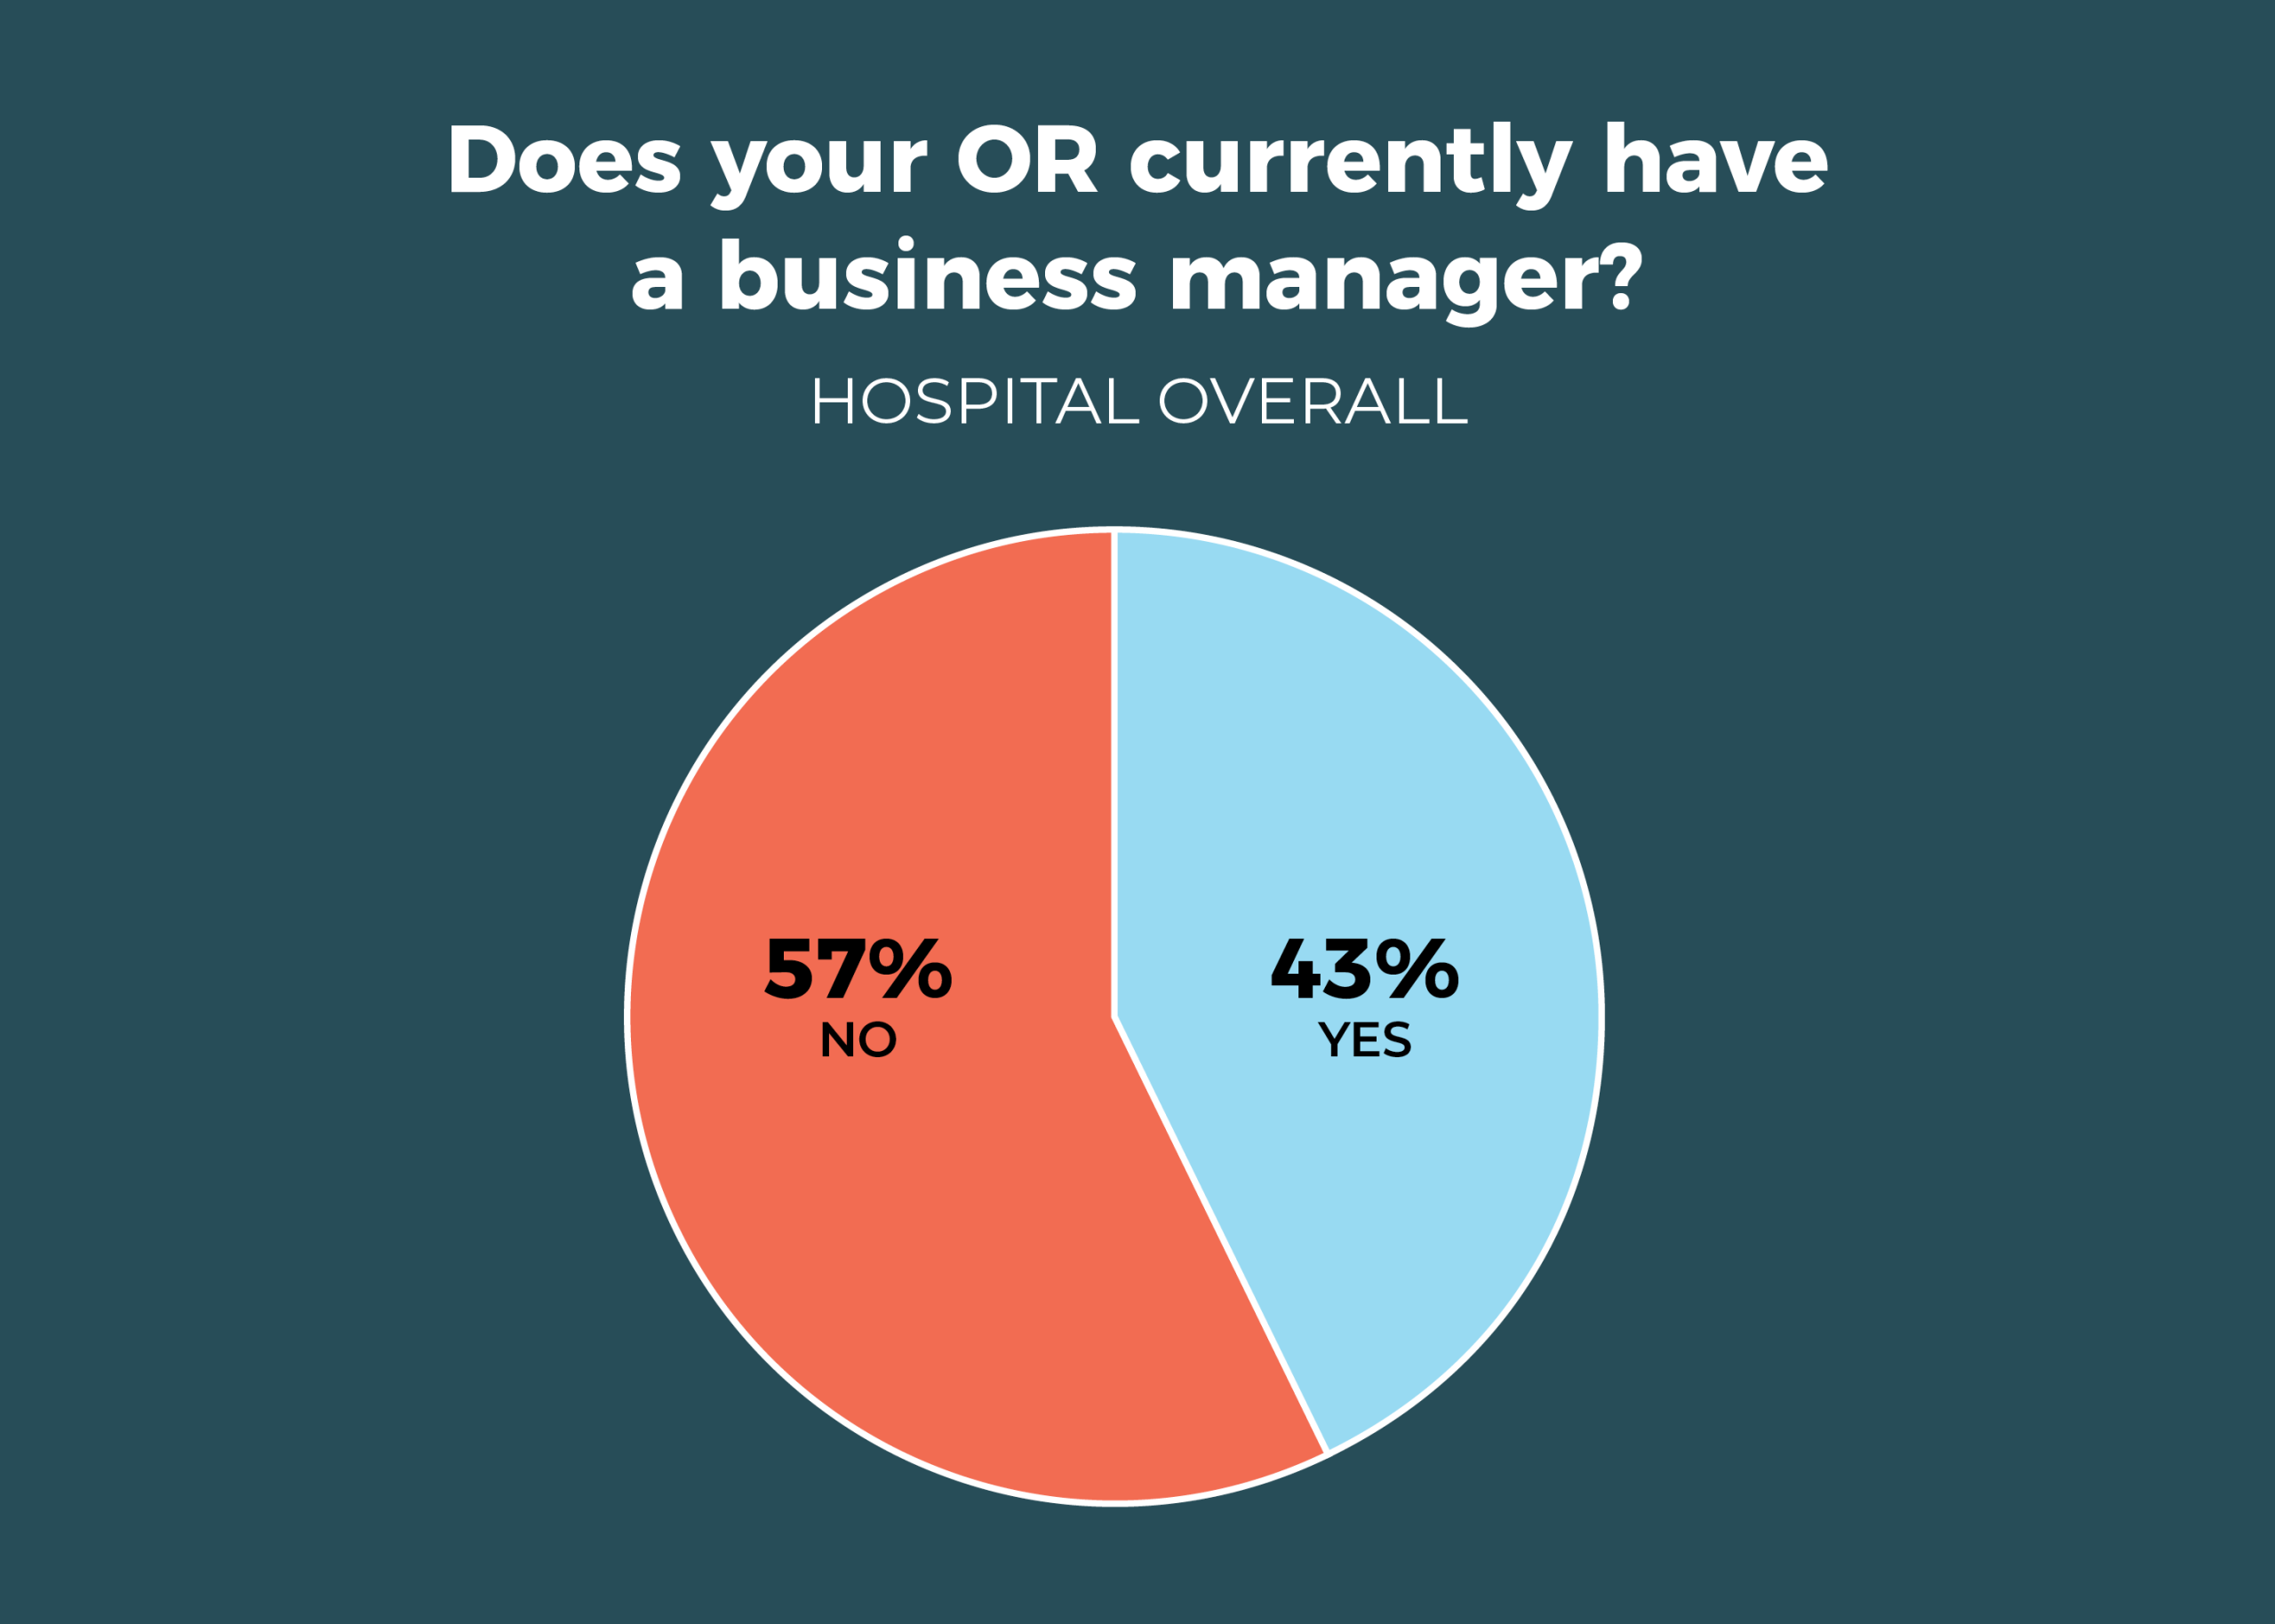
For the first time, the percentage of OR leaders who work with a business manager broke 40%: It rose to 43% from 35% last year and reflects a general upward trend: 38% in 2017, 33% in 2016, and 29% in 2015. Reported salaries were higher this year, with more than a fourth of business leaders (27%) in the more than $100,000 range.

- Only 29% of OR leaders require business managers to have a clinical background. Although that’s higher than the 16% in 2018, it’s comparable to the 25% in 2017.

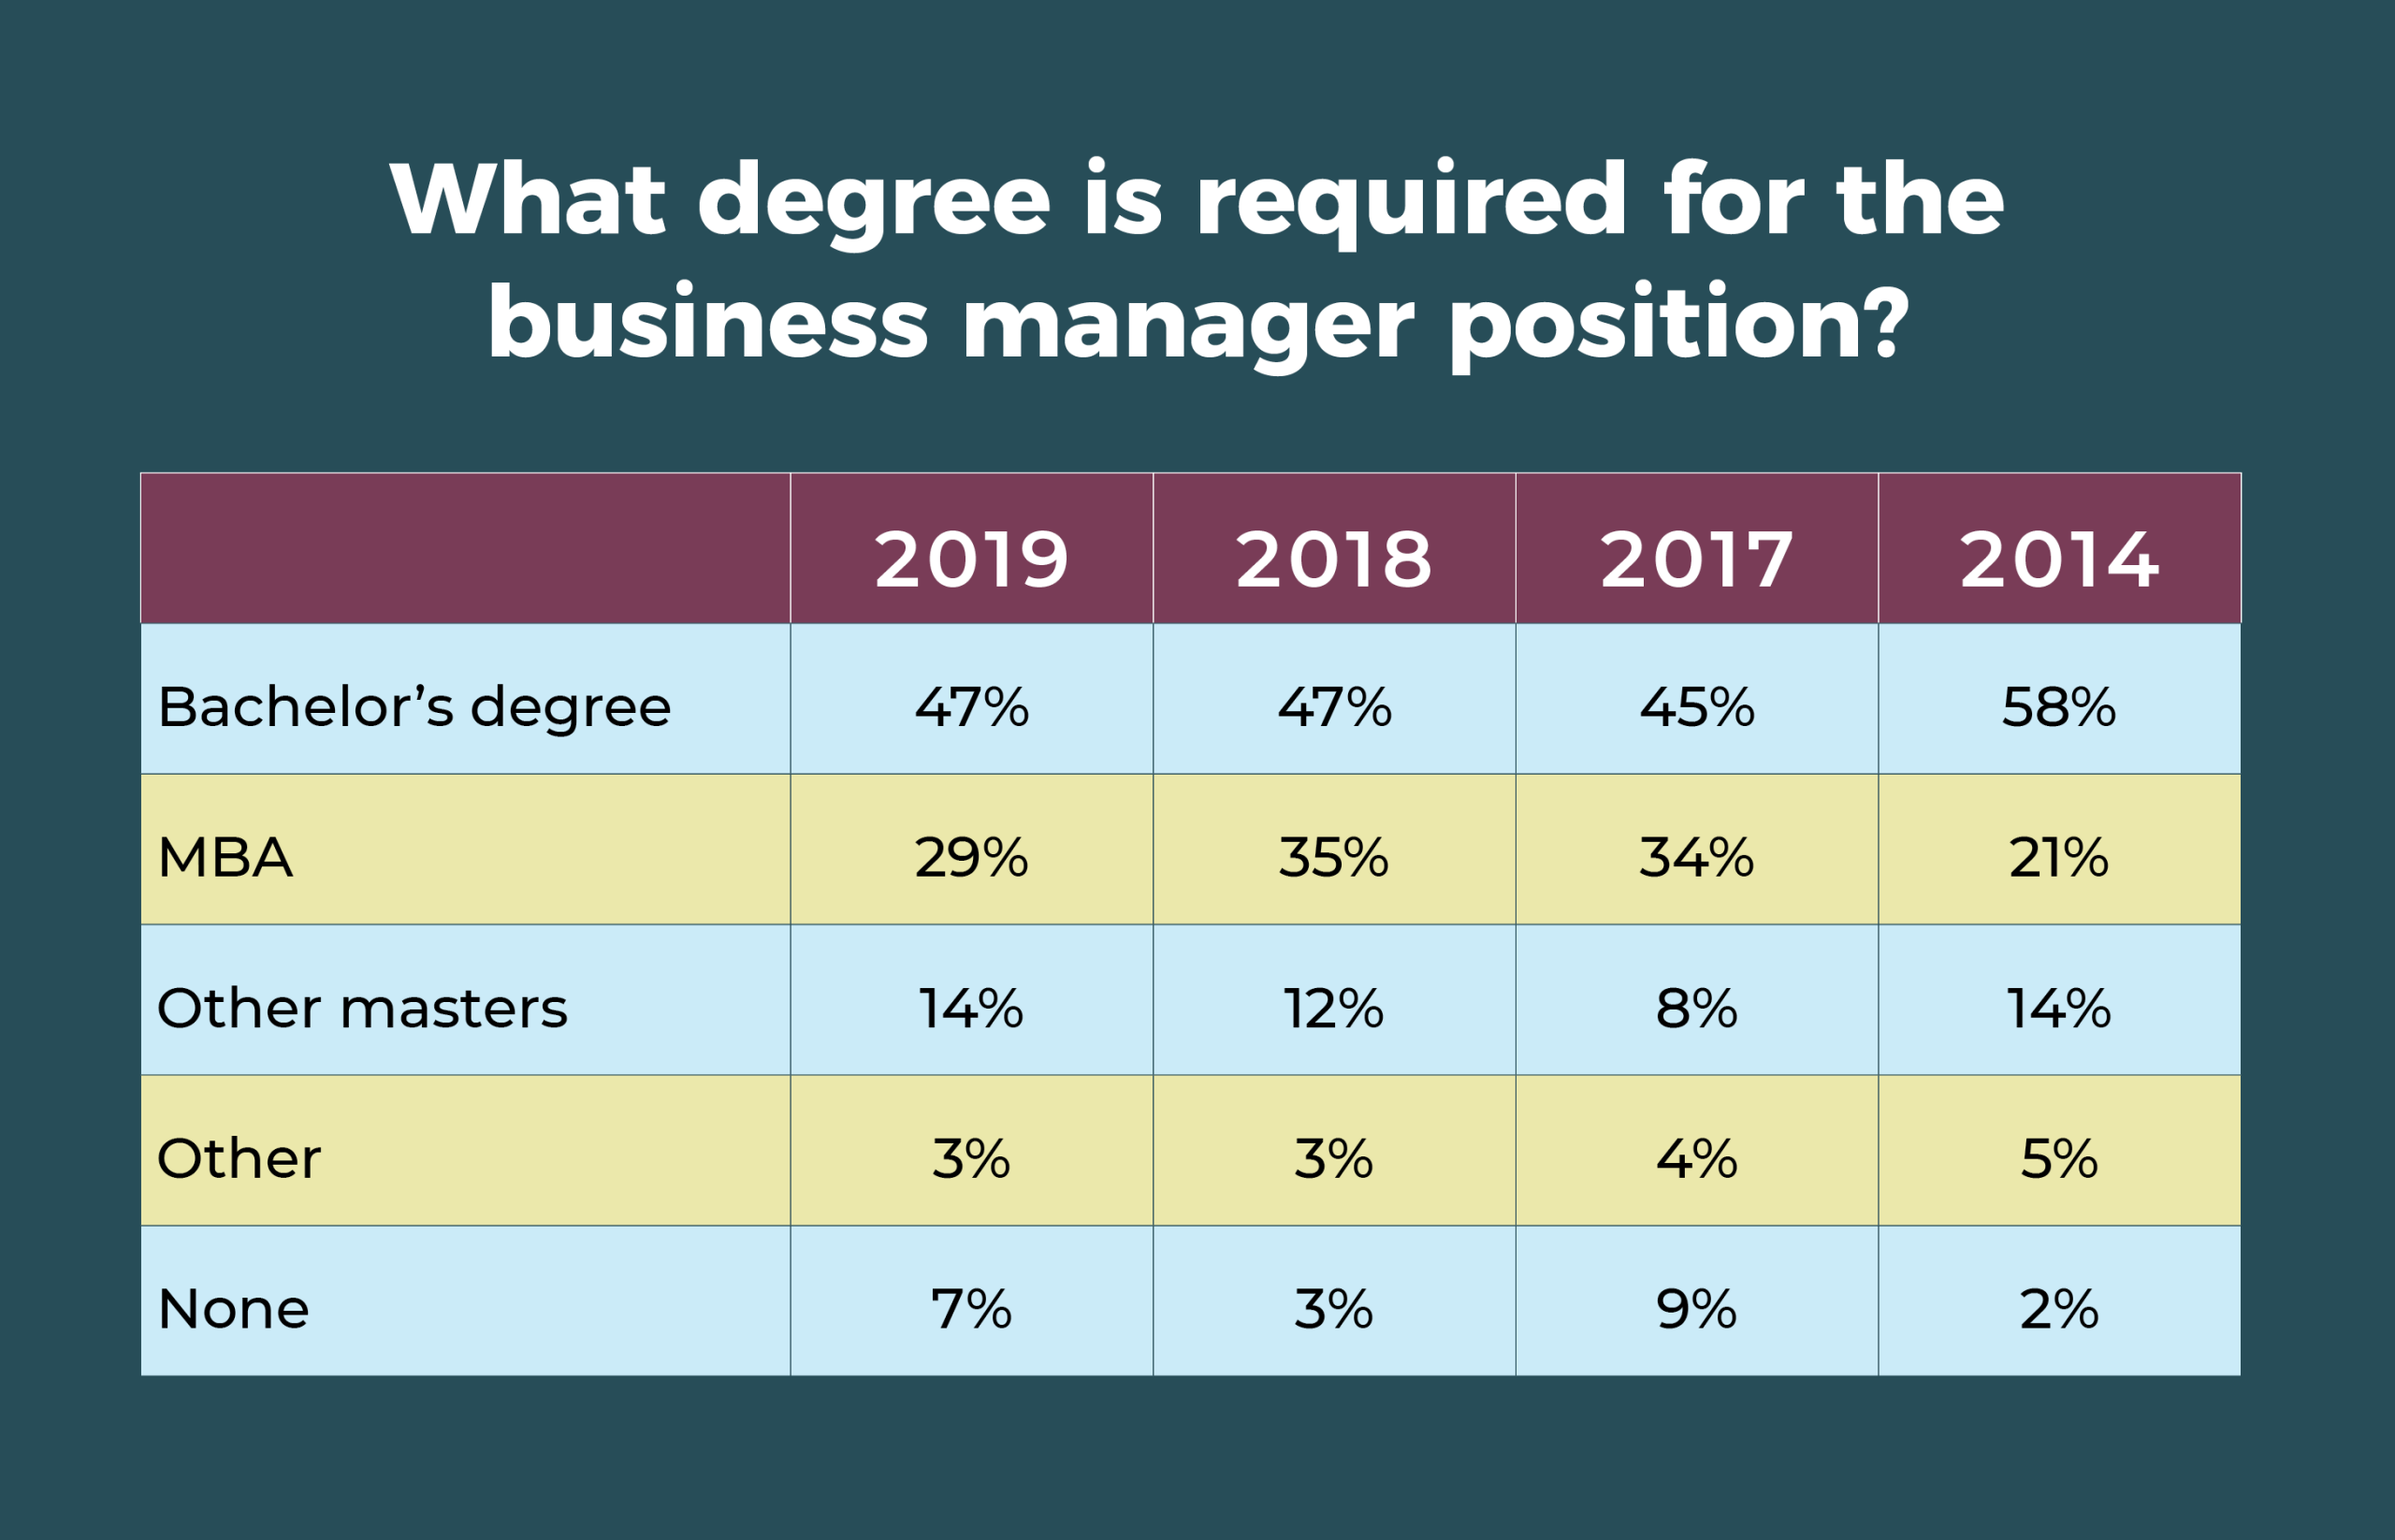
- The education requirement for business managers has stayed consistent in the past 3 years, but it should be noted that the percentage requiring a master’s degree is significantly higher than what was reported in 2014.

- Annual salaries of $90,000 to more than $100,000 a year were reported for about 40% of business managers, compared with 27% last year. In all, 22% of respondents said they did not know the current salary of their business managers.

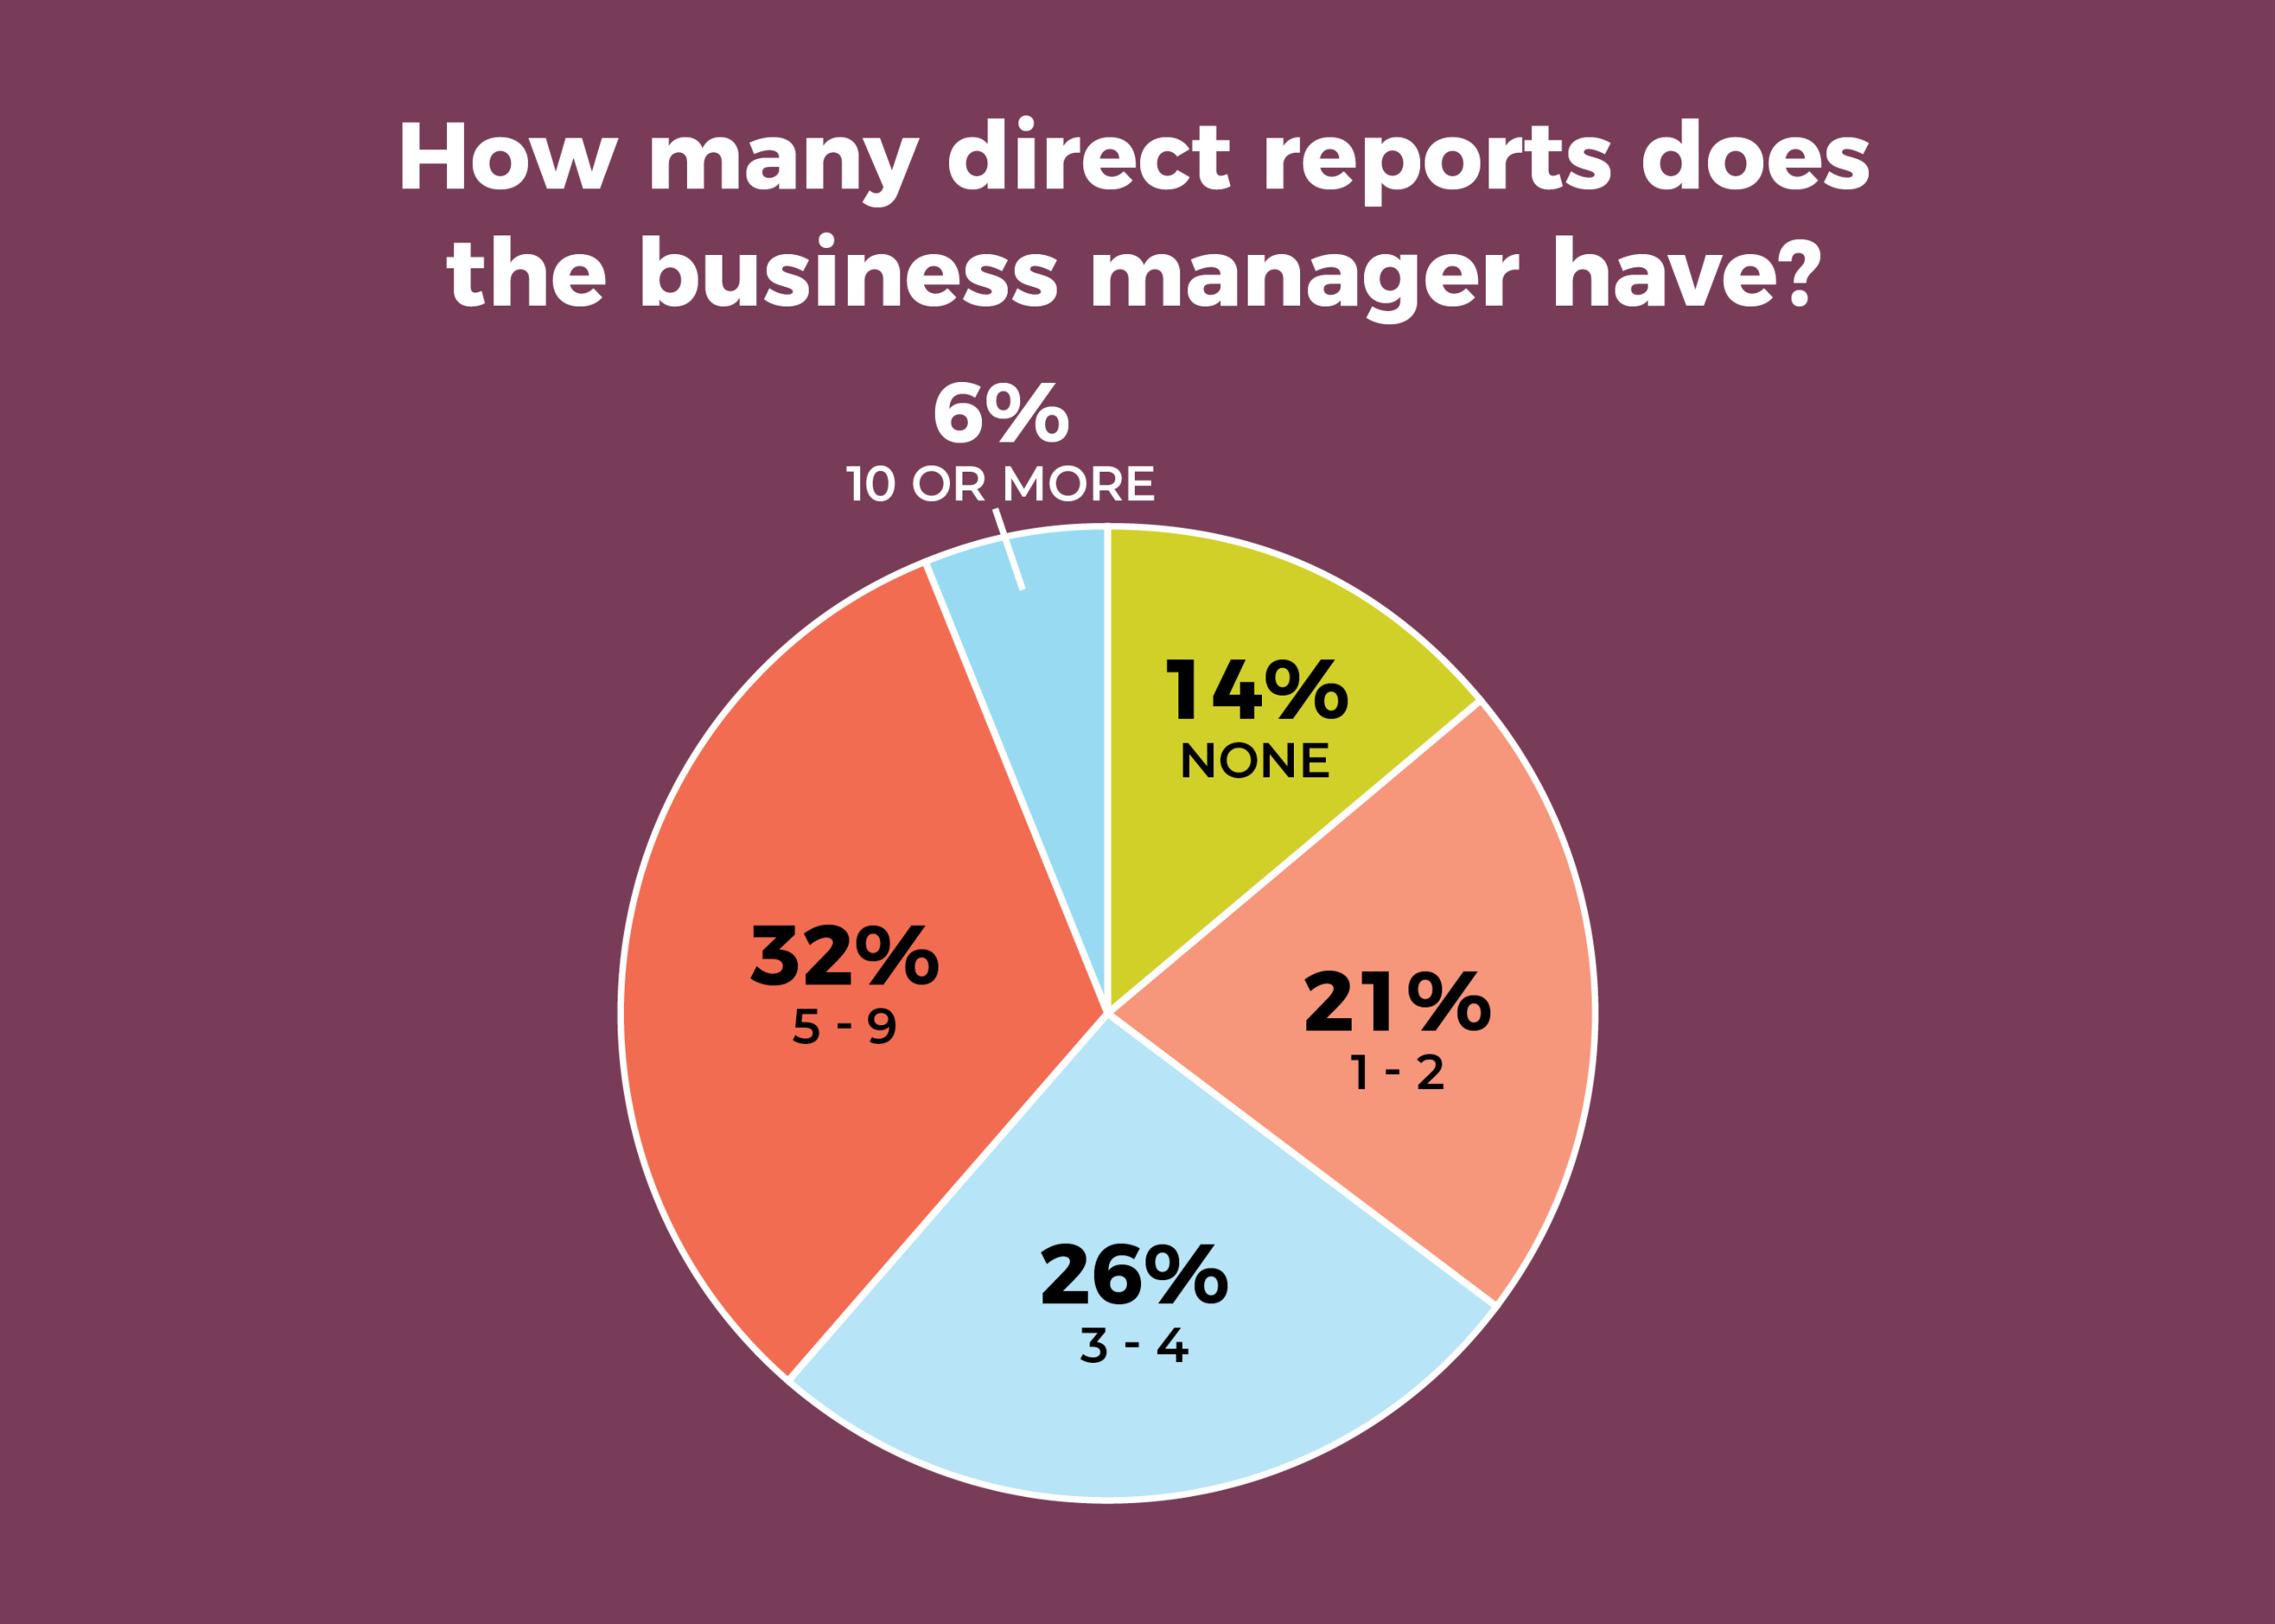
- The number of direct reports for business managers is slightly higher this year, with 32% reporting 5 to 9, compared with 21% in 2018. Only 14% have no direct reports, down from 27% last year; it was 17% in 2017.
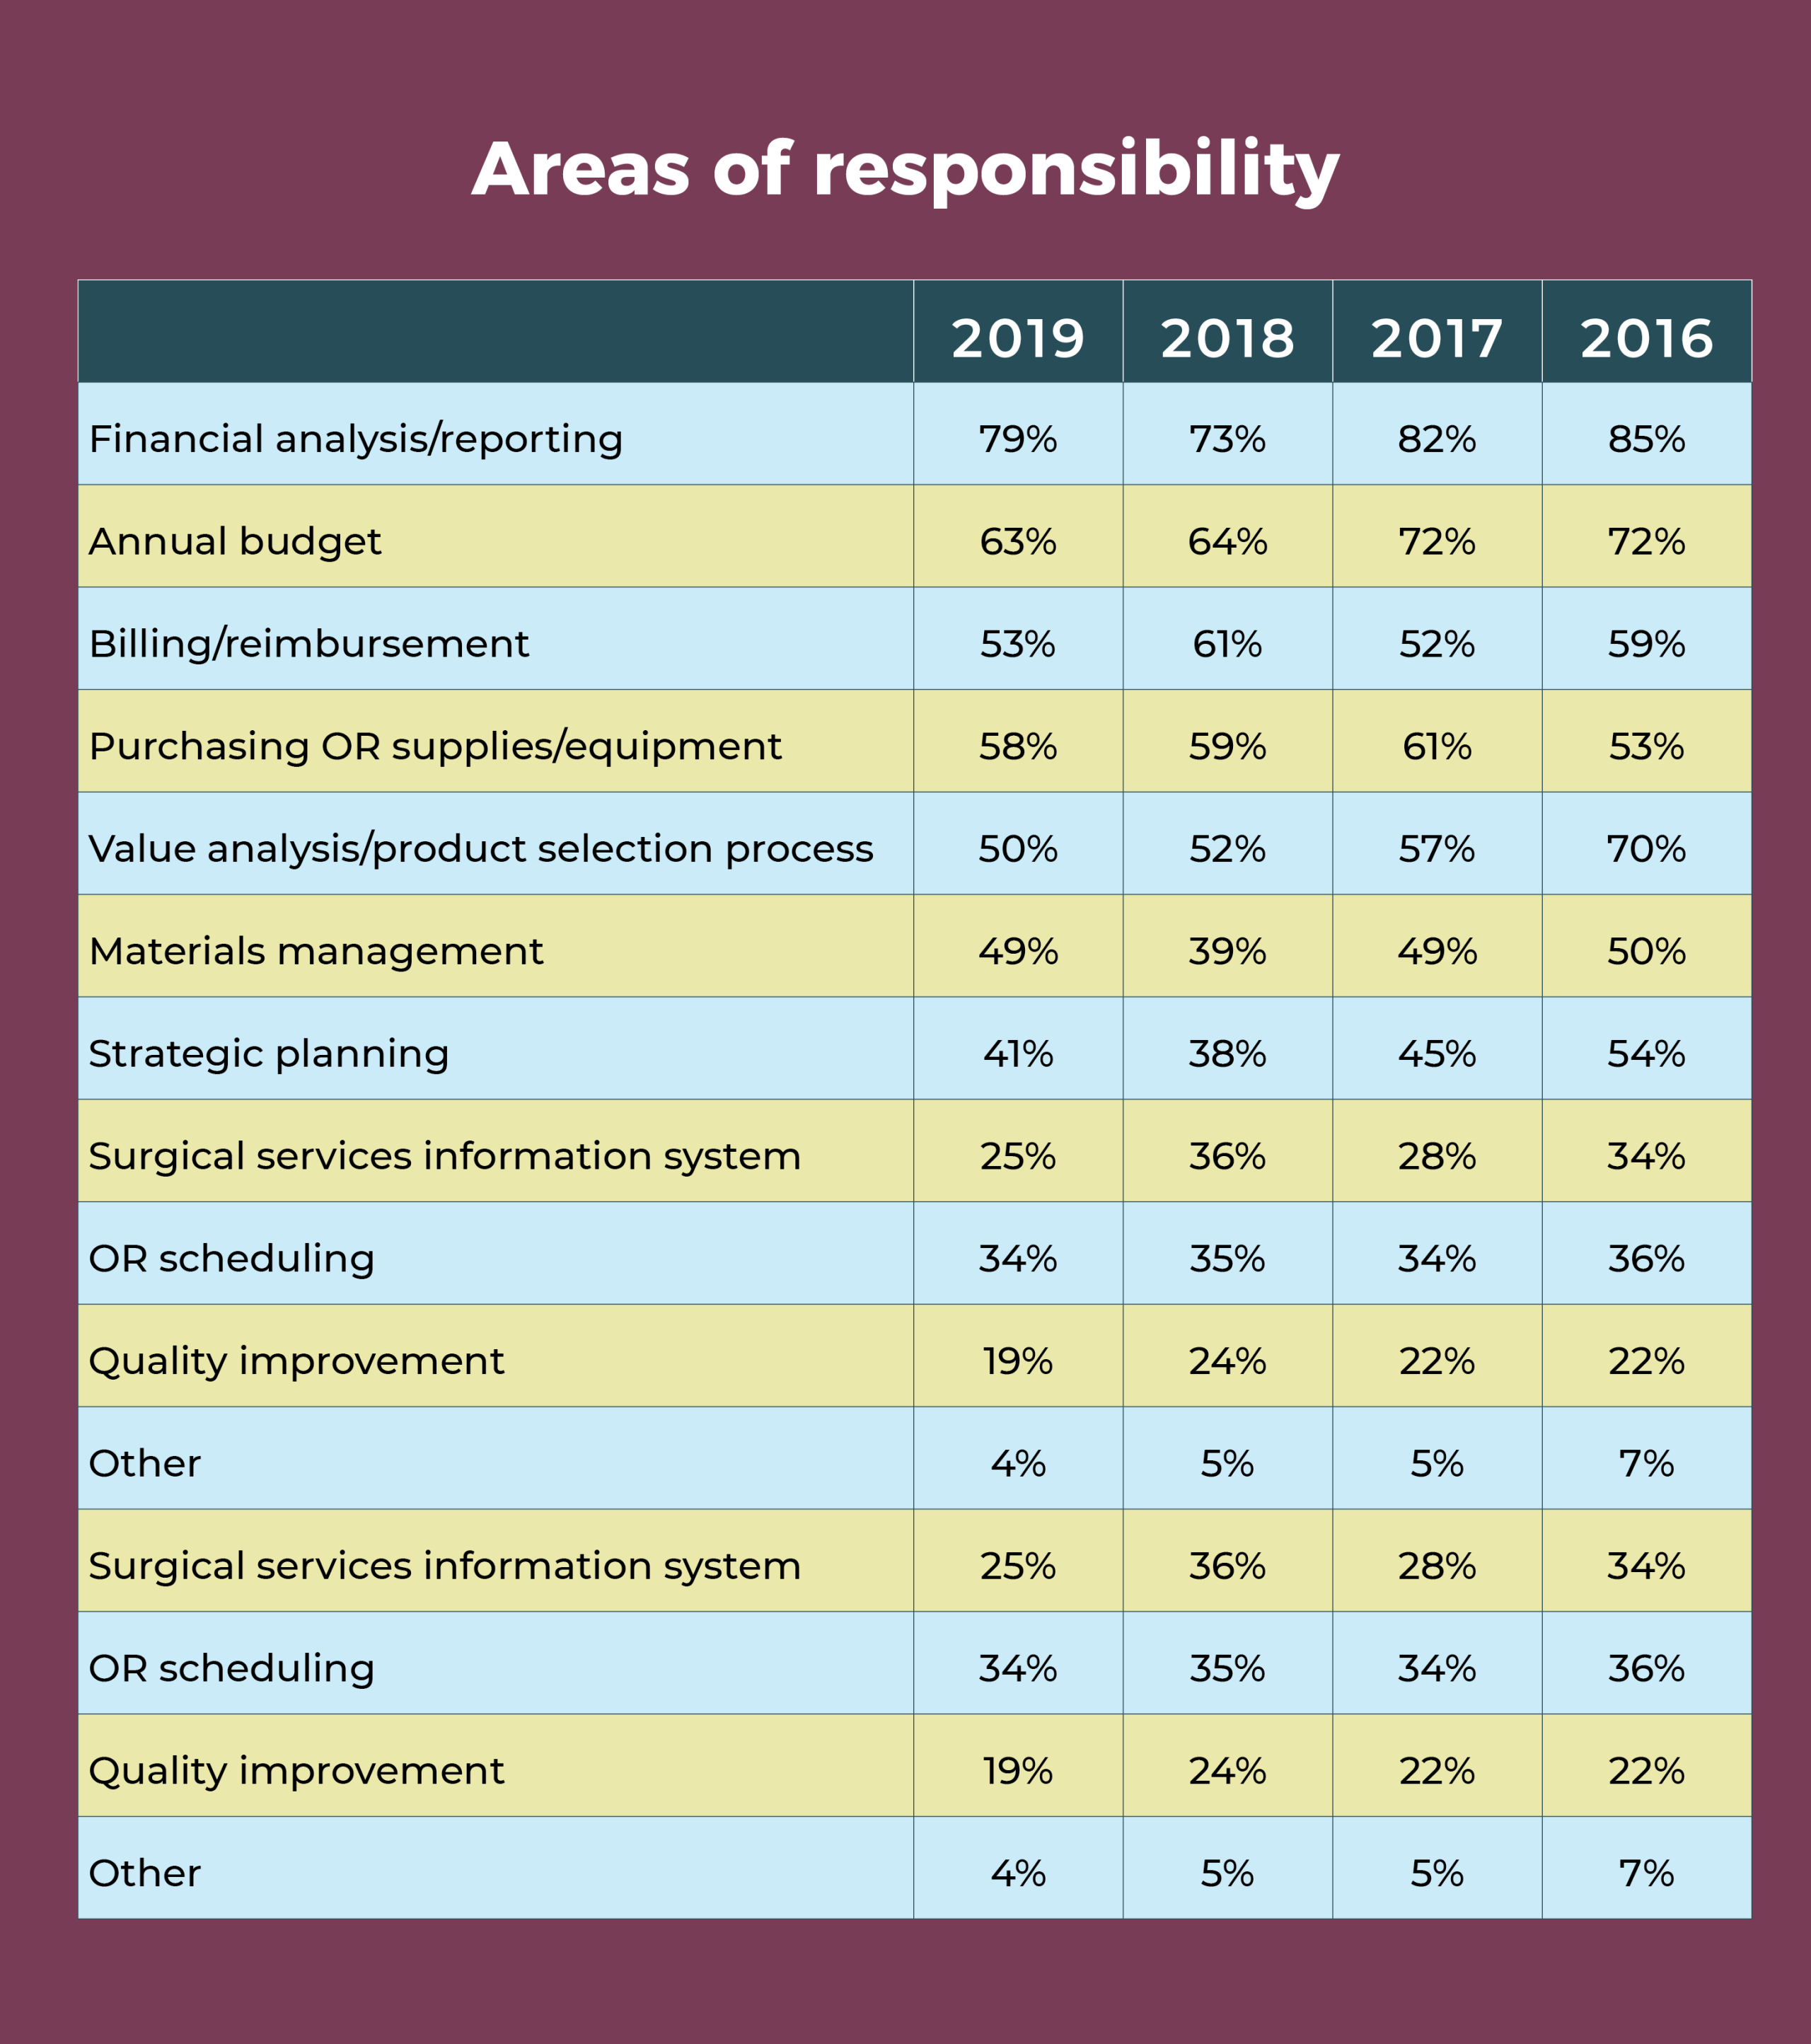
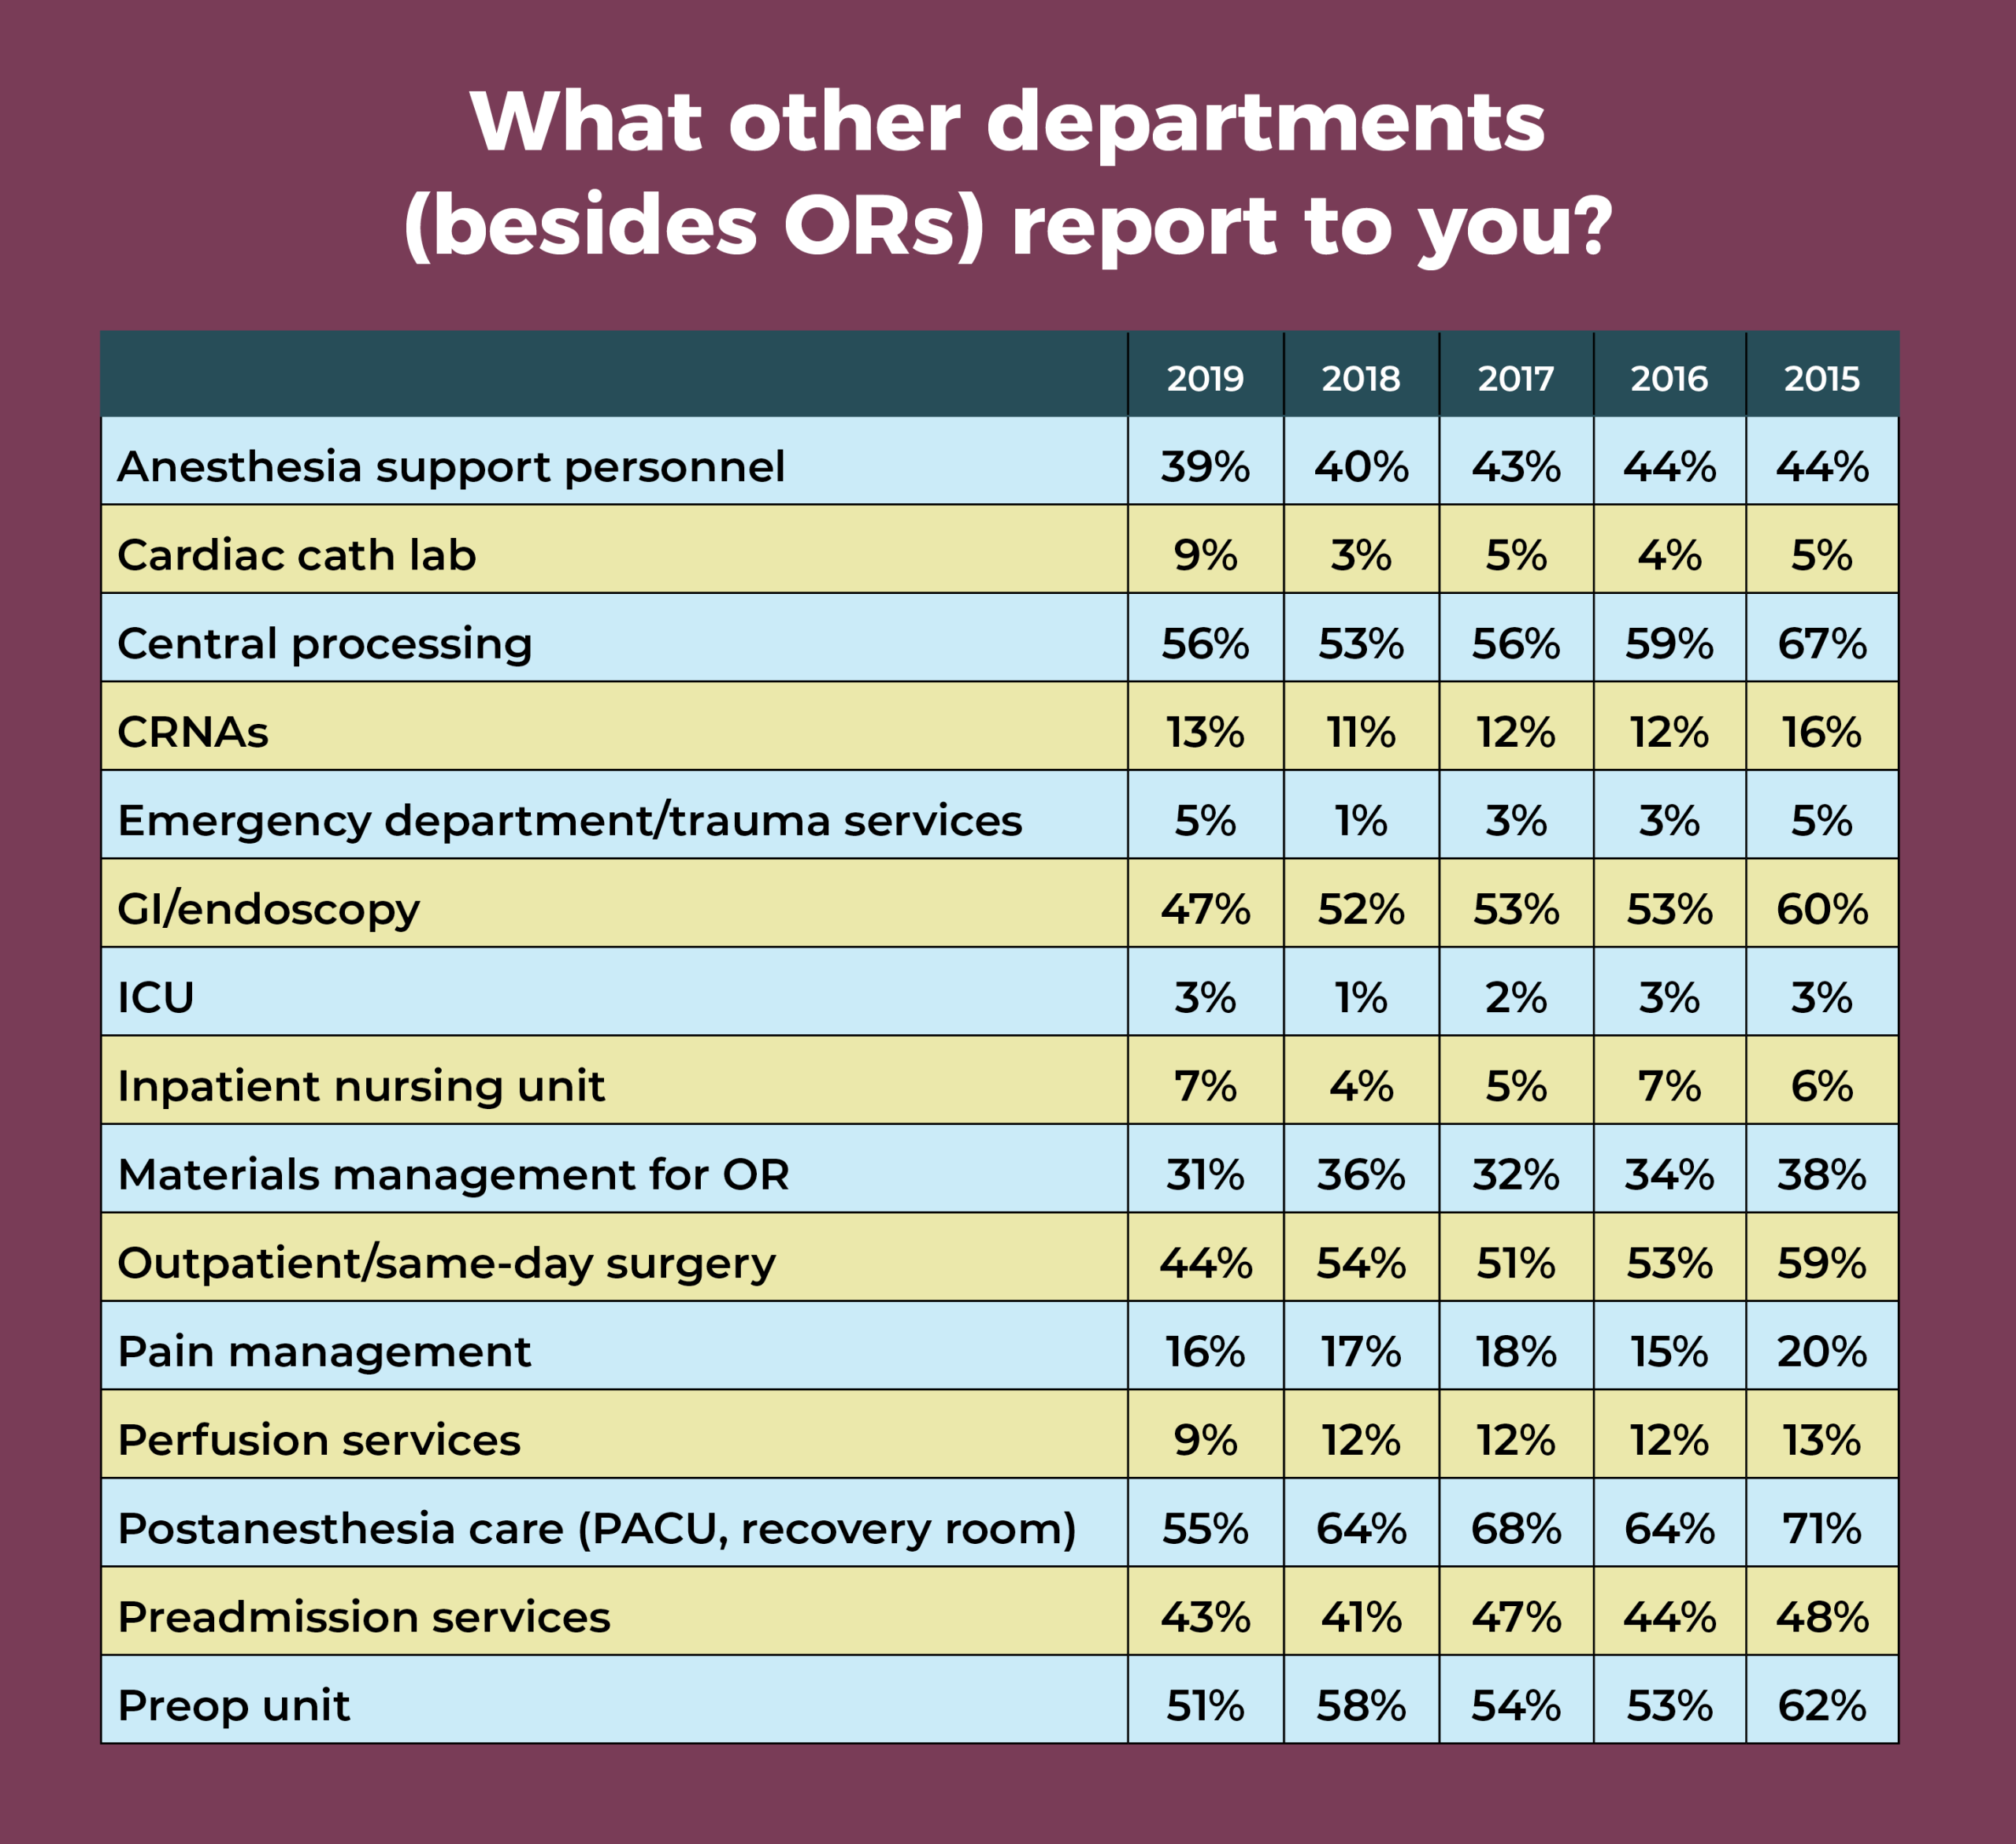
- See the table for trends in areas of responsibility over the last few years and in comparison with 5 years ago. Financial analysis and reporting remains the most commonly cited area of responsibility (79%), followed by the annual budget (63%). Quality improvement is the least cited area of responsibility.

OR manager job satisfaction ranks high despite flat compensation


OR leaders live with many challenges, ranging from obtaining adequate reimbursement to having sufficient staff on hand. Despite constant pressures, most respondents to the 2019 annual OR Manager Salary/Career Survey remain satisfied with their jobs. In all, 70% are satisfied with their current jobs or positions, comparable to the 67% reported in 2018.
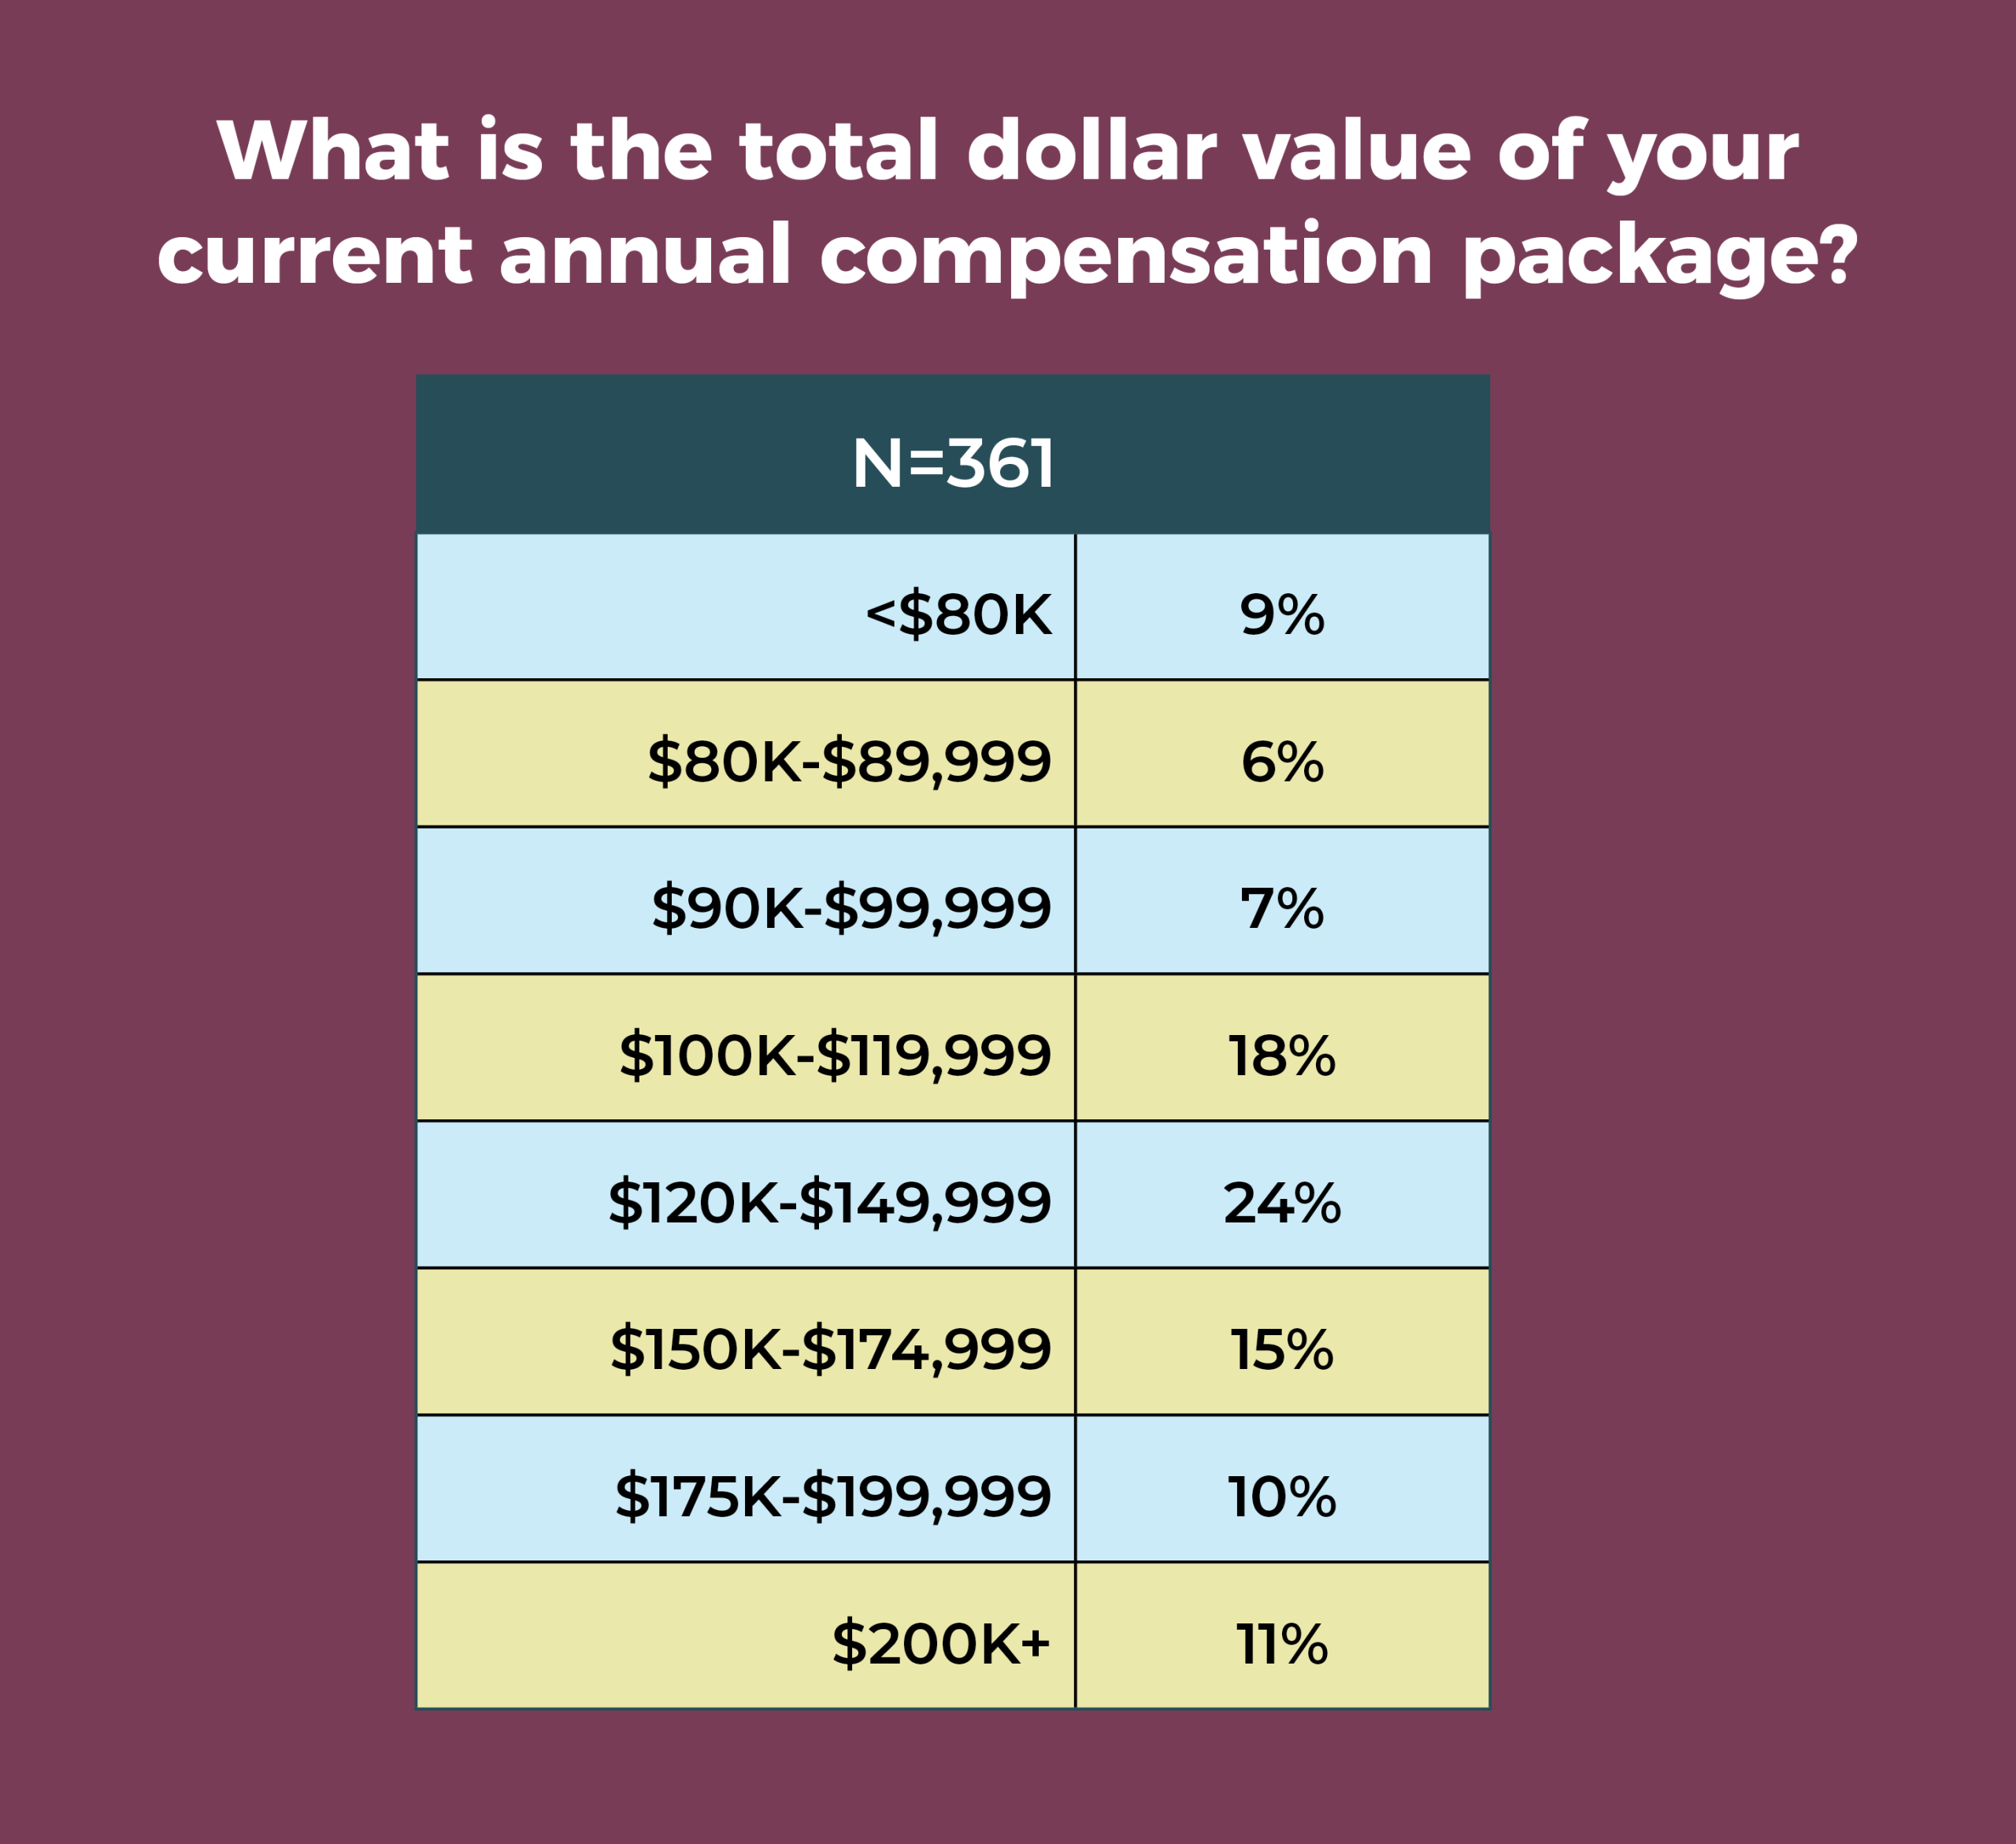
This satisfaction comes despite relatively flat compensation. Fewer than half (46%) earn an annual salary between $100,000 and $149,999, compared to 49% last year and 48% in 2017. More than half (60%) report a total compensation of $120,000 or more, compared to 56% in 2018. Given these figures, it’s not surprising that only slightly more than half (51%) of respondents are satisfied with their total compensation (vs 46% in 2018). A bit of good news is that 70% reported receiving a raise in the past 12 months, with an average increase of 3.06% (higher than the 1.9% consumer price index for 2018), compared with 3.27% last year and 3.07% in 2017.

Other highlights from the 2019 survey include:
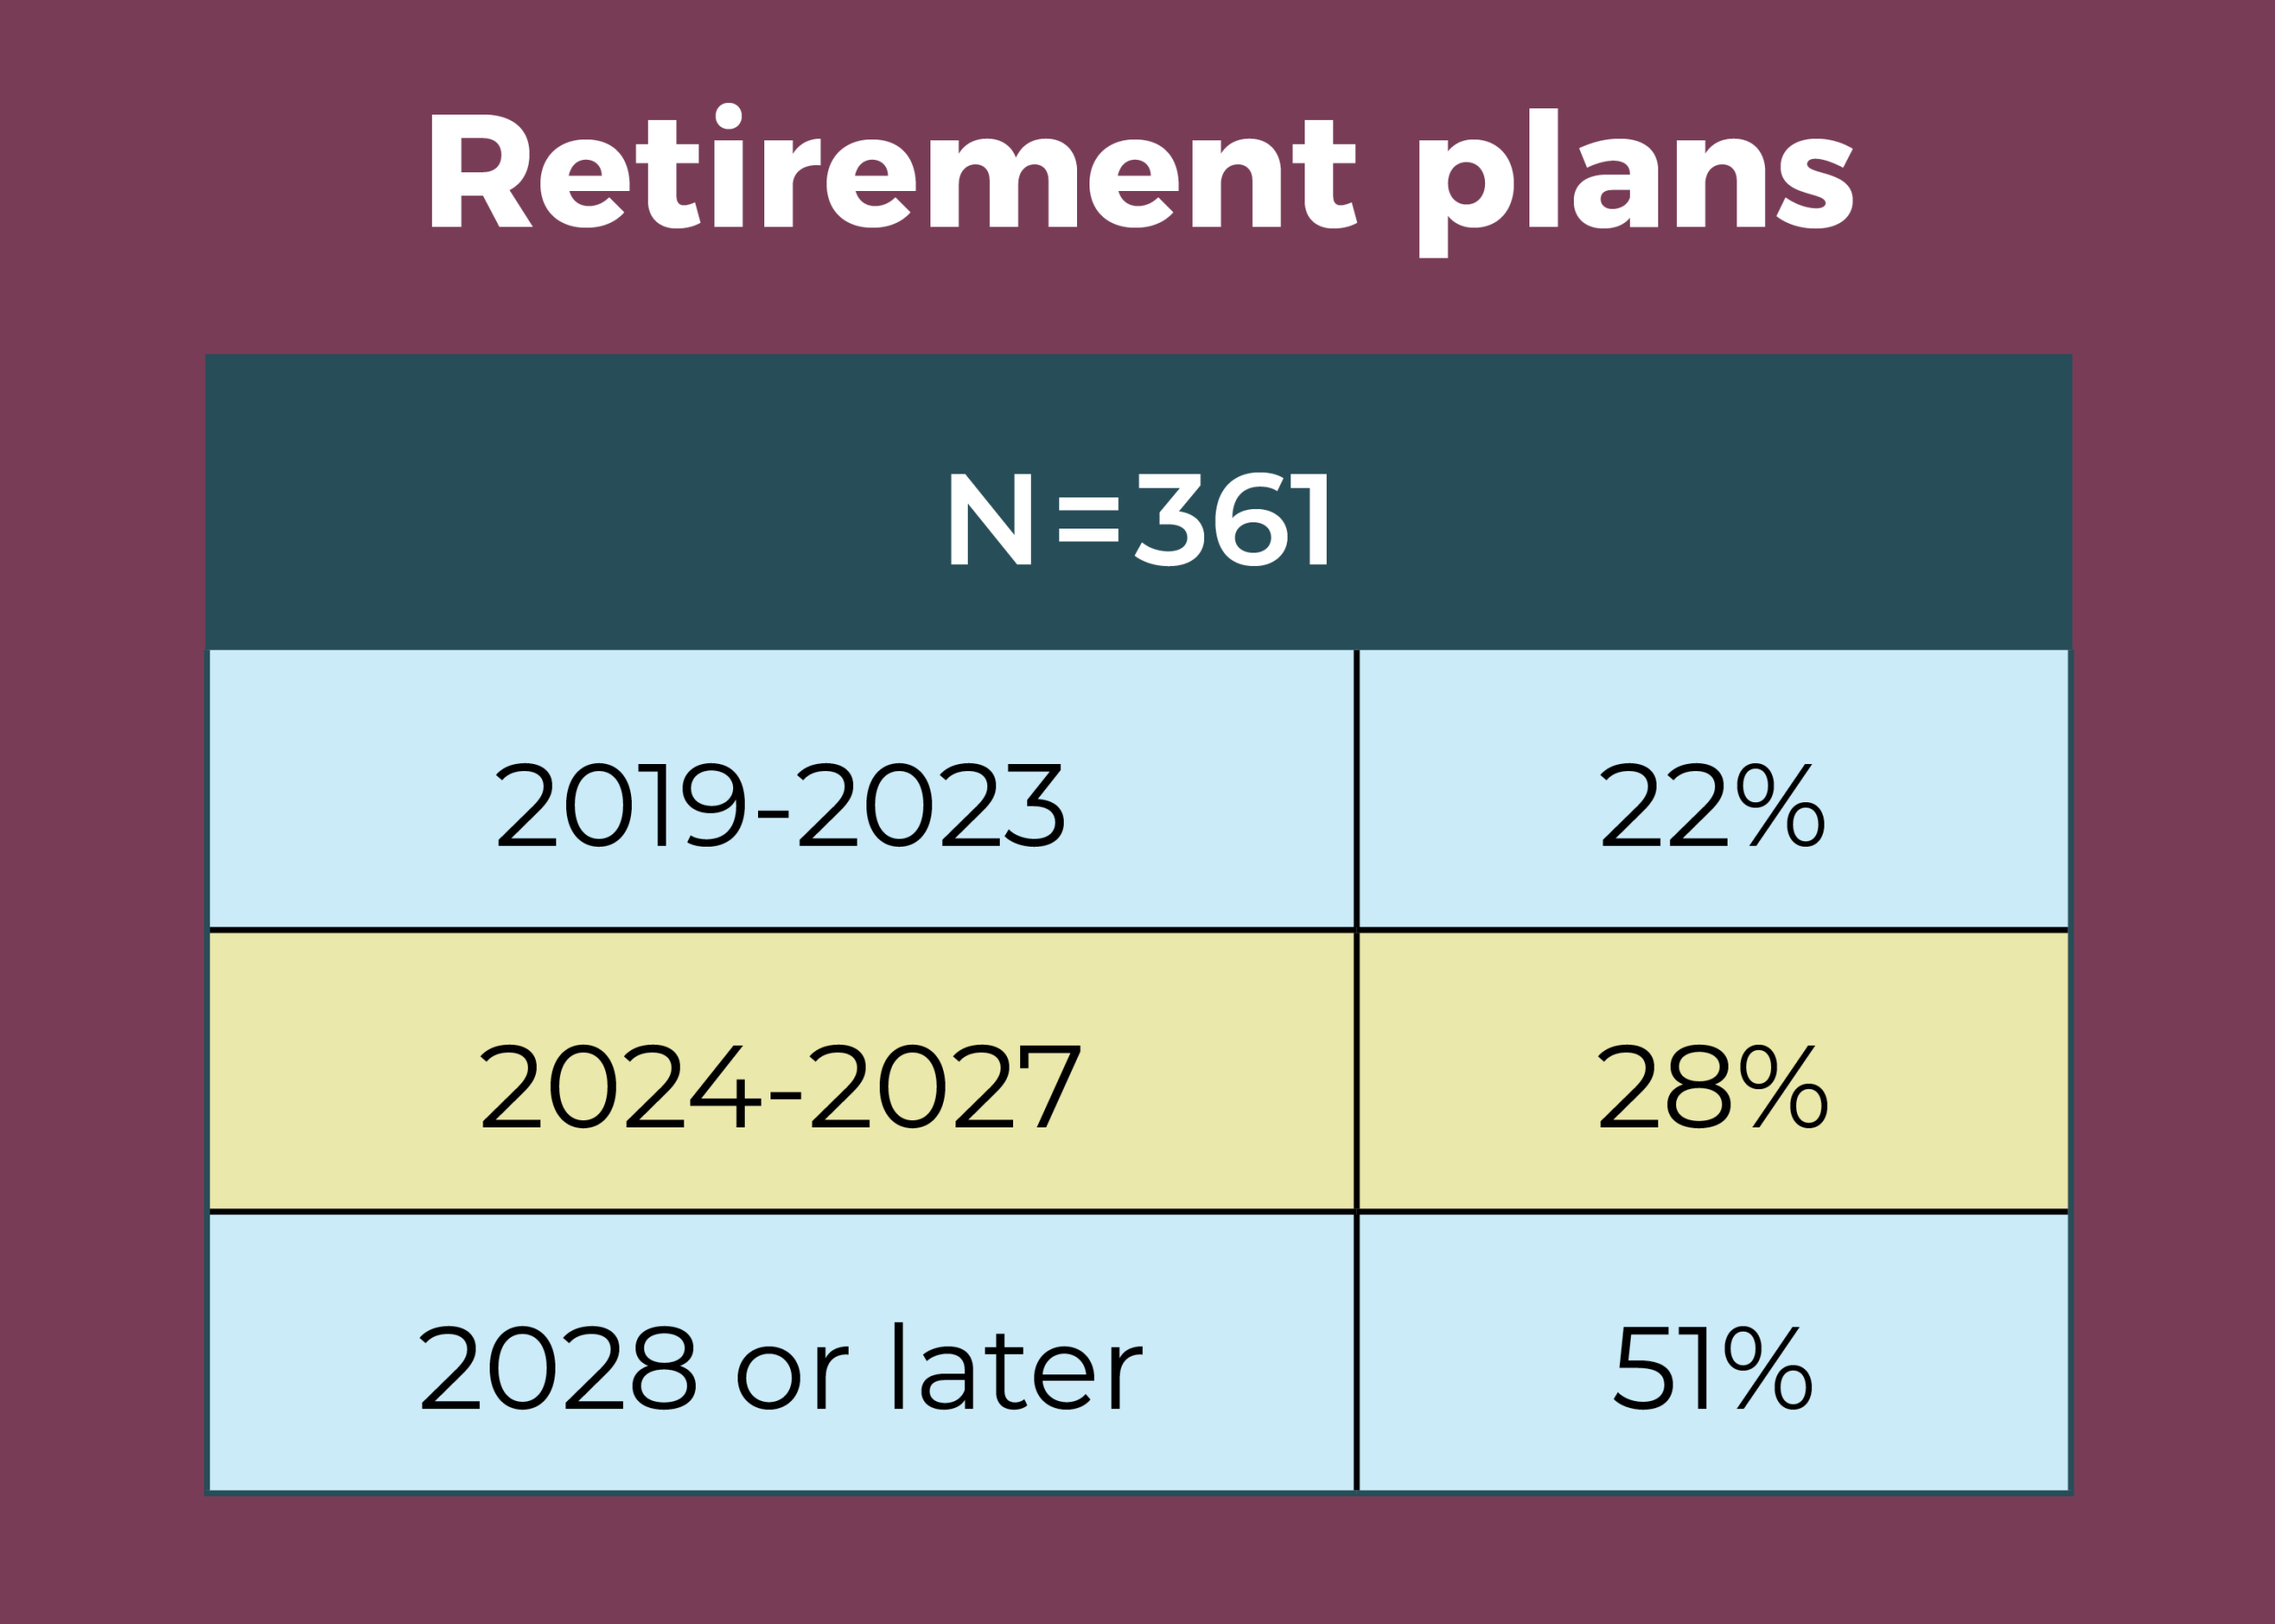
- Half of OR leaders expect to be retired by 2028, with 22% planning retirement by 2023.
- OR leaders supervise an average of 139 full-time equivalent (FTE) employees, the highest in the past 4 years: 88 in 2018; 117 in 2017; 95 in 2016; and 94 in 2015.
- Nearly two-thirds (64%) of respondents manage an annual operating budget in the $2.5 million to $49.9 million range, up slightly from 59% in 2018.
- The percentage of those identifying themselves as male was 22%, up from previous years (15% in 2018 and 2016; 14% in 2017).

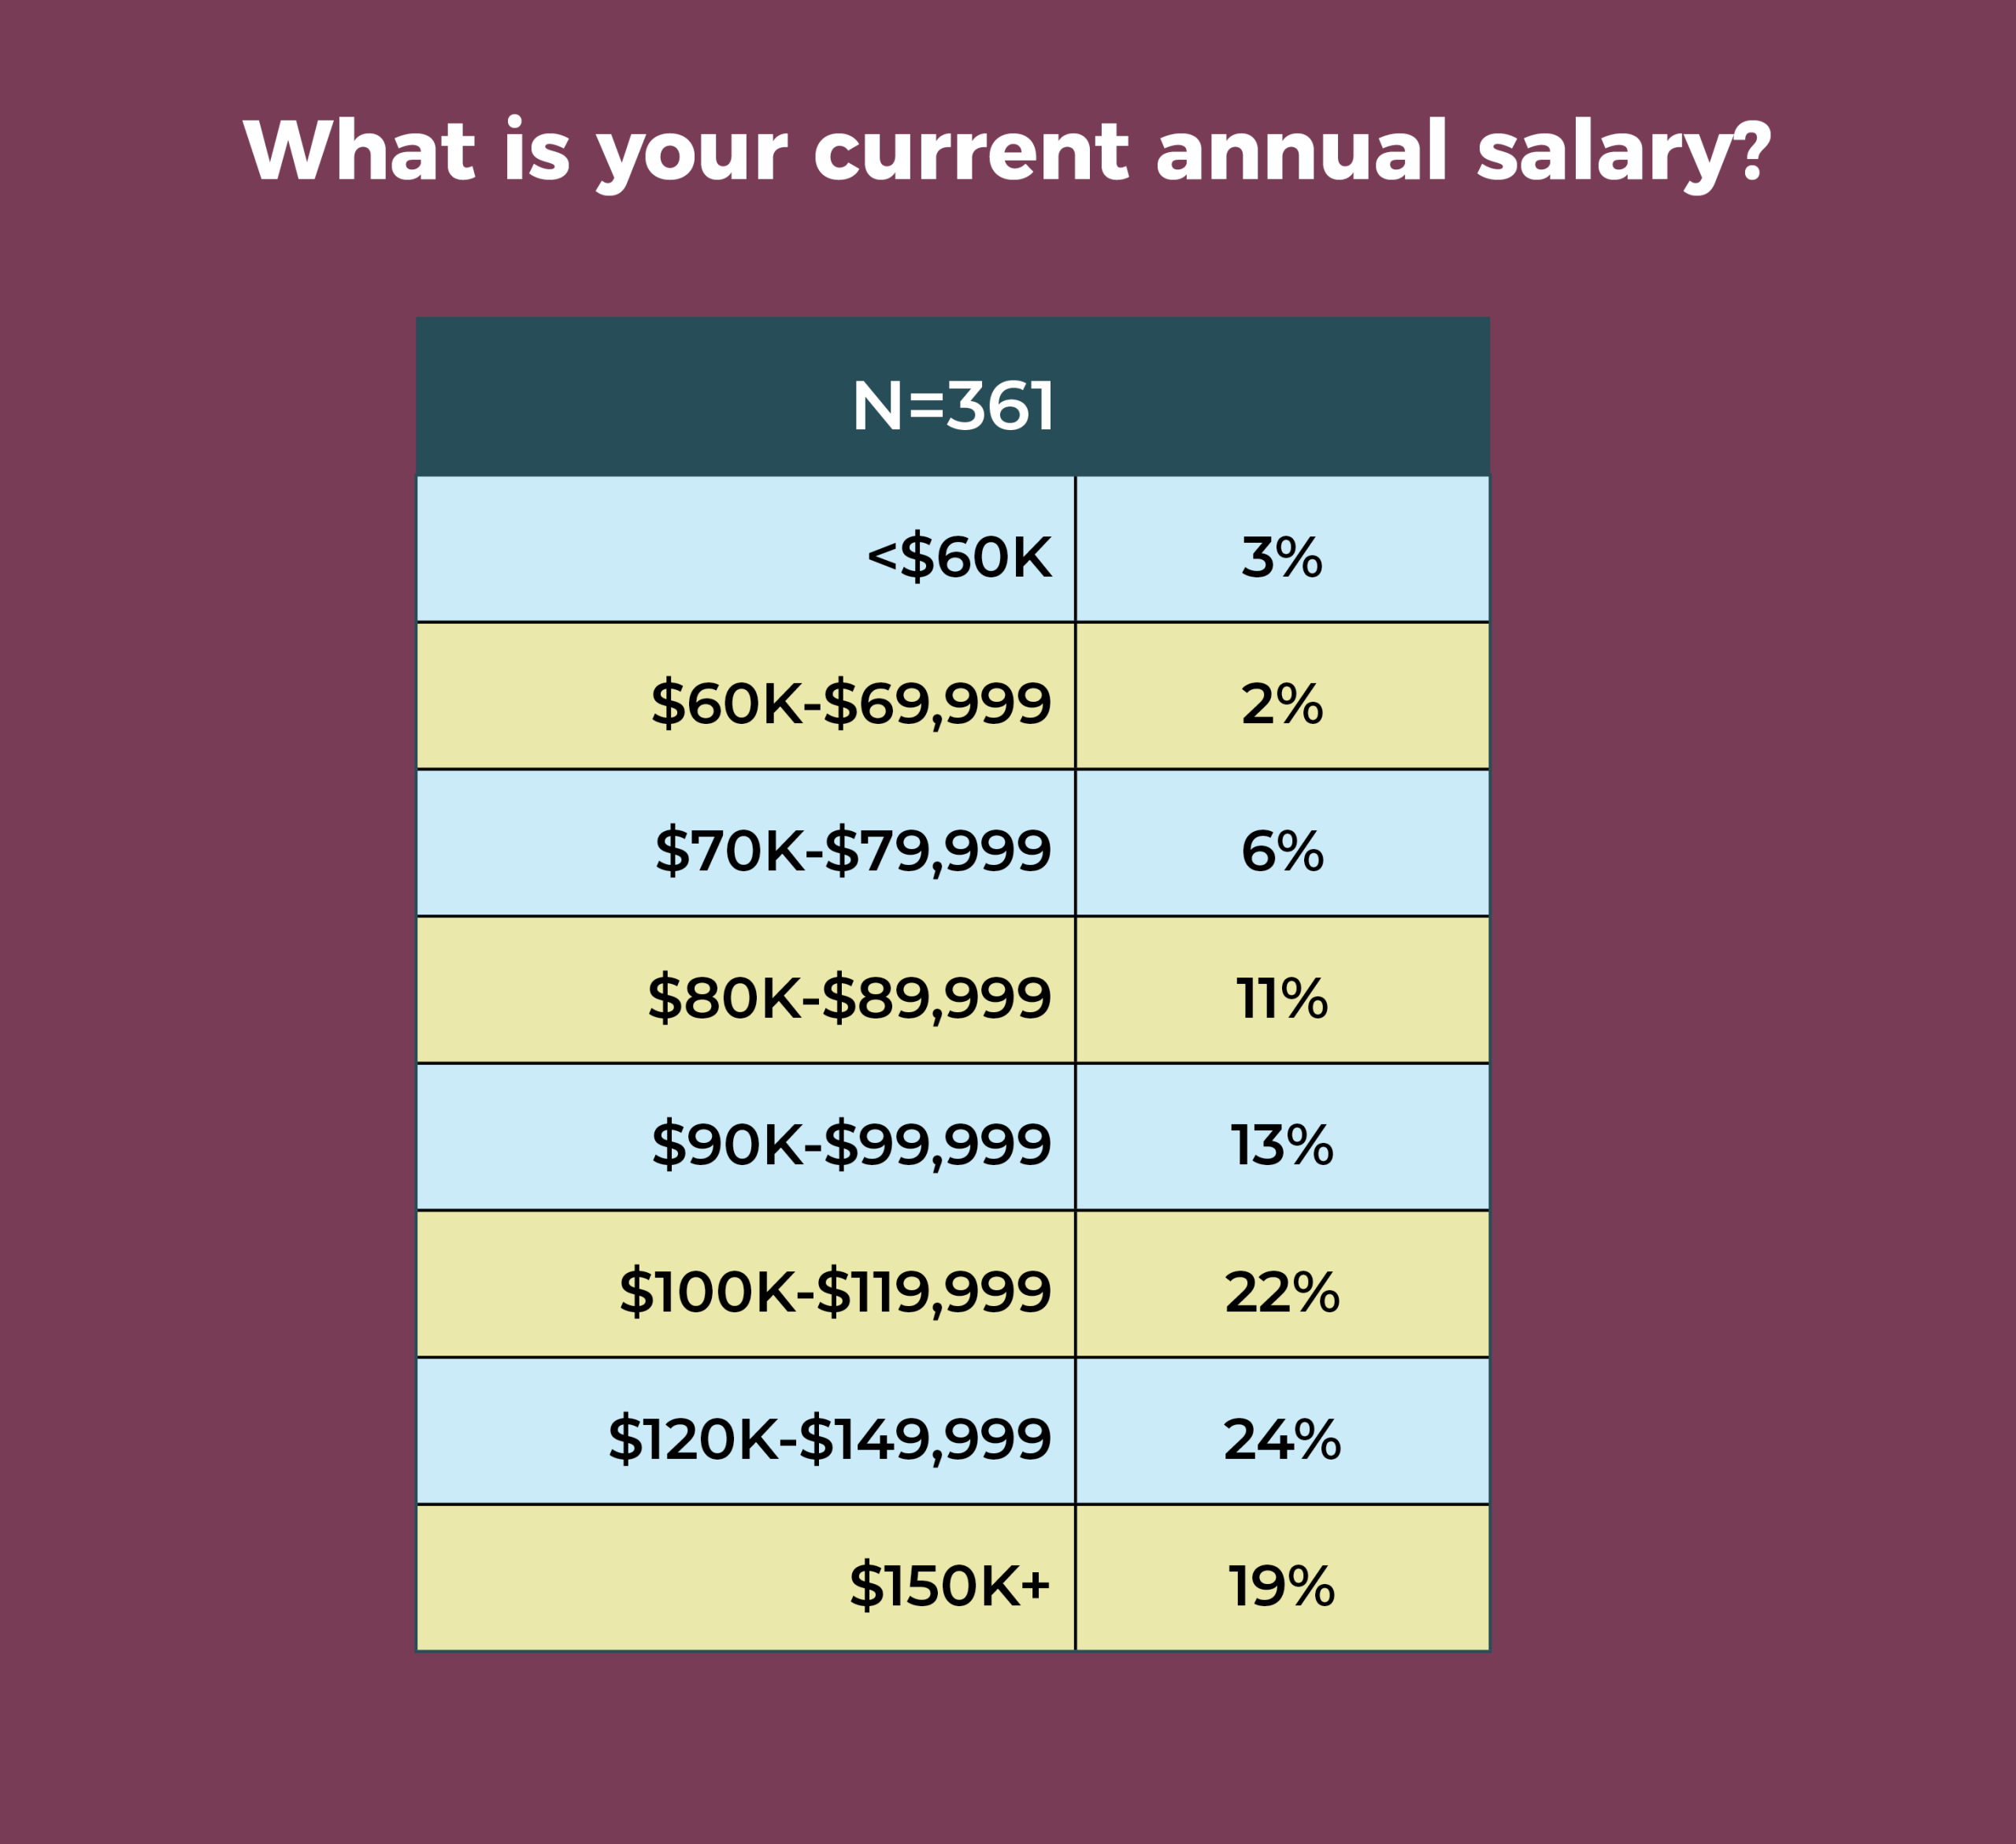
About two-thirds (65%) of OR leaders earn an annual salary of $100,000 or more, continuing a pattern seen over the past 3 years (66% in 2018; 69% in 2017; and 66% in 2016).
The most frequently reported total compensation range was $120,000 to $149,999 (24%), followed by $100,000 to $119,999 (18%). Only 11% earn $200,000 or more, and only 9% earn less than $80,000.

OR leaders who responded to the survey supervise an average of 102 clinical and 42 nonclinical employees and oversee an average of 14 ORs, up slightly from 11 in 2018, but the same as 2017. The most common job titles are director (37%) and nurse manager (30%), with 14% of respondents reporting their title as administrator/administrative director.
Departments that OR leaders most commonly oversee in addition to the OR are central sterile processing (56%), postanesthesia care unit (PACU, 55%), preoperative area (51%), outpatient/same-day surgery (44%), GI/endoscopy (47%), preadmission services (43%), and anesthesia support personnel (39%). Since 2015, the percentages for those supervising outpatient/same day surgery, GI/endoscopy, PACU, and materials management for the OR have declined fairly steadily.
Only 16% of OR leaders manage an annual operating budget of less than $2.5 million, down from 26% last year, and only 10% manage an annual operating budget of $75 million or more, up slightly from 7% in 2018. Most respondents (21%) oversee an operating budget of $10.0 million to $24.9 million.
As was the case in 2018, responses to the question about responsibility for the annual capital budget were fairly evenly divided among all categories, with the highest percentage (22%) managing a budget between $2.0 million and $4.9 million. In all, 16% manage a capital budget of less than $250,000, the same as last year, and slightly more than half (52%) manage a capital budget of $1.0 million or more a year.

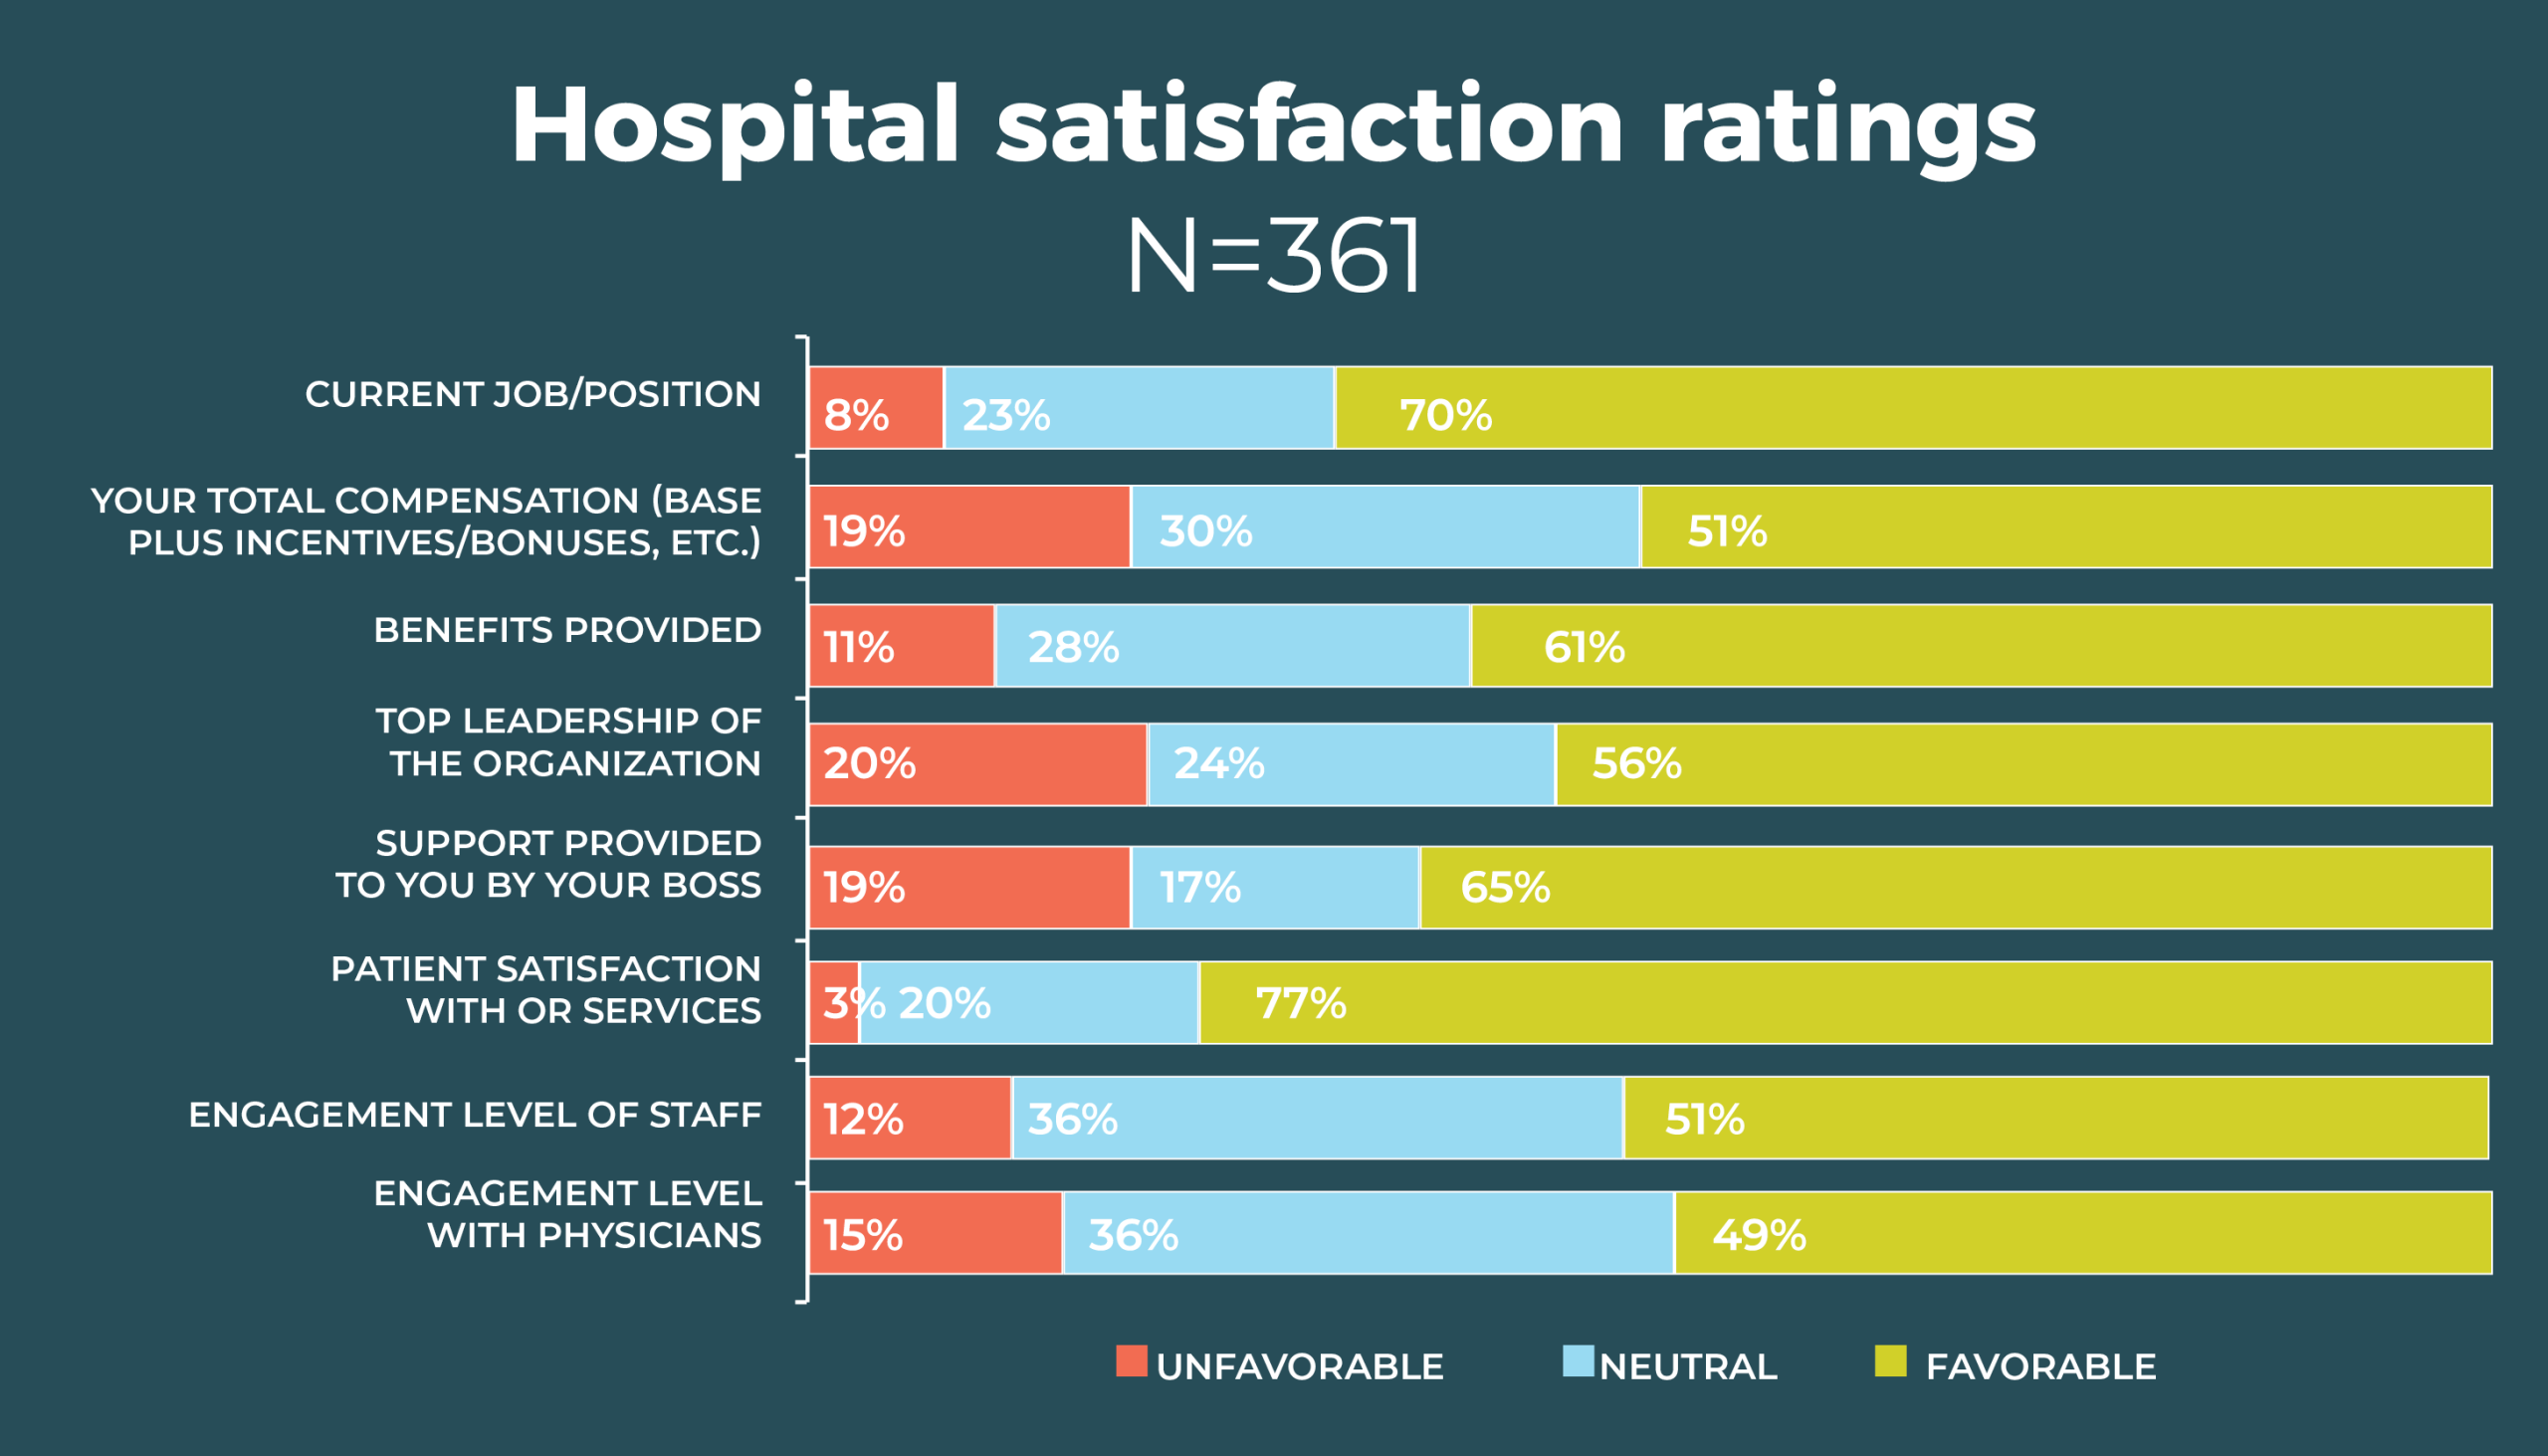

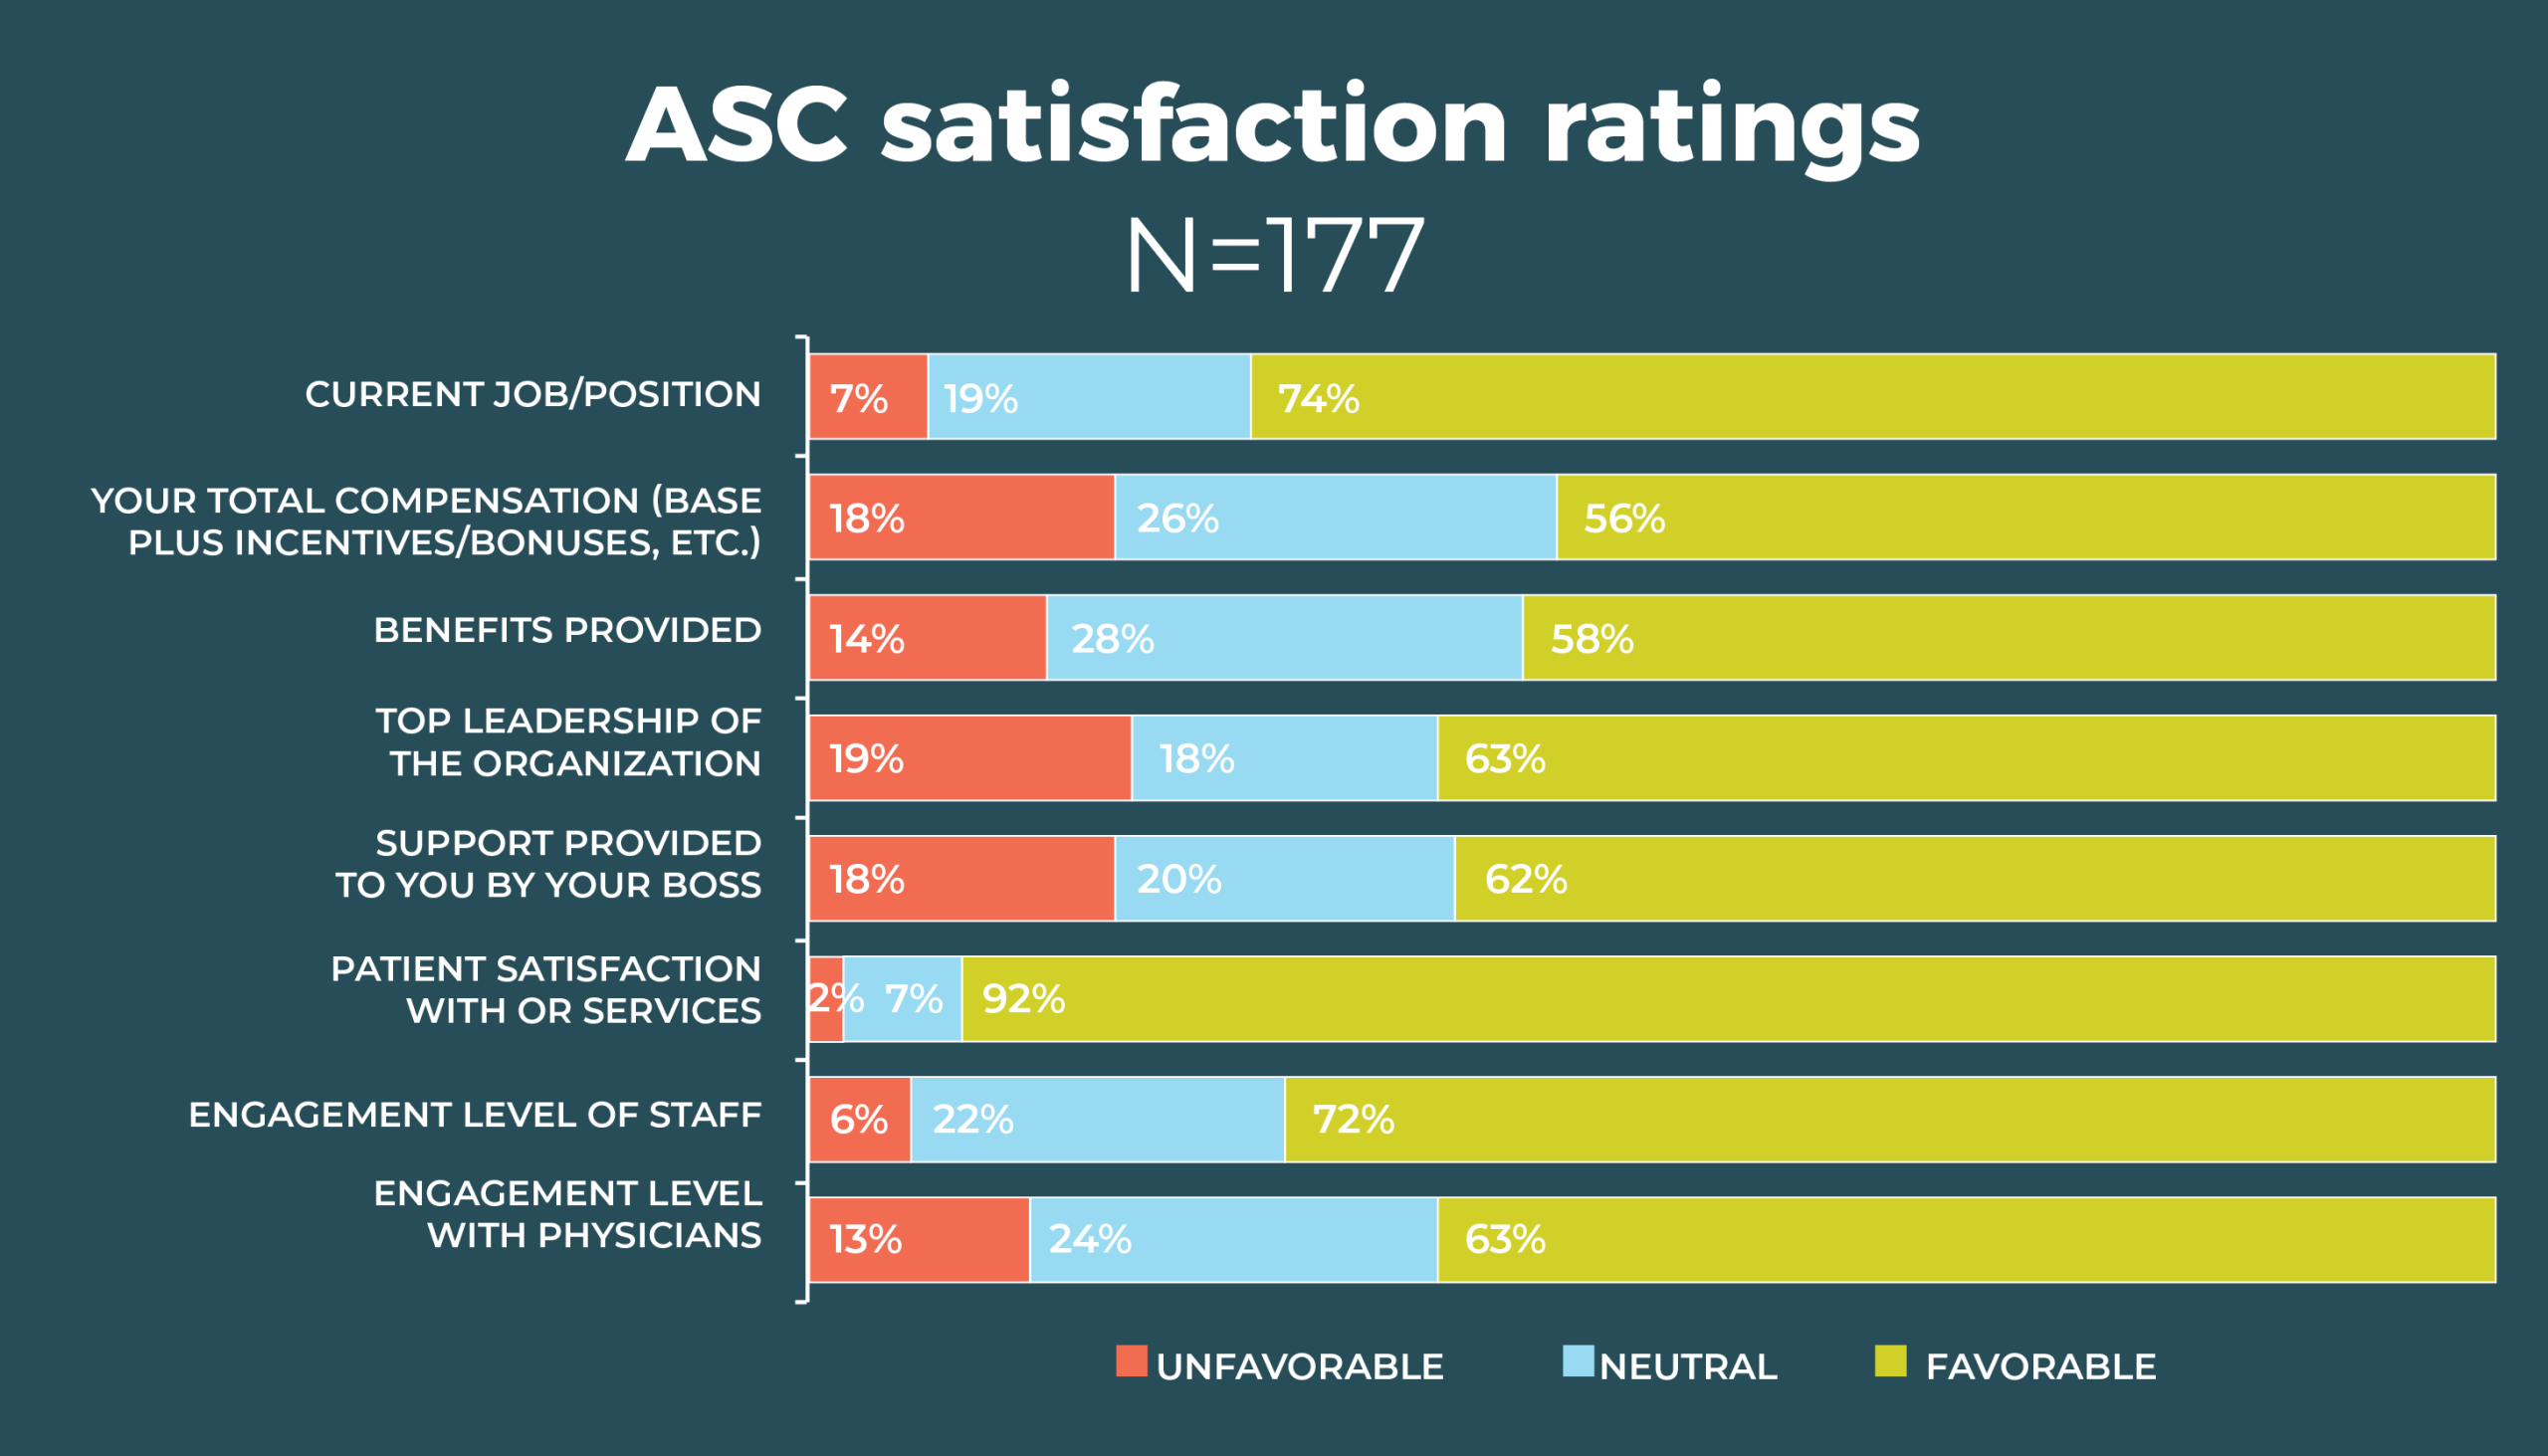
Patient satisfaction with OR services dropped from 82% in 2018 to 77% this year, with only 58% of OR leaders reporting they were completely satisfied. Other dips in satisfaction included staff engagement level (51% this year vs 57% in 2018) and benefits (61% vs 63%).
On the other hand, respondents were more satisfied this year with top leadership (56% vs 49%) and the support provided by their bosses (65% vs 62%). Satisfaction with physician engagement remained about the same (49% vs 50%), with only 10% reporting complete satisfaction.

Satisfaction depends partly on the number of concerns an OR leader has to contend with. Staffing was the chief response to the question, What is the one thing about your job that keeps you up at night? A total of 44% of respondents cited this as a concern, with problems ranging from not having enough people to how those people behave on the job. Sample comments include:
- “Being able to recruit the appropriate educated staff and being competitive so that they stay and do not use my department as a stepping stone.”
- “Experienced OR staff is nonexistent, and we are finding that new nurses are not even remotely interested in a job with a call commitment.”
- “Having a pipeline of perioperative nurses and nurses who are willing to go into leadership.”
- “I am often the backup plan for staffing, and this can be a challenge to juggle.”
The second most frequent response to this question fell into a category of regulatory and safety issues, mentioned by 13% of respondents. Other responses could be classified into the categories of financial (eg, budgets, reimbursement), management (lack of support from organization leaders), and job overload (feeling overwhelmed and not having enough time to complete tasks). Comments from these areas include:
- “Getting everything done. So many irons in the fire I fear something is going without attention.”
- “The one thing about my job that keeps me up at night is thoughts on how to develop surgical services as a whole, how to bring business through the front door, how to recruit physicians, and how to keep costs low.”
- “I fear this community hospital will cease to exist in a year due to poor payer mix and terrible reimbursement from Medicare/Medicaid.”
But several respondents said they do not worry when not at work, with one noting, “I have learned to detach when I leave here.”
The survey also asked respondents to name their most important resource for becoming a better leader. Items high on the wish list include more education, qualified staff, time, and support from management. Comments include:
- “Analytics would support the department’s efforts in having real-time information that accurately reflects the operations of the unit in real time. This is crucial in communicating information to physicians, specifically in having a case for an argument to state individual physician performance over time.”
- “The most important resource needed to be a better leader is the actual resources to promote leading. The majority of my time is spent solving problems related to marketing, reimbursement, and the supply chain.”

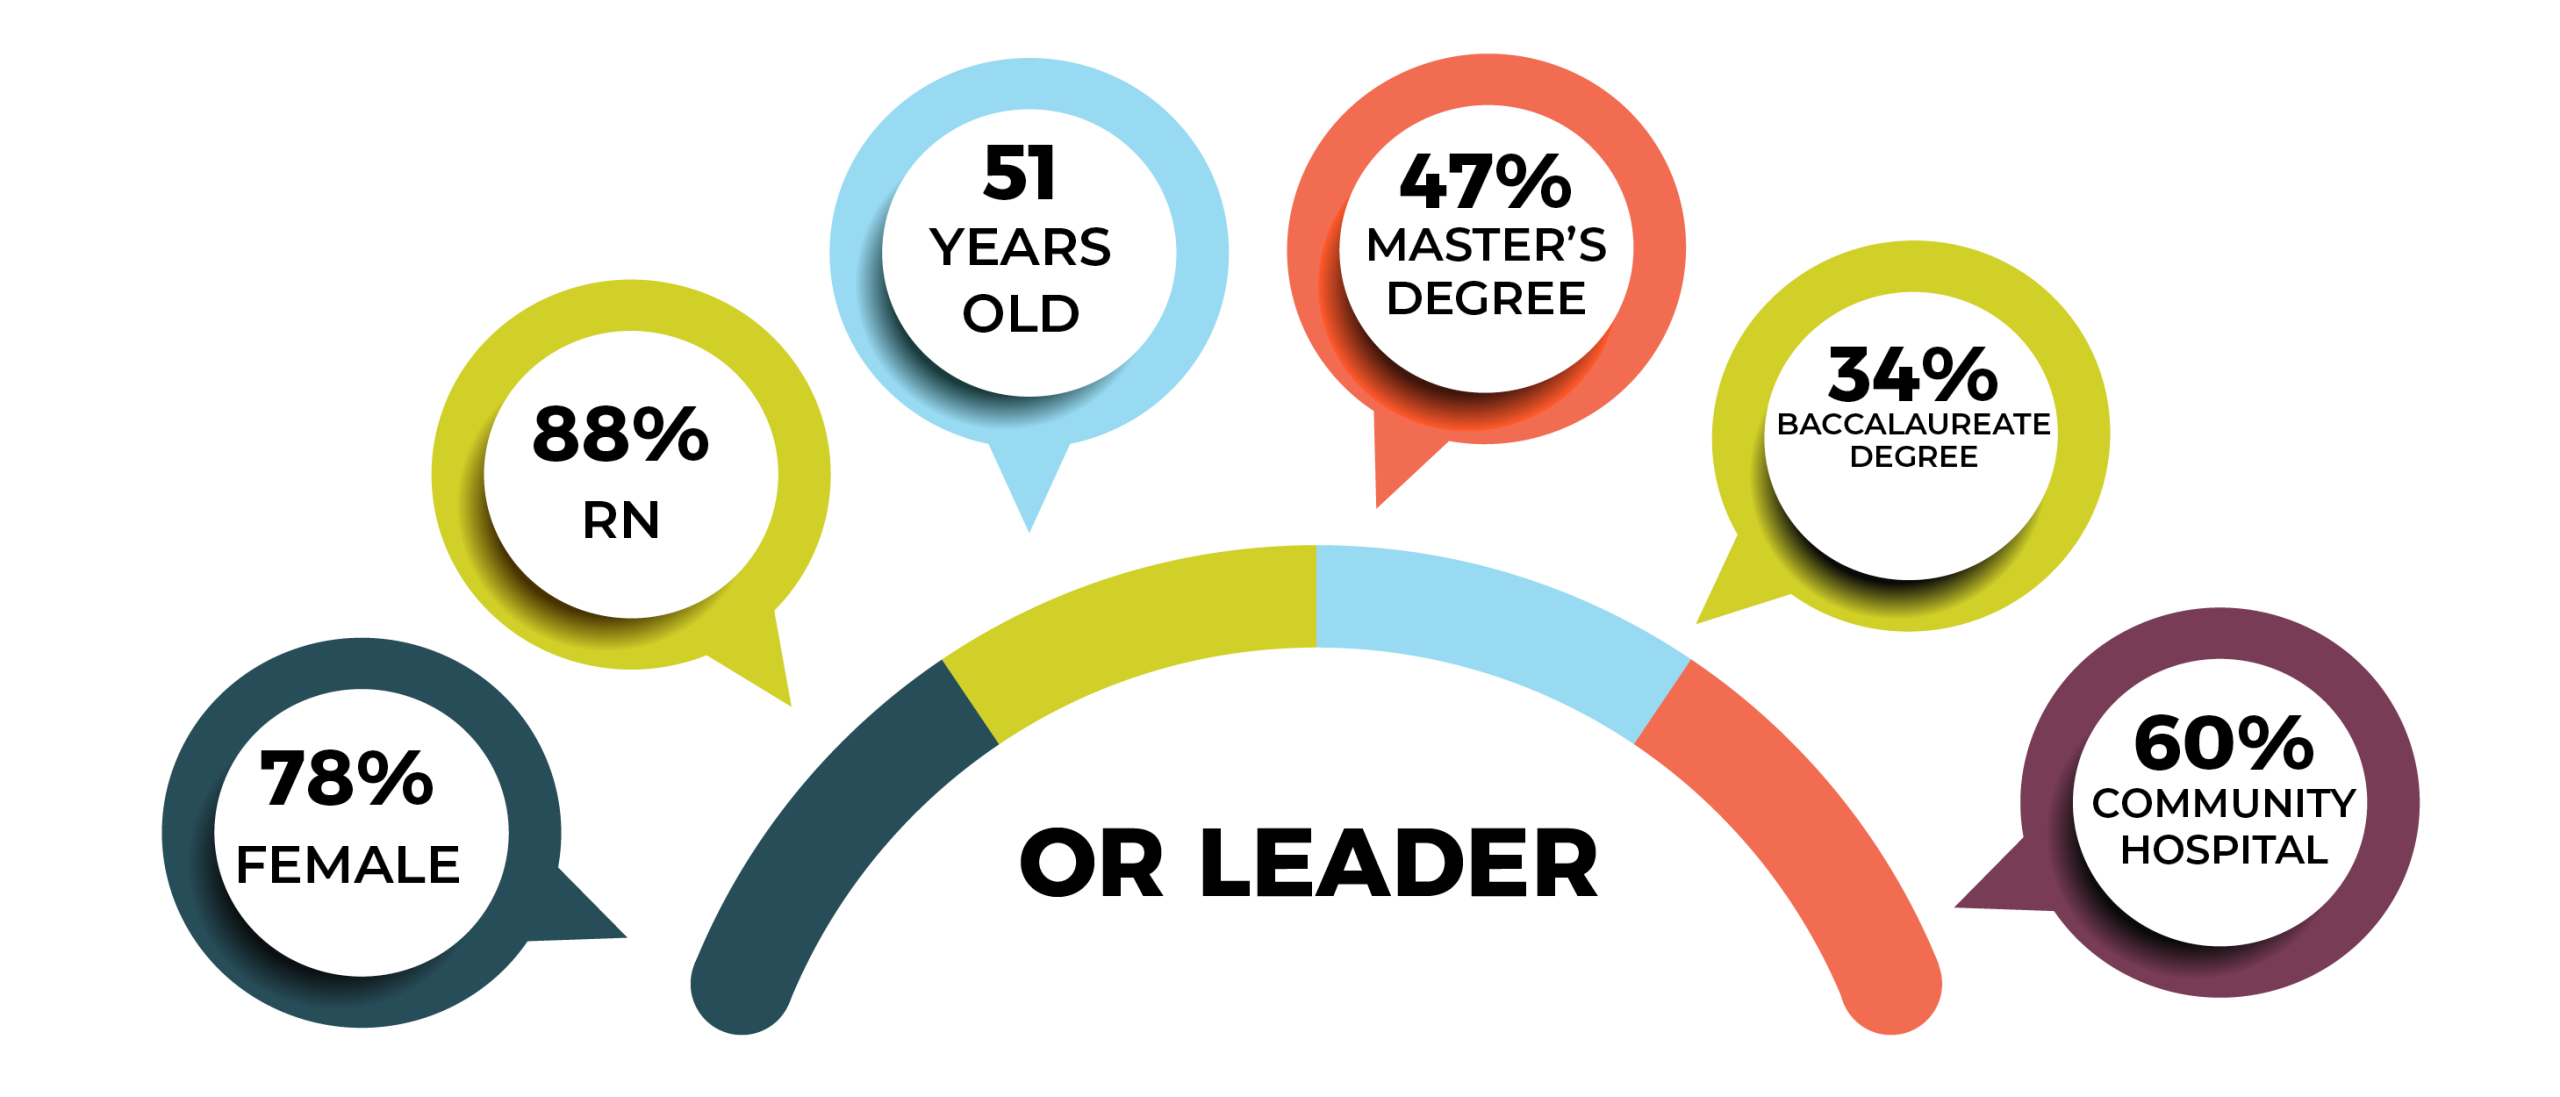
Overall demographics are listed in the infographic. The average age of the OR leaders who responded to the survey is 51, similar to the average age of 53 for nurses overall, according to the 2017 National Nursing Workforce Survey.
Nearly half (47%) of OR leaders have a master’s degree as their highest level of education, up from 40% last year and the same as in 2014. Most of those with master’s degrees are in nursing (30%) rather than business (10%) or another area (7%).
About a third (34%) earned a bachelor’s degree as their highest level of education. The number of respondents who have a doctorate ticked upward from 6 to 17 but remains a low percentage (5%). Only 10% list diploma or an associate degree in nursing as their highest education level.
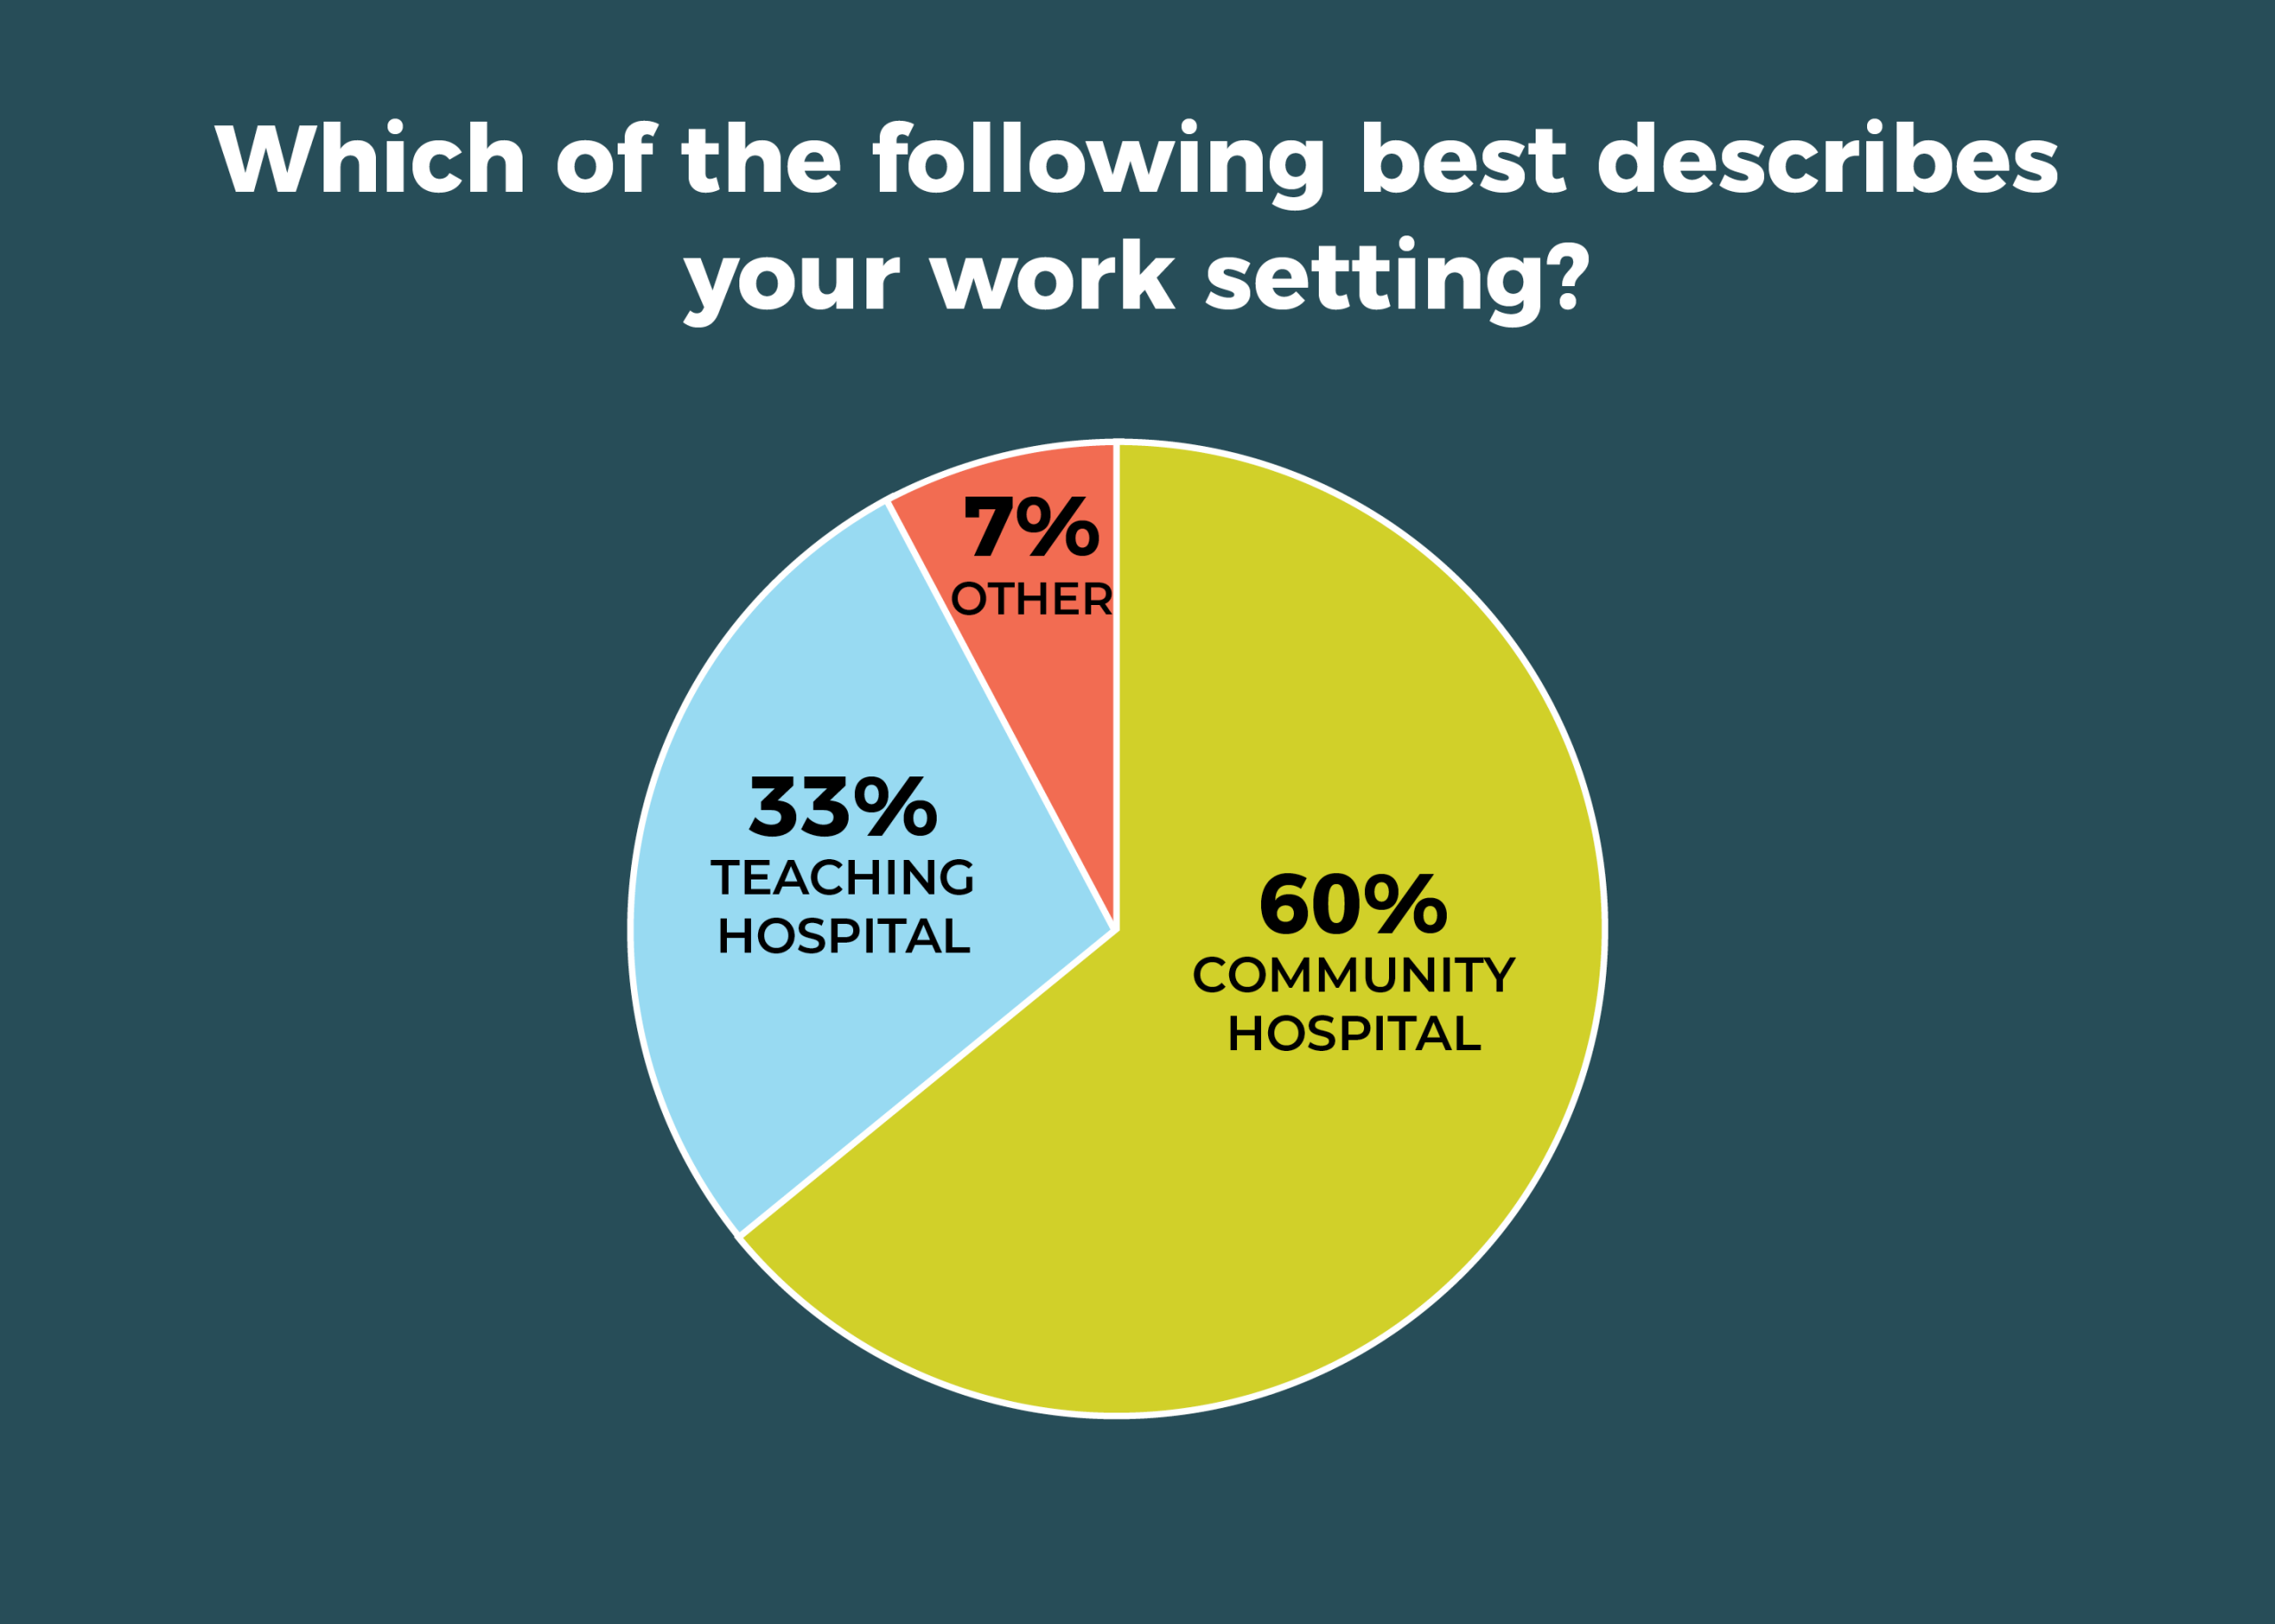
As in previous years, most respondents (60%) work in a community hospital; a third call a teaching hospital their work home.

Survey finds staffing gap has widened at ASCs since 2018


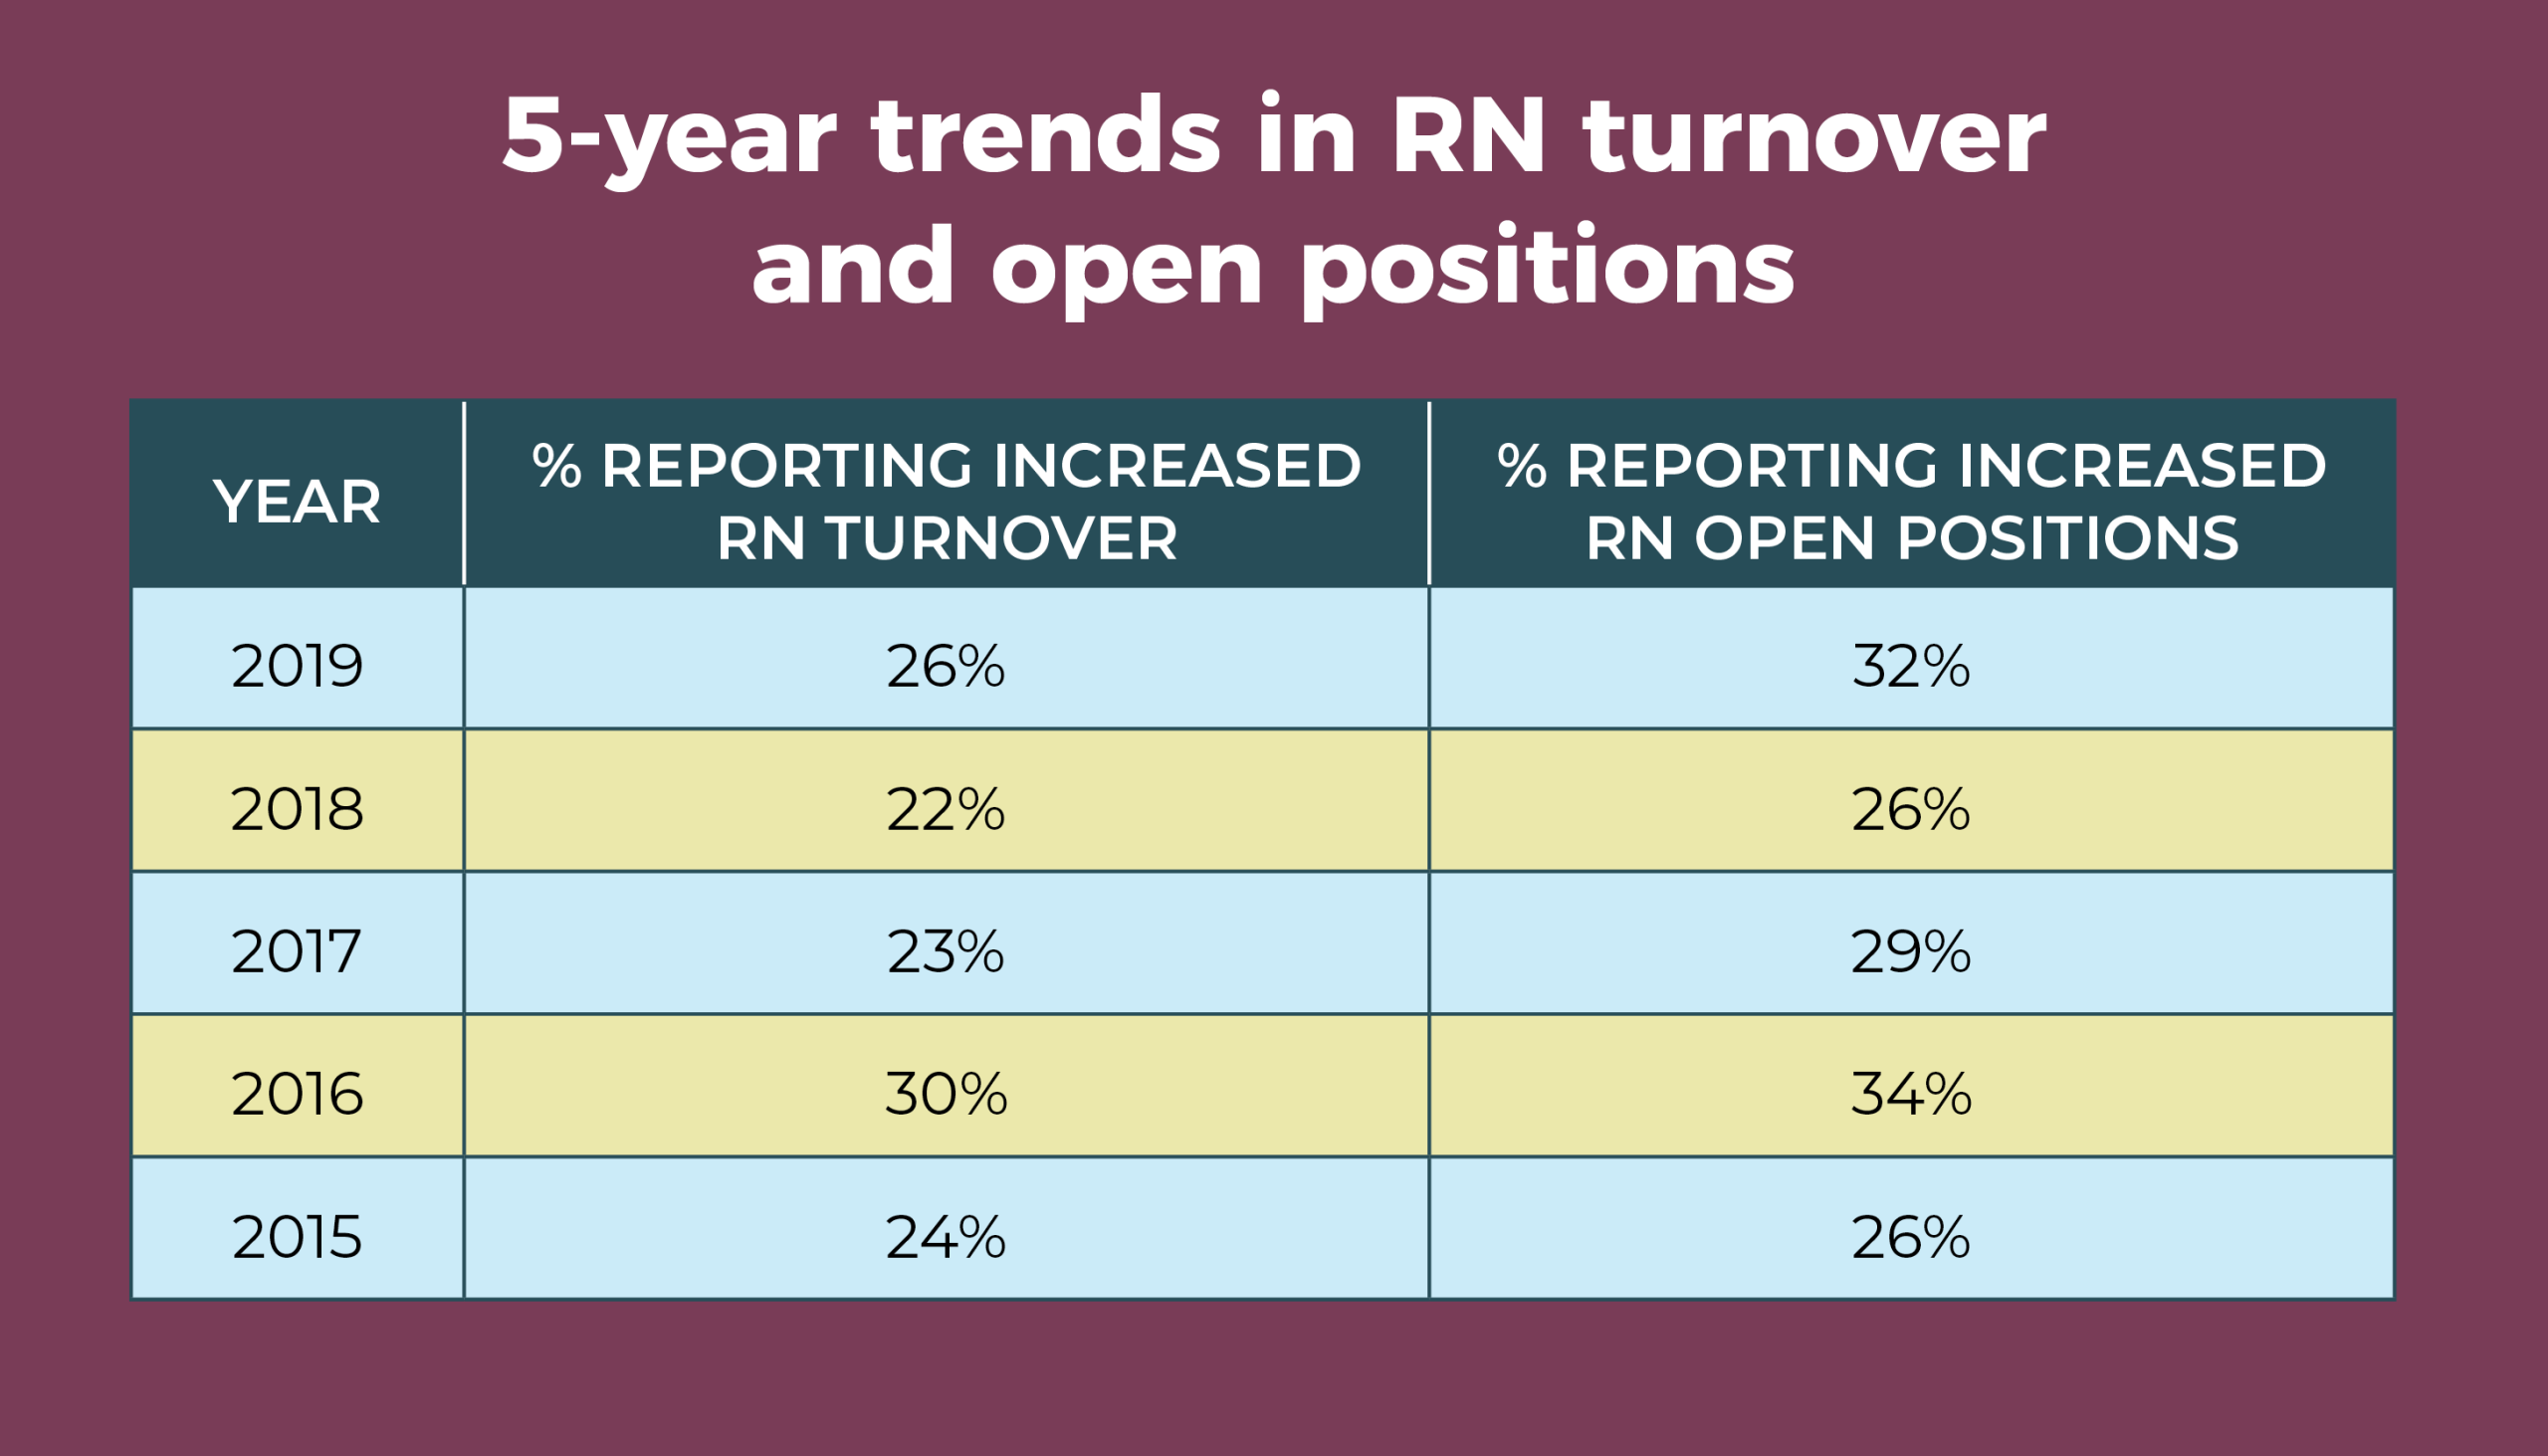
Staffing remains a significant challenge for many leaders of ambulatory surgery centers (ASCs), according to the 2019 annual OR Manager Salary/Career Survey. Nearly a third (32%) of respondents reported more open RN positions, significantly higher than the 26% in 2018; over the past 5 years, only 2016 had a higher percentage (34%). RN turnover increased for 26% of respondents, up slightly from 22% last year. More than a quarter (26%) said they had more open ST positions, comparable to last year’s 24%. The only good news was that ST turnover increased for only 17% of respondents, down slightly from 20% in 2018.
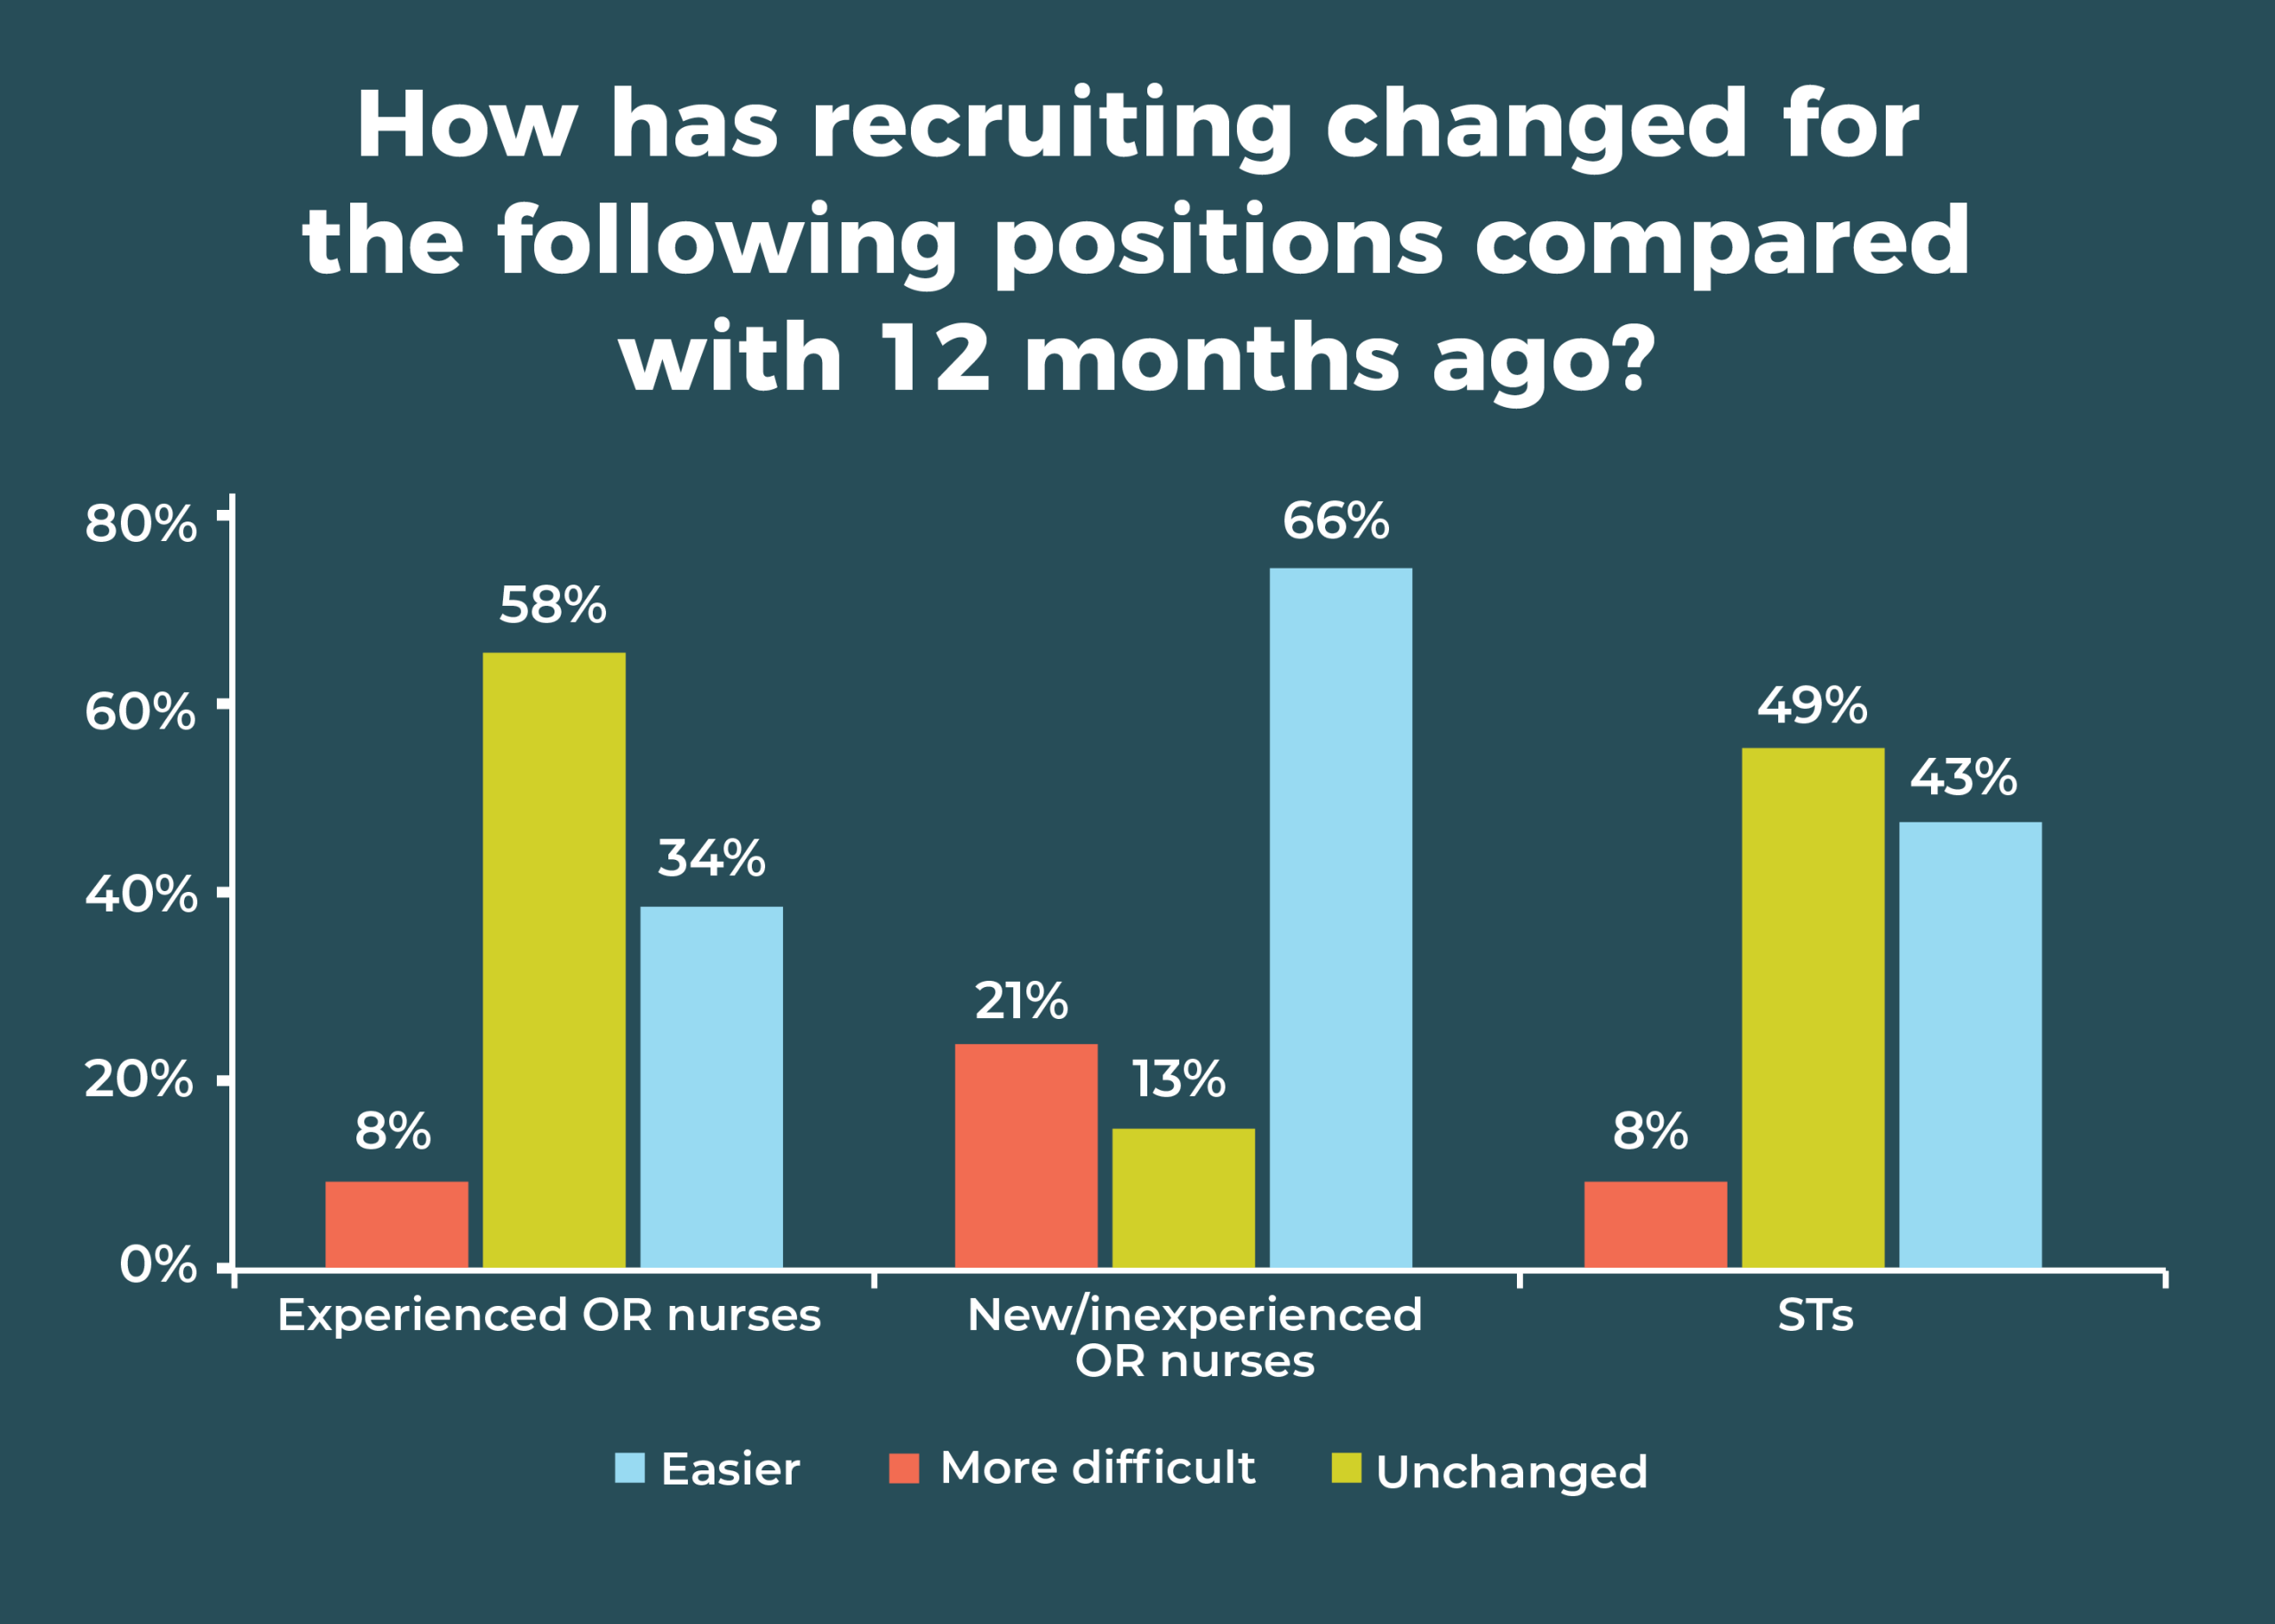
Recruiting staff to fill those open positions remains arduous. In 2018, 56% of respondents said recruiting experienced OR nurses was more difficult, compared with 58% in 2019. Nearly half (49%) reported more difficulty recruiting STs, up from 41% last year.

Despite the signs of staffing issues, it’s worth noting that stability is the hallmark for most respondents. Compared with 12 months ago, 62% said turnover has stayed the same for RNs (vs 73% in 2018), and 70% reported it as the same for STs. The percentage of RN open positions compared with 12 months ago stayed the same for 56% of OR leaders, with 62% reporting the same for STs.
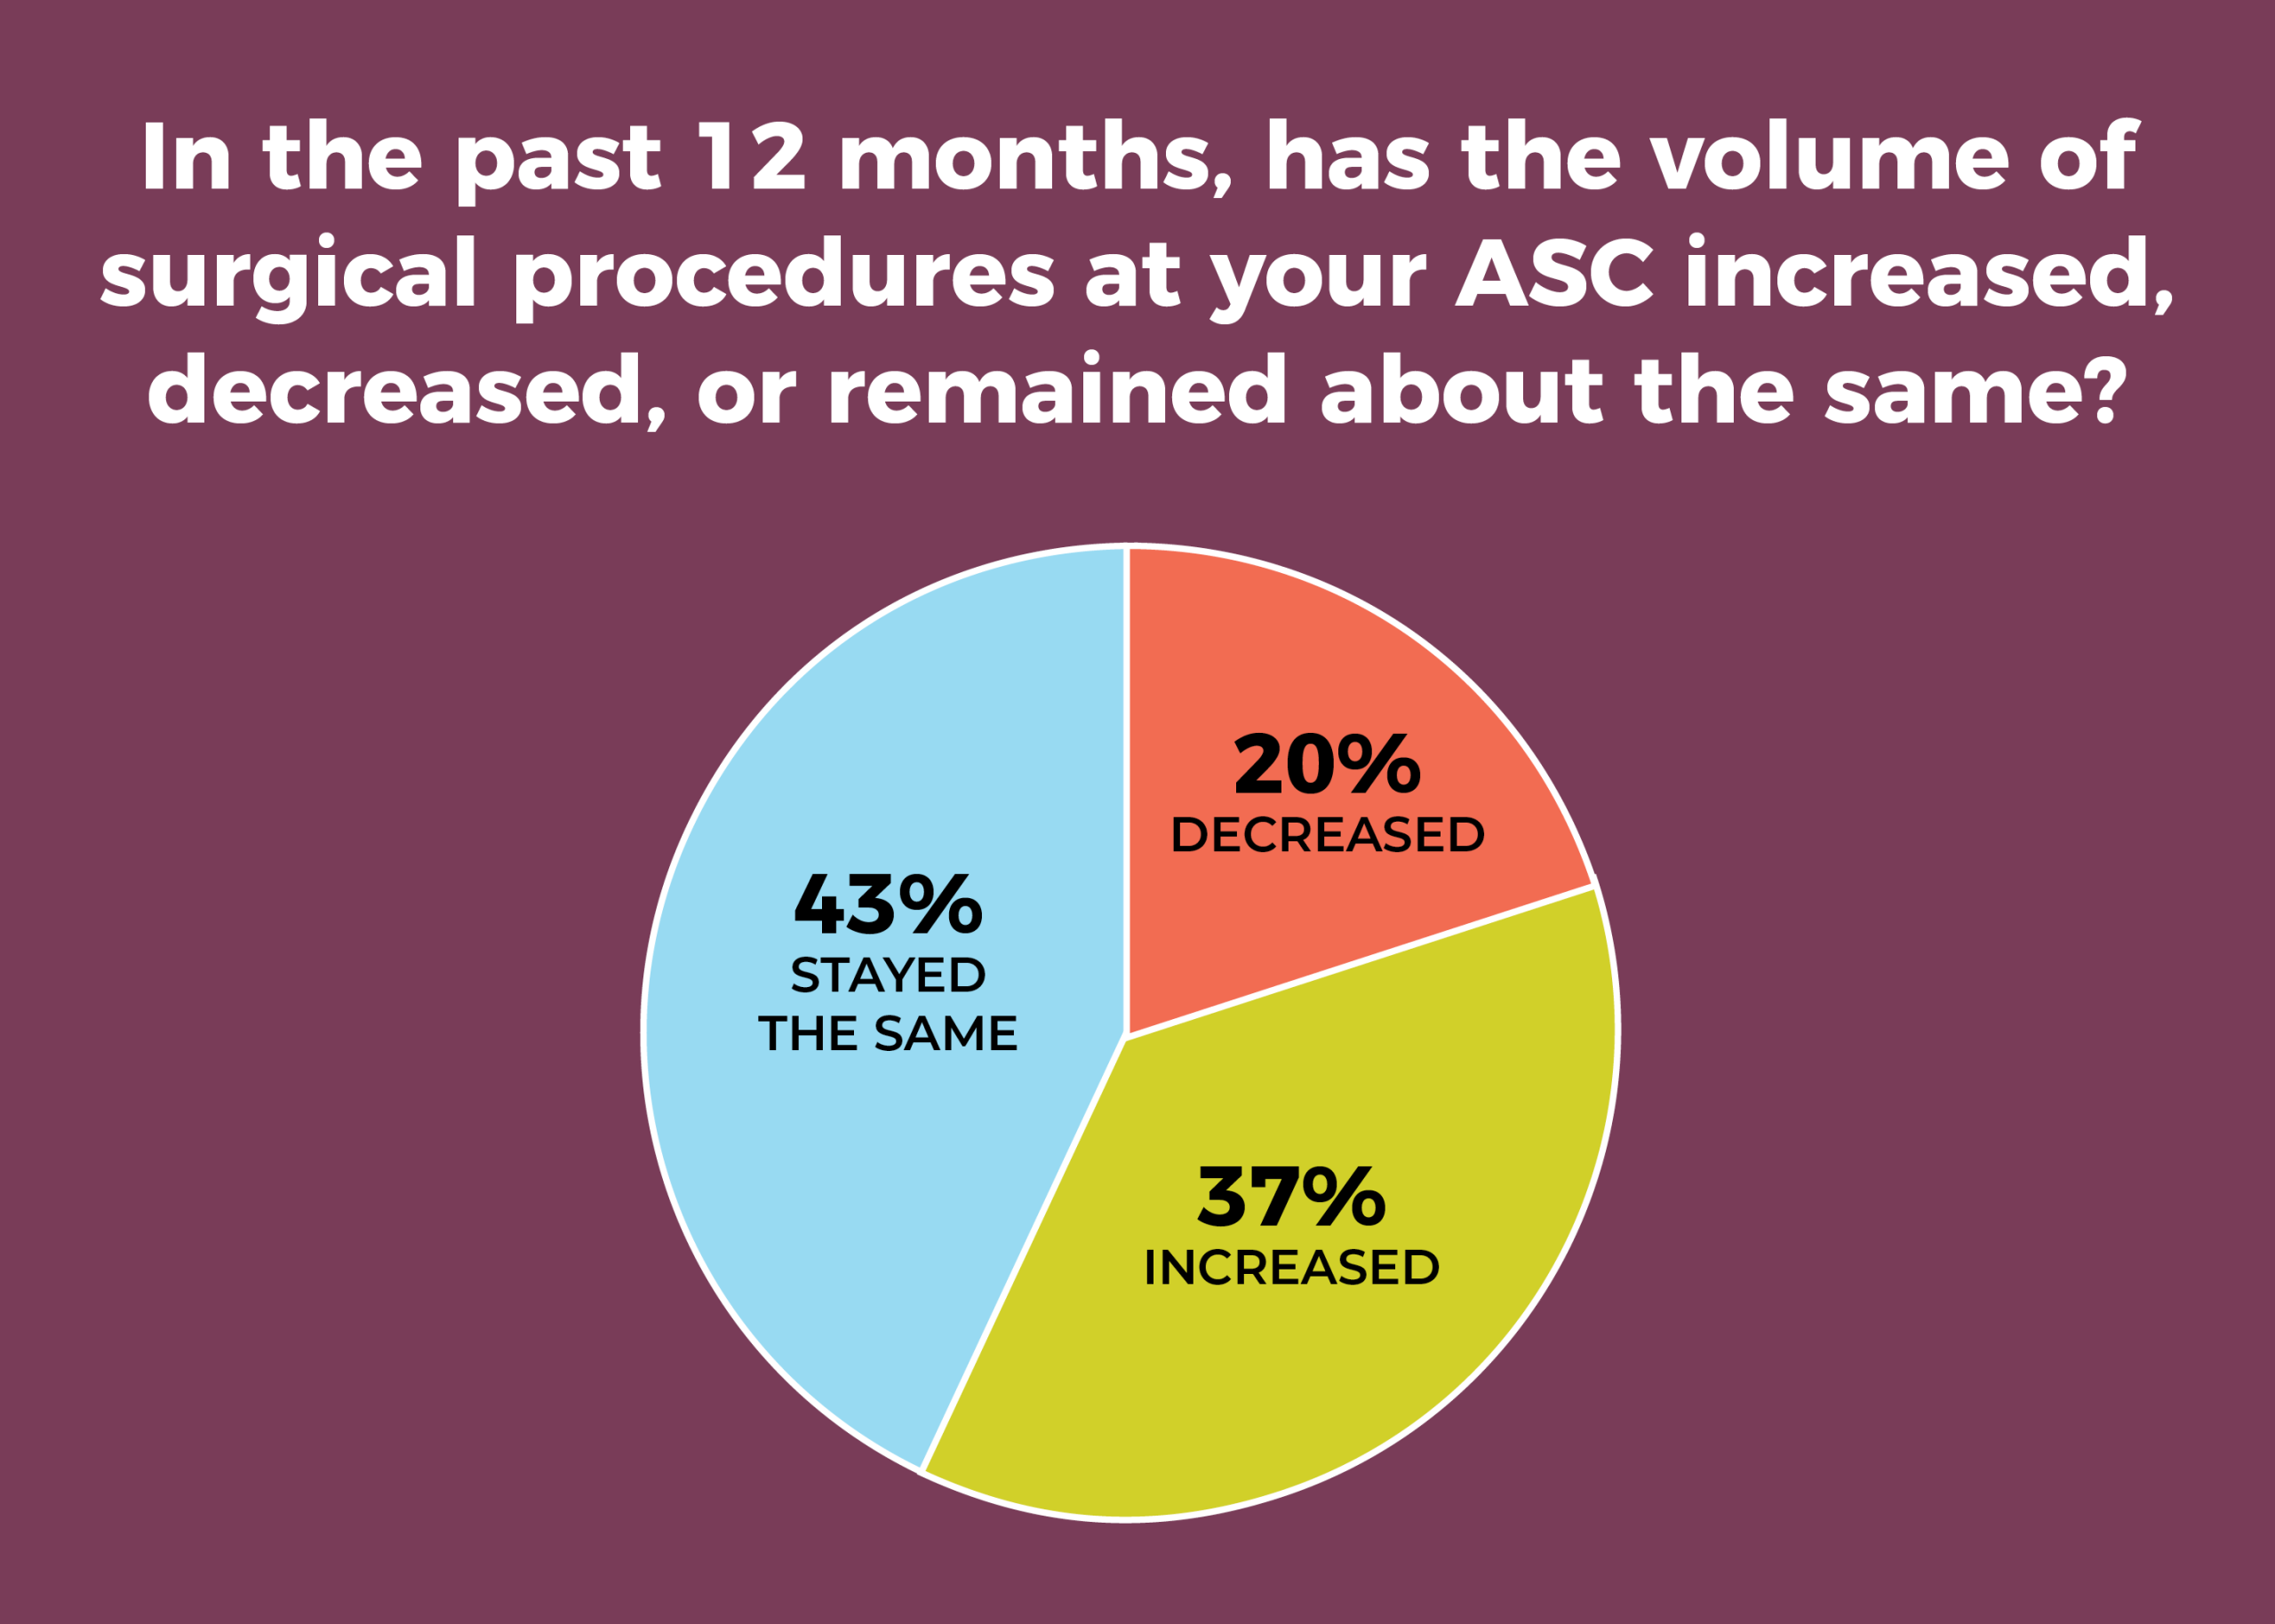
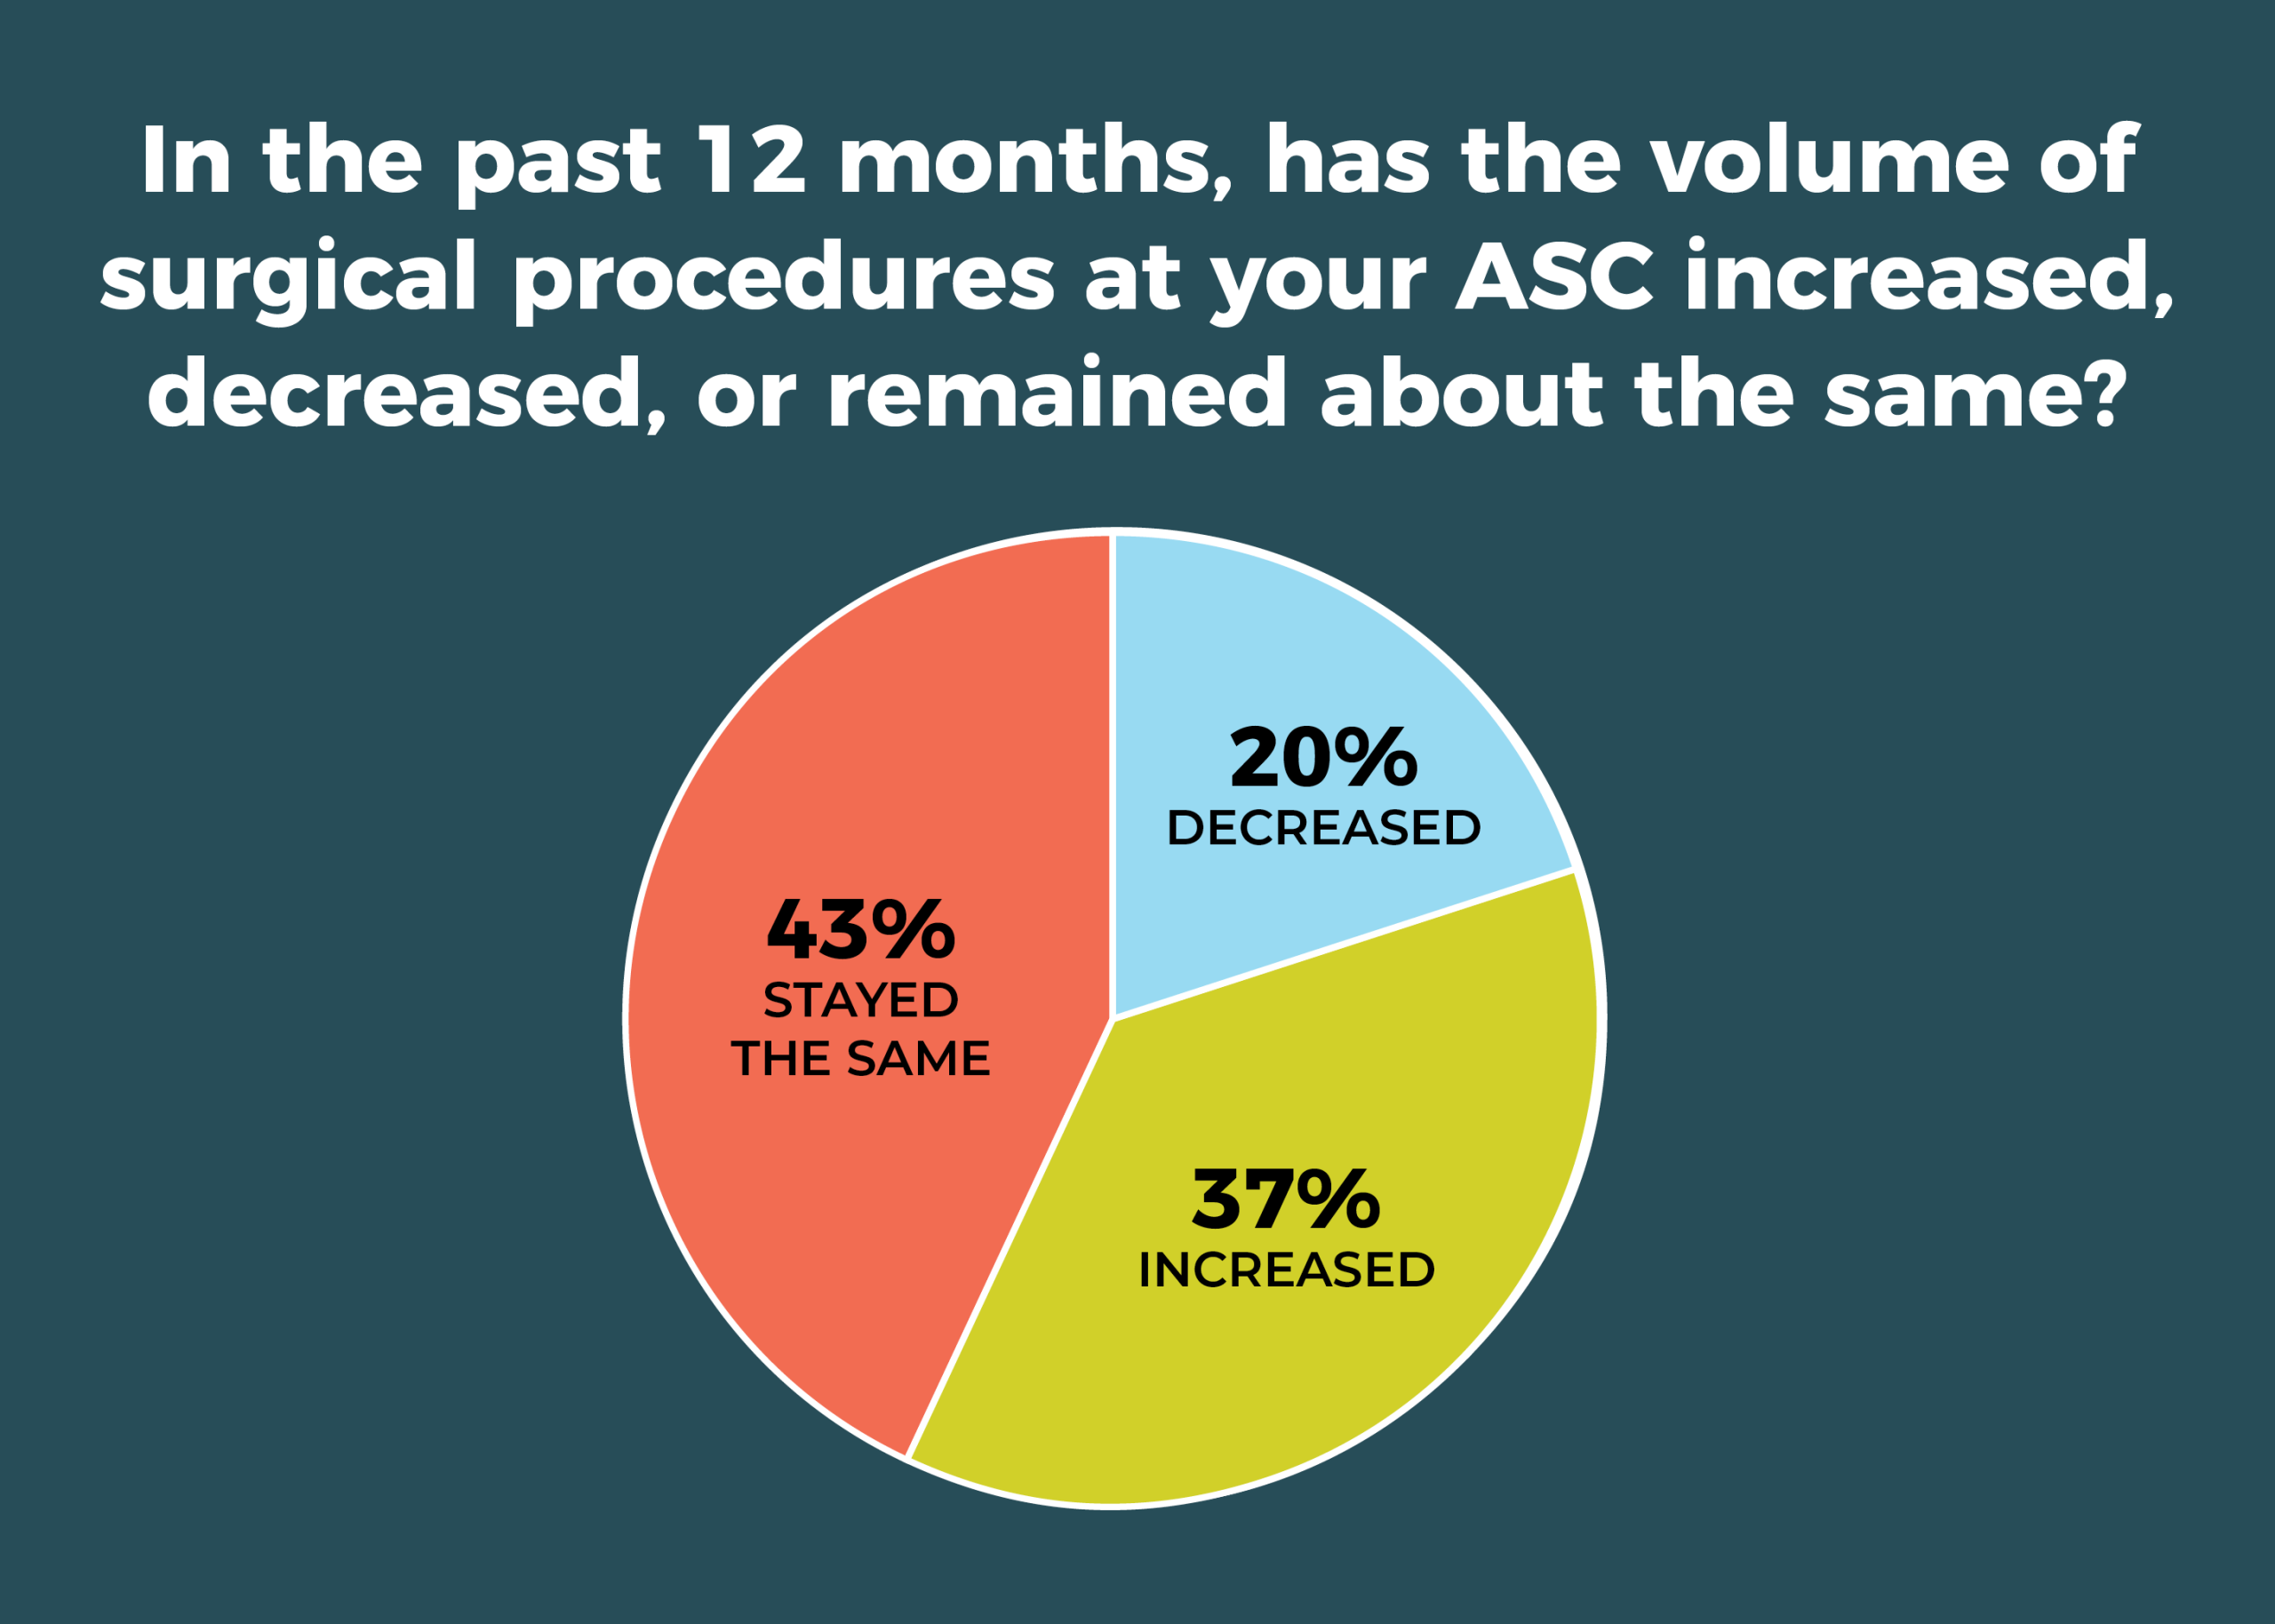
Stability also seems to be the case for surgical volume, with 43% reporting that volume remained the same over the past 12 months, comparable to the 40% reported last year. Slightly more than a third (37% vs 40% in 2018) said volume has increased, and 20% said it has decreased, as was reported last year.

A total of 163 respondents provided usable data for the question on how surgical volume had changed over the past 12 months. The average surgical volume was 5,115 annually, but there was a wide range of responses (80 to 100,000), making interpretation difficult.
The number of specialties over the past 12 months has remained stable for most OR leaders (73%), with only 23% reporting an increase, nearly the same as the 24% reported last year.
The uptake of care models—Accountable Care Organizations, joint ventures, Enhanced Recovery After Surgery (ERAS), Perioperative Surgical Homes, and dual-license facility—remains low. Nearly two-thirds (63% vs 59% in 2018) of respondents do not have and do not plan to implement them in the next 6 months. Of those who have one of the care models or plan to implement, the top pick was some form of joint venture (18%), followed by ERAS at 16% (up from 11% in 2018).
When asked about their biggest reimbursement concern, ASC leaders most commonly mentioned payer mix and bundled payments. Representative comments include:
- “Medicare and Medicaid reimbursement not enough to cover expensive supplies or implants.”
- “Insurance companies more difficult to deal with (requiring more documentation for precertifications and denying payment after surgery performed).”
- “Increasing cost of supplies (mainly implants) and bundled payments not reflecting some of those increased costs.”


Most respondents (39%) work in physician-owned ASCs, followed by joint venture (23%), hospital owned (17%), and corporate/LCC (17%).
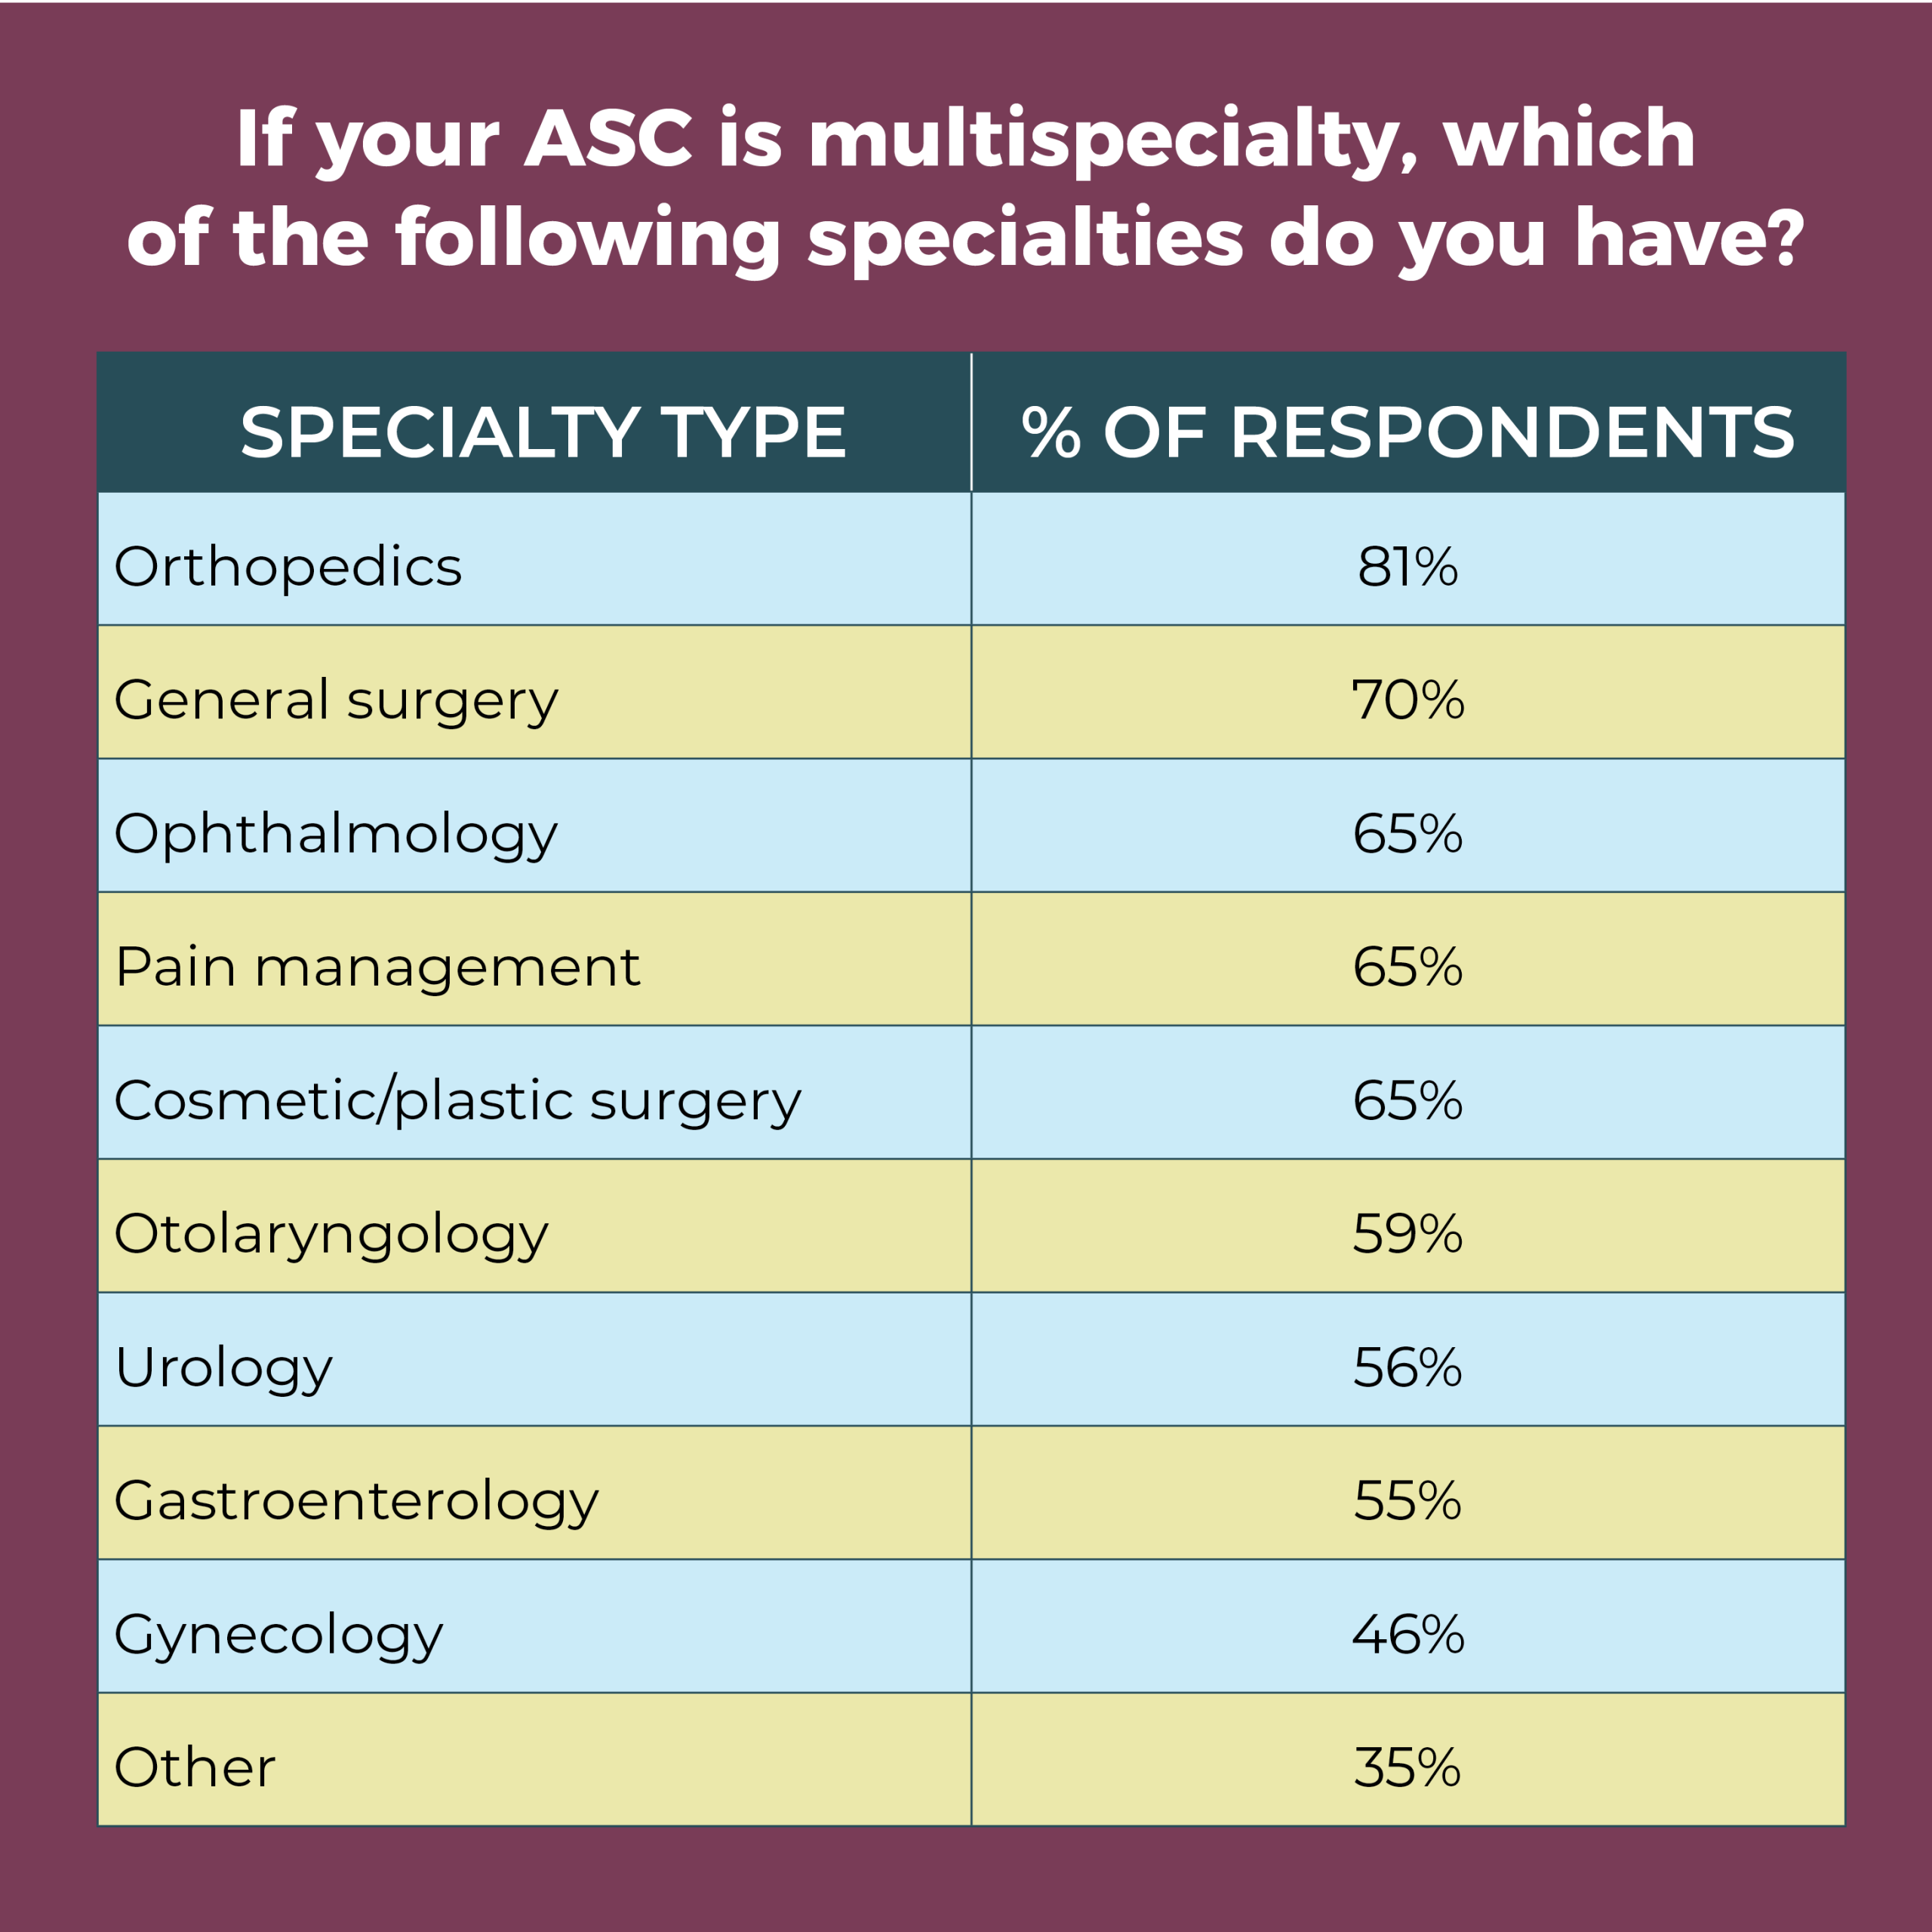
Nearly three-quarters (73%) are employed in a multispecialty ASC, with orthopedics and general surgery the top two specialties at 81% and 70%, respectively. Ophthalmology, cosmetic/plastic surgery, and pain management tie for the third slot, at 65%. Ophthalmology is the most common focus for single-specialty ASCs (31%), followed by orthopedics (21%). Cosmetic/plastic surgery and gastroenterology tie for third at 12%.

A total of 34% of respondents reported no change in recruiting difficulty for experienced RNs (vs 39% in 2018); 42% reported no change for STs (down from 51% in 2018, with most of the shift going to the more difficult category). Two-thirds (66%) reported no change for new/inexperienced OR nurses (up from 56% in 2018, with most of the shift coming from the more difficult category).
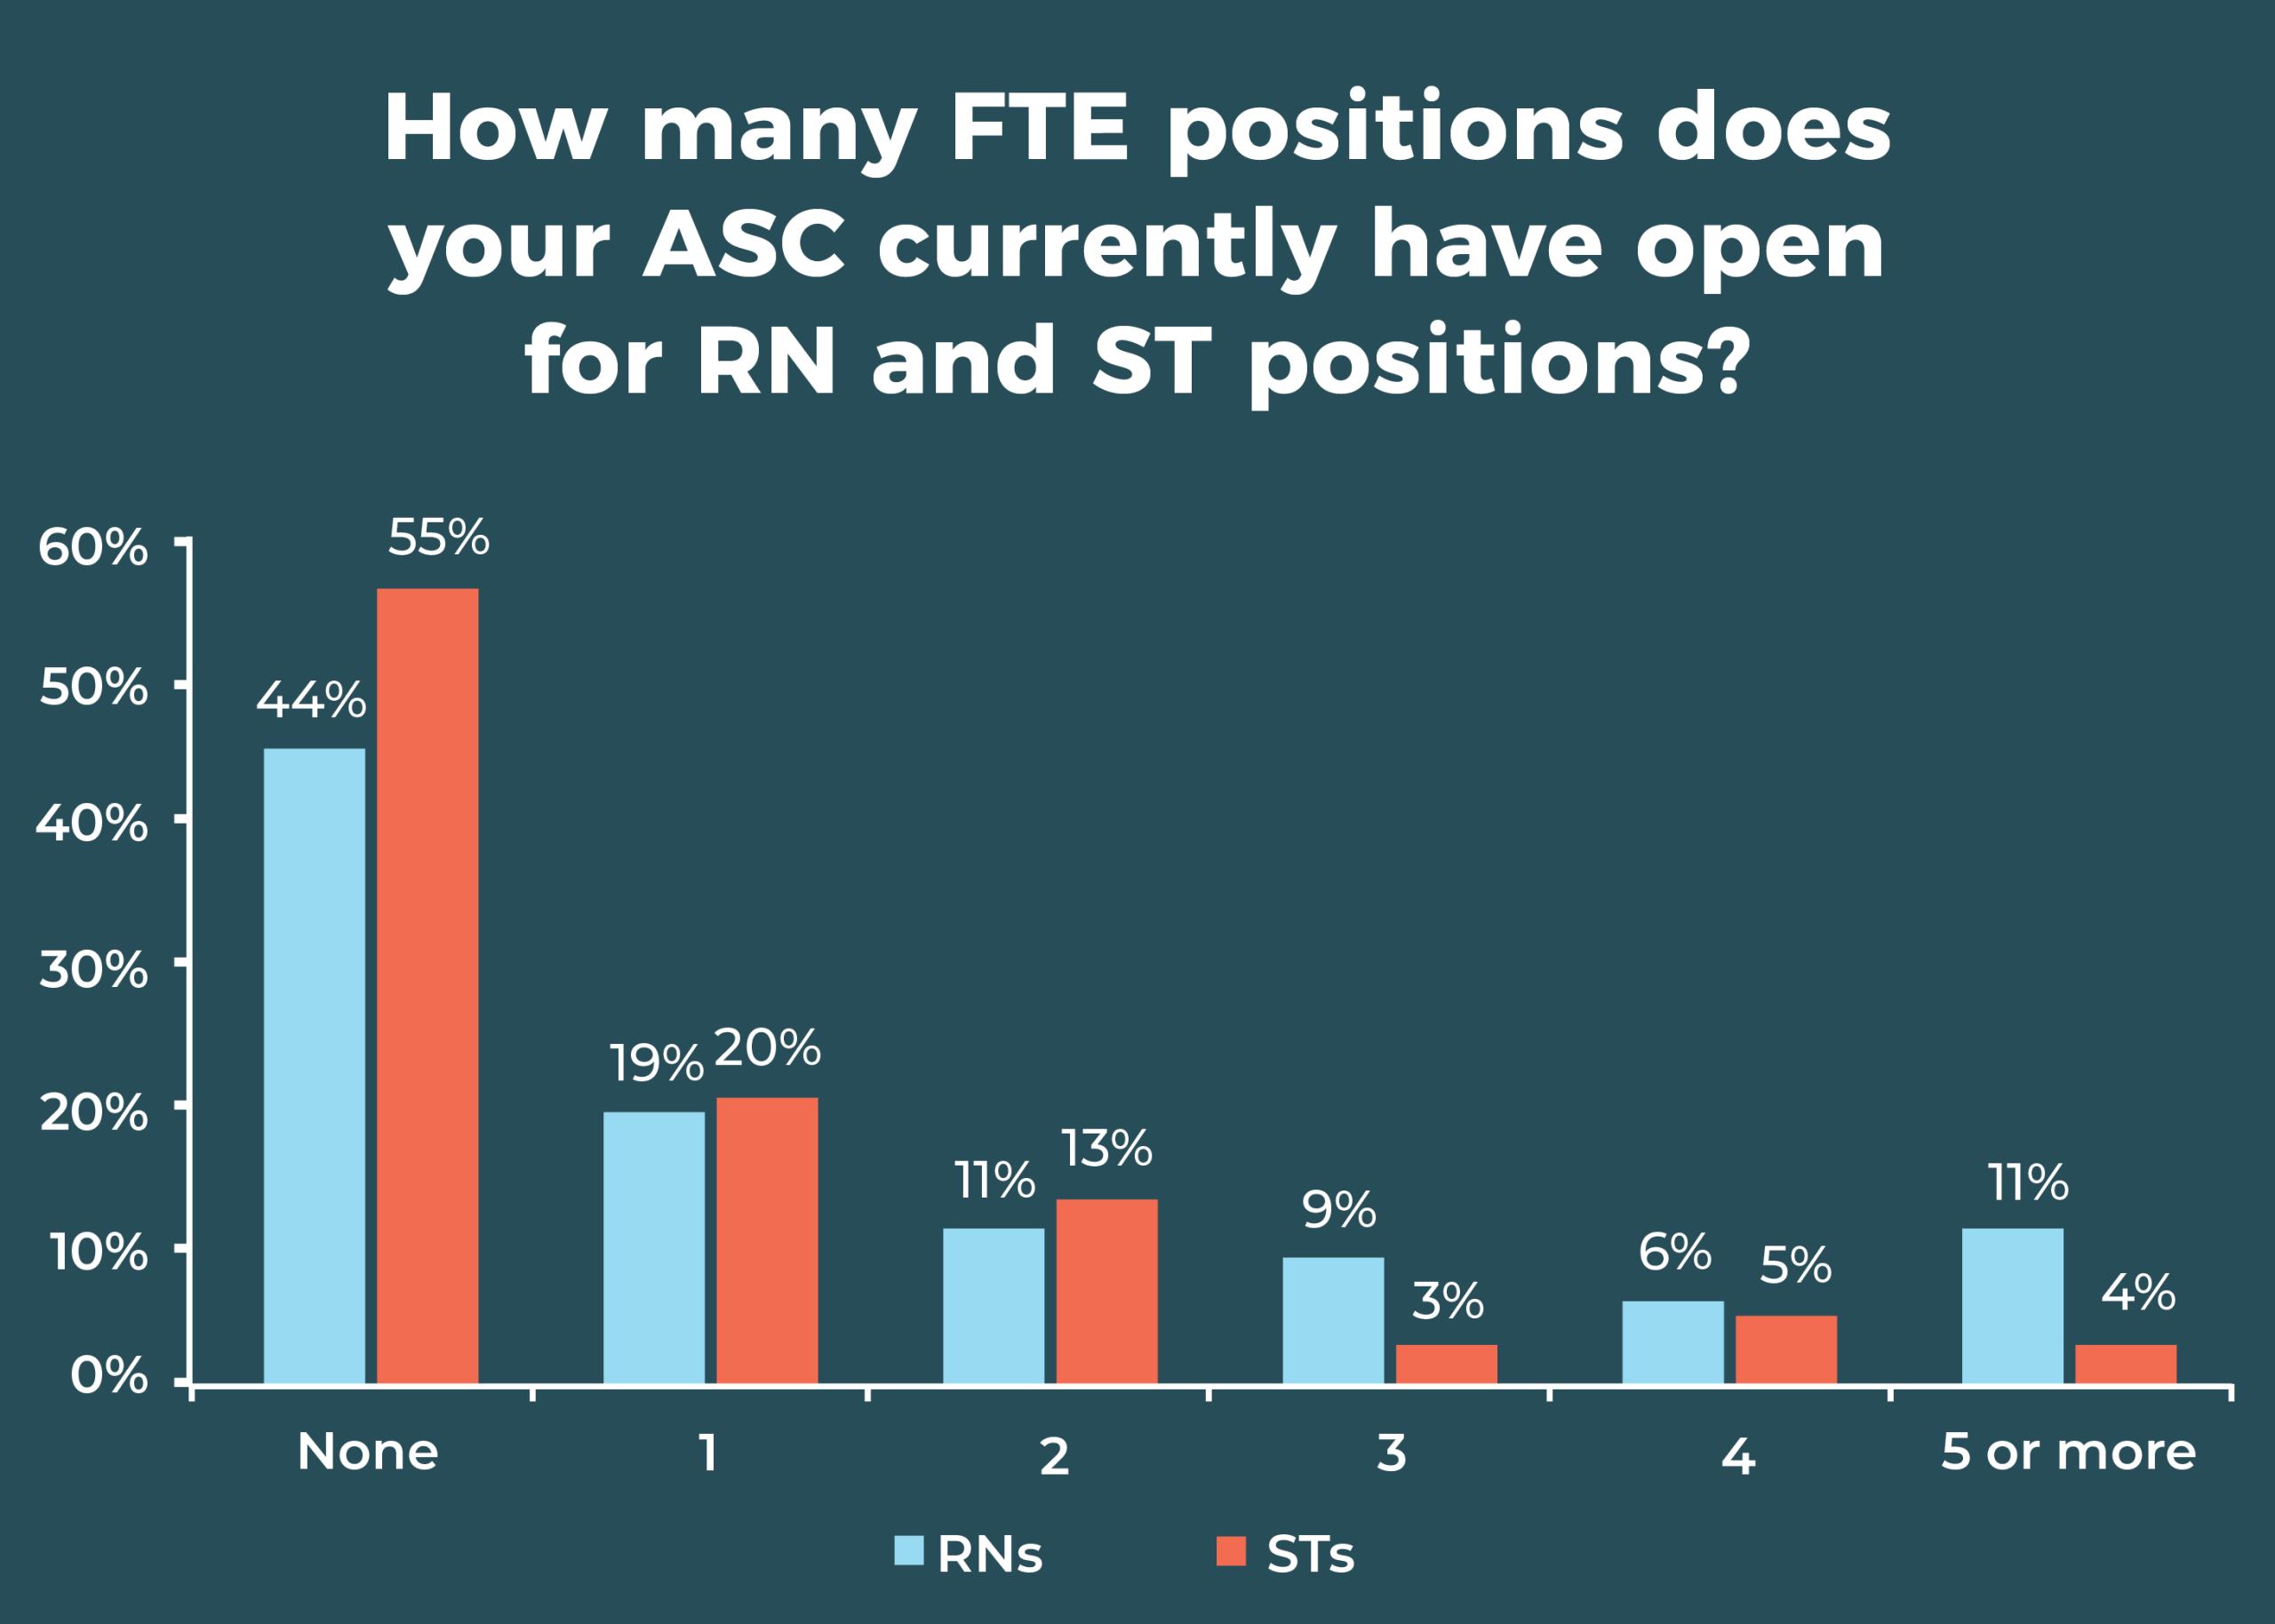
More than half (55%) of ASC leaders reported no open ST positions, and 44% reported no open RN positions, similar to last year (50% and 41%, respectively). At the other end of the spectrum, 11% reported 5 or more open RN positions (vs 9% in 2018), and 3% had 5 or more open ST positions (vs 2% in 2018).
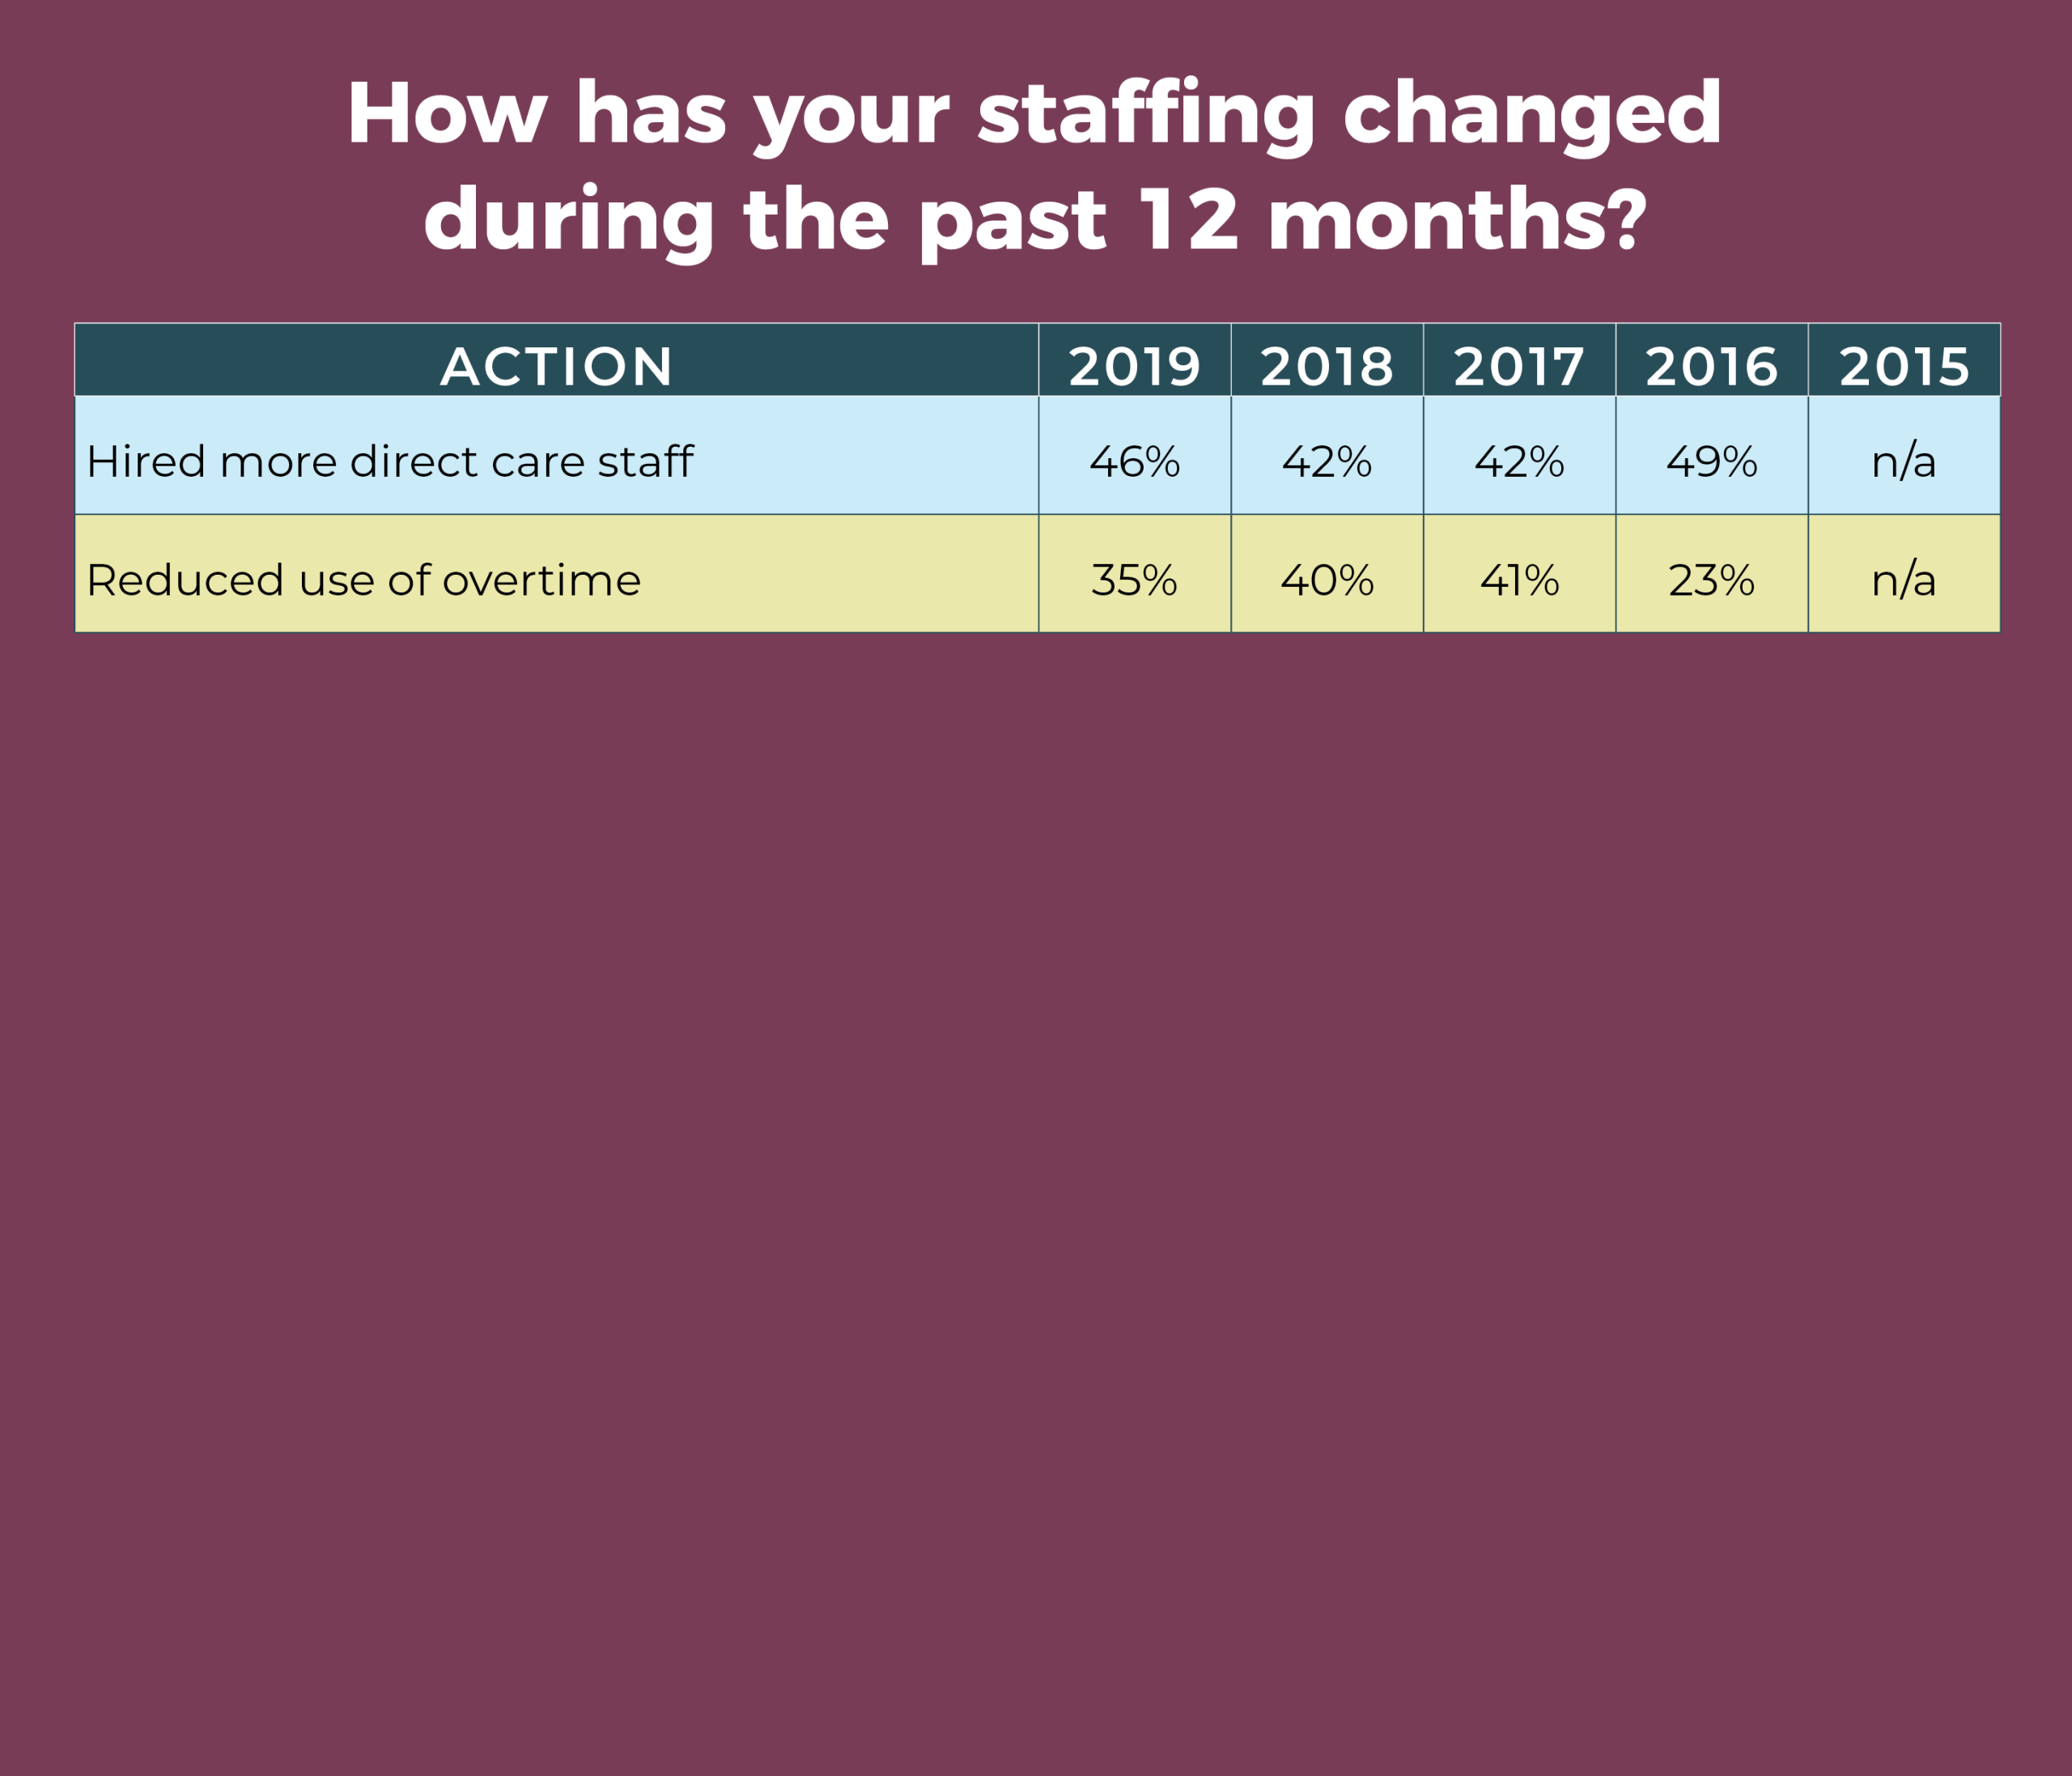
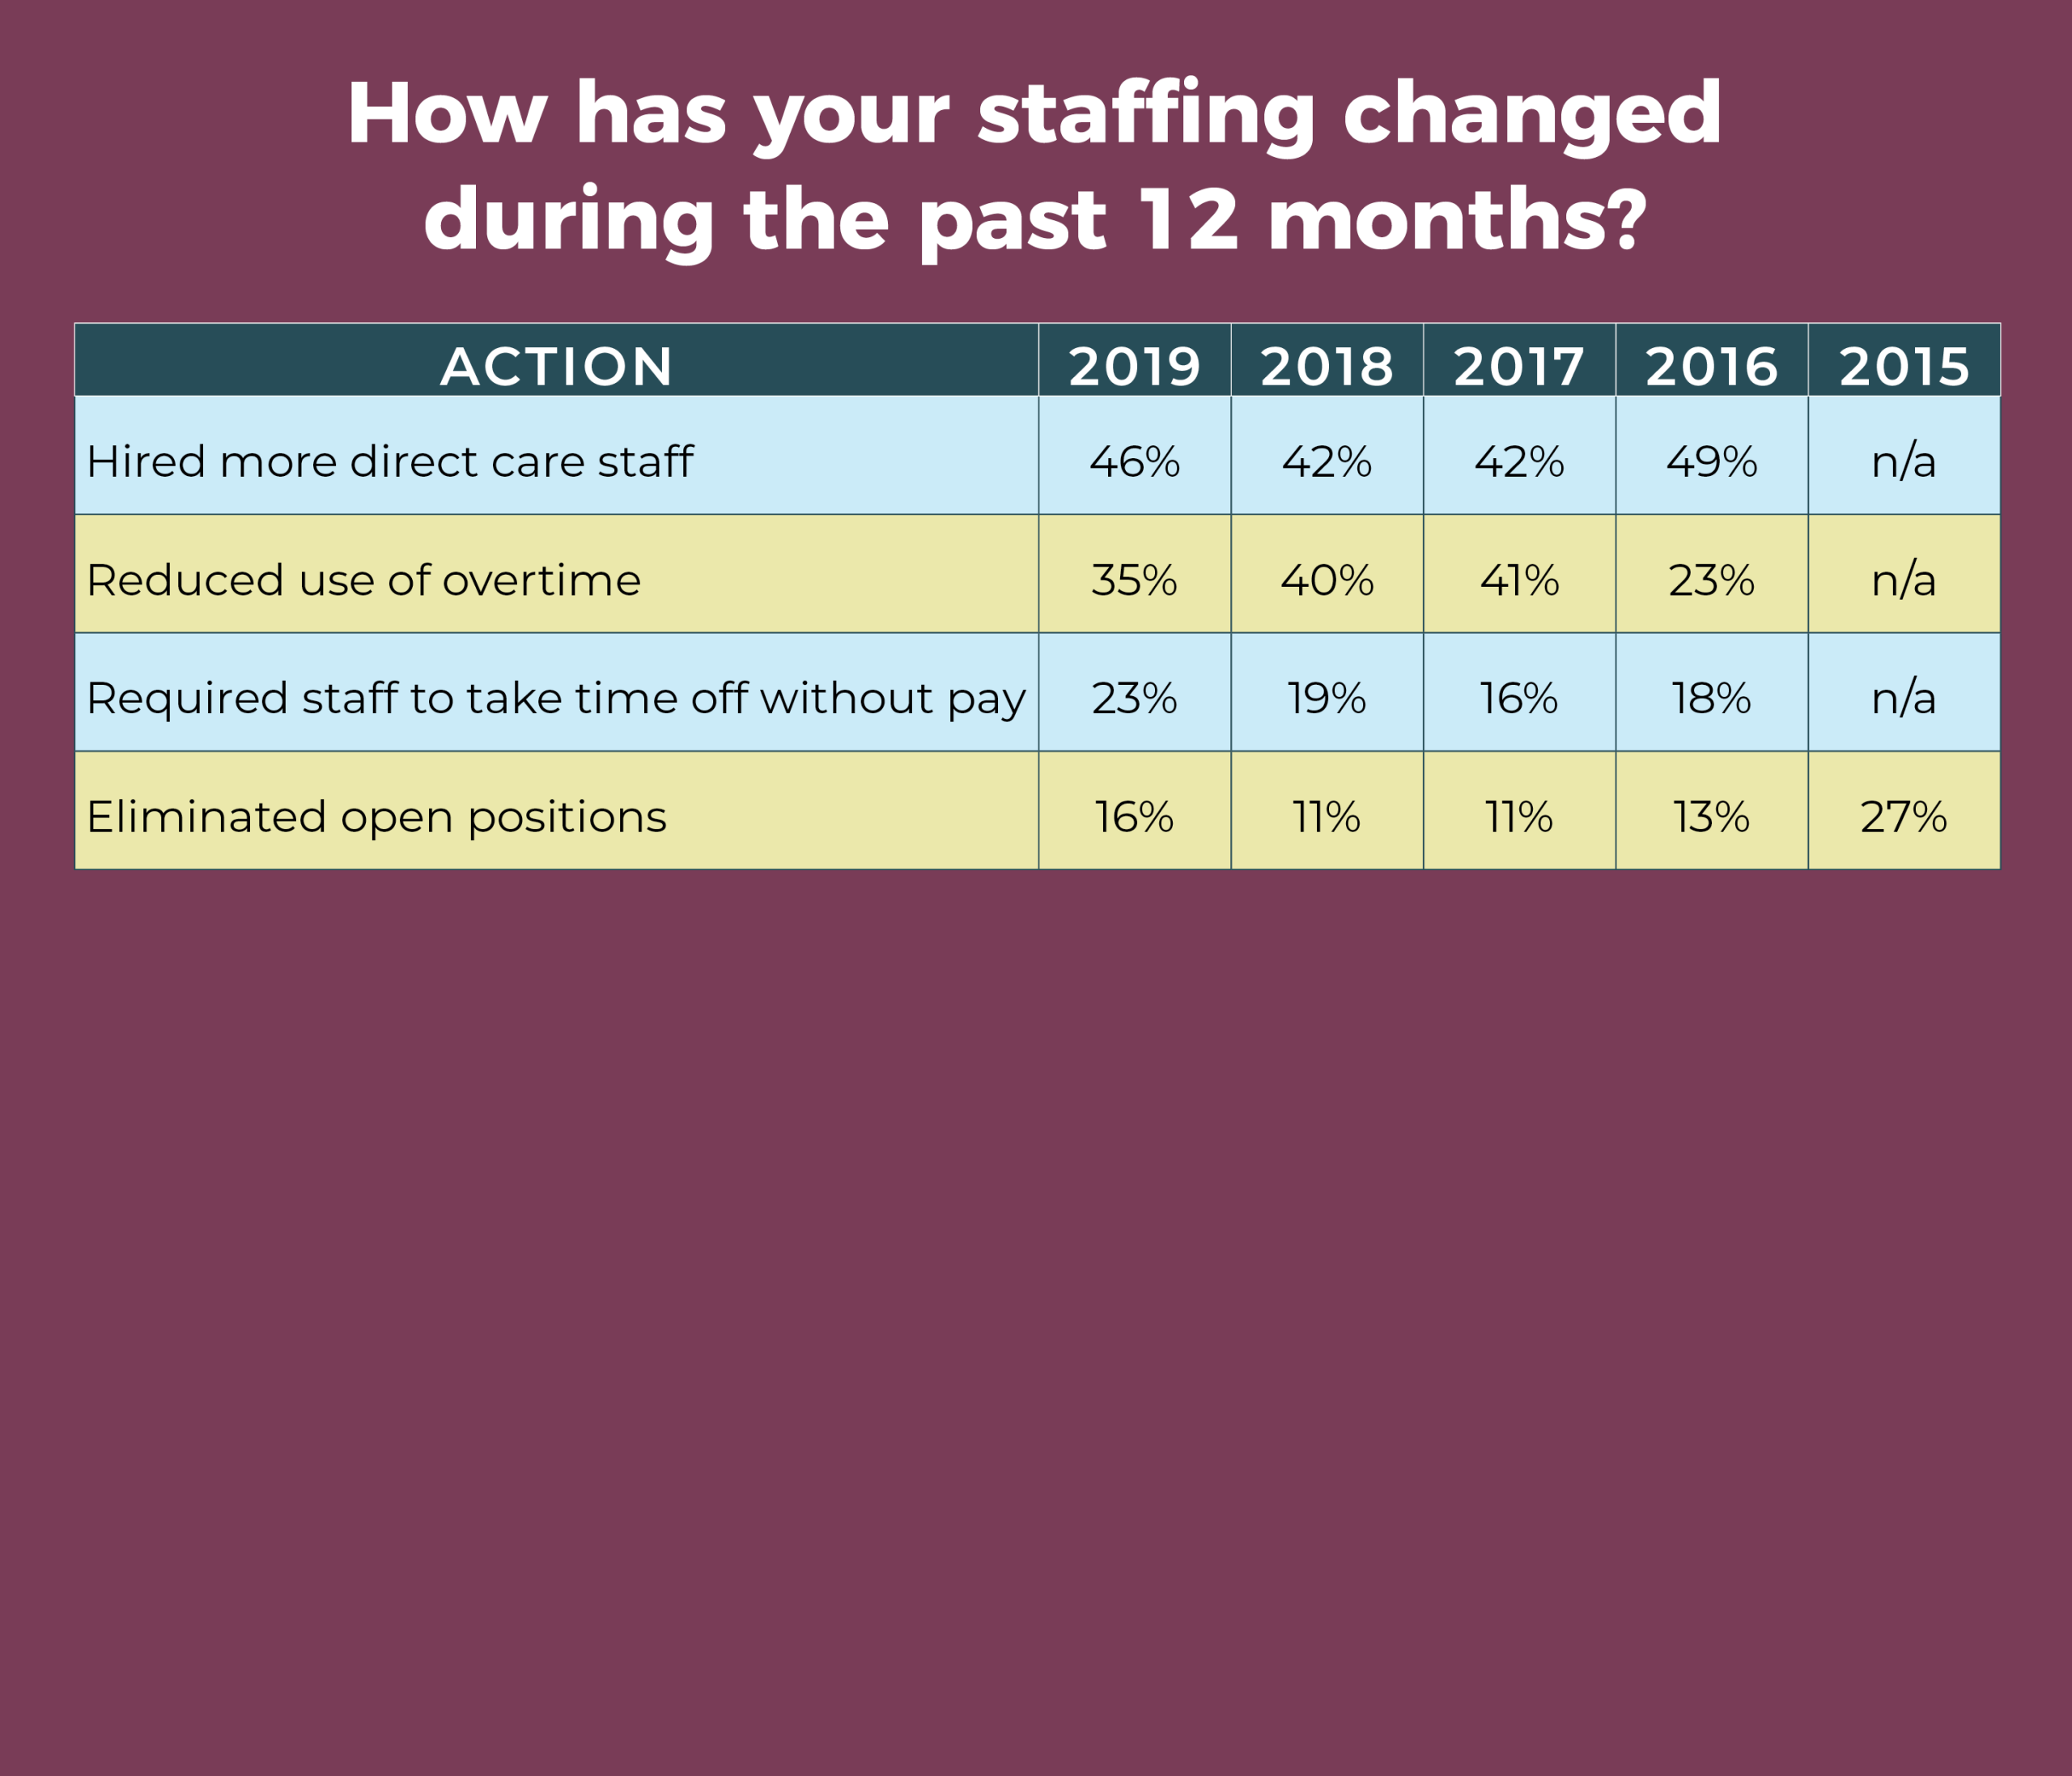
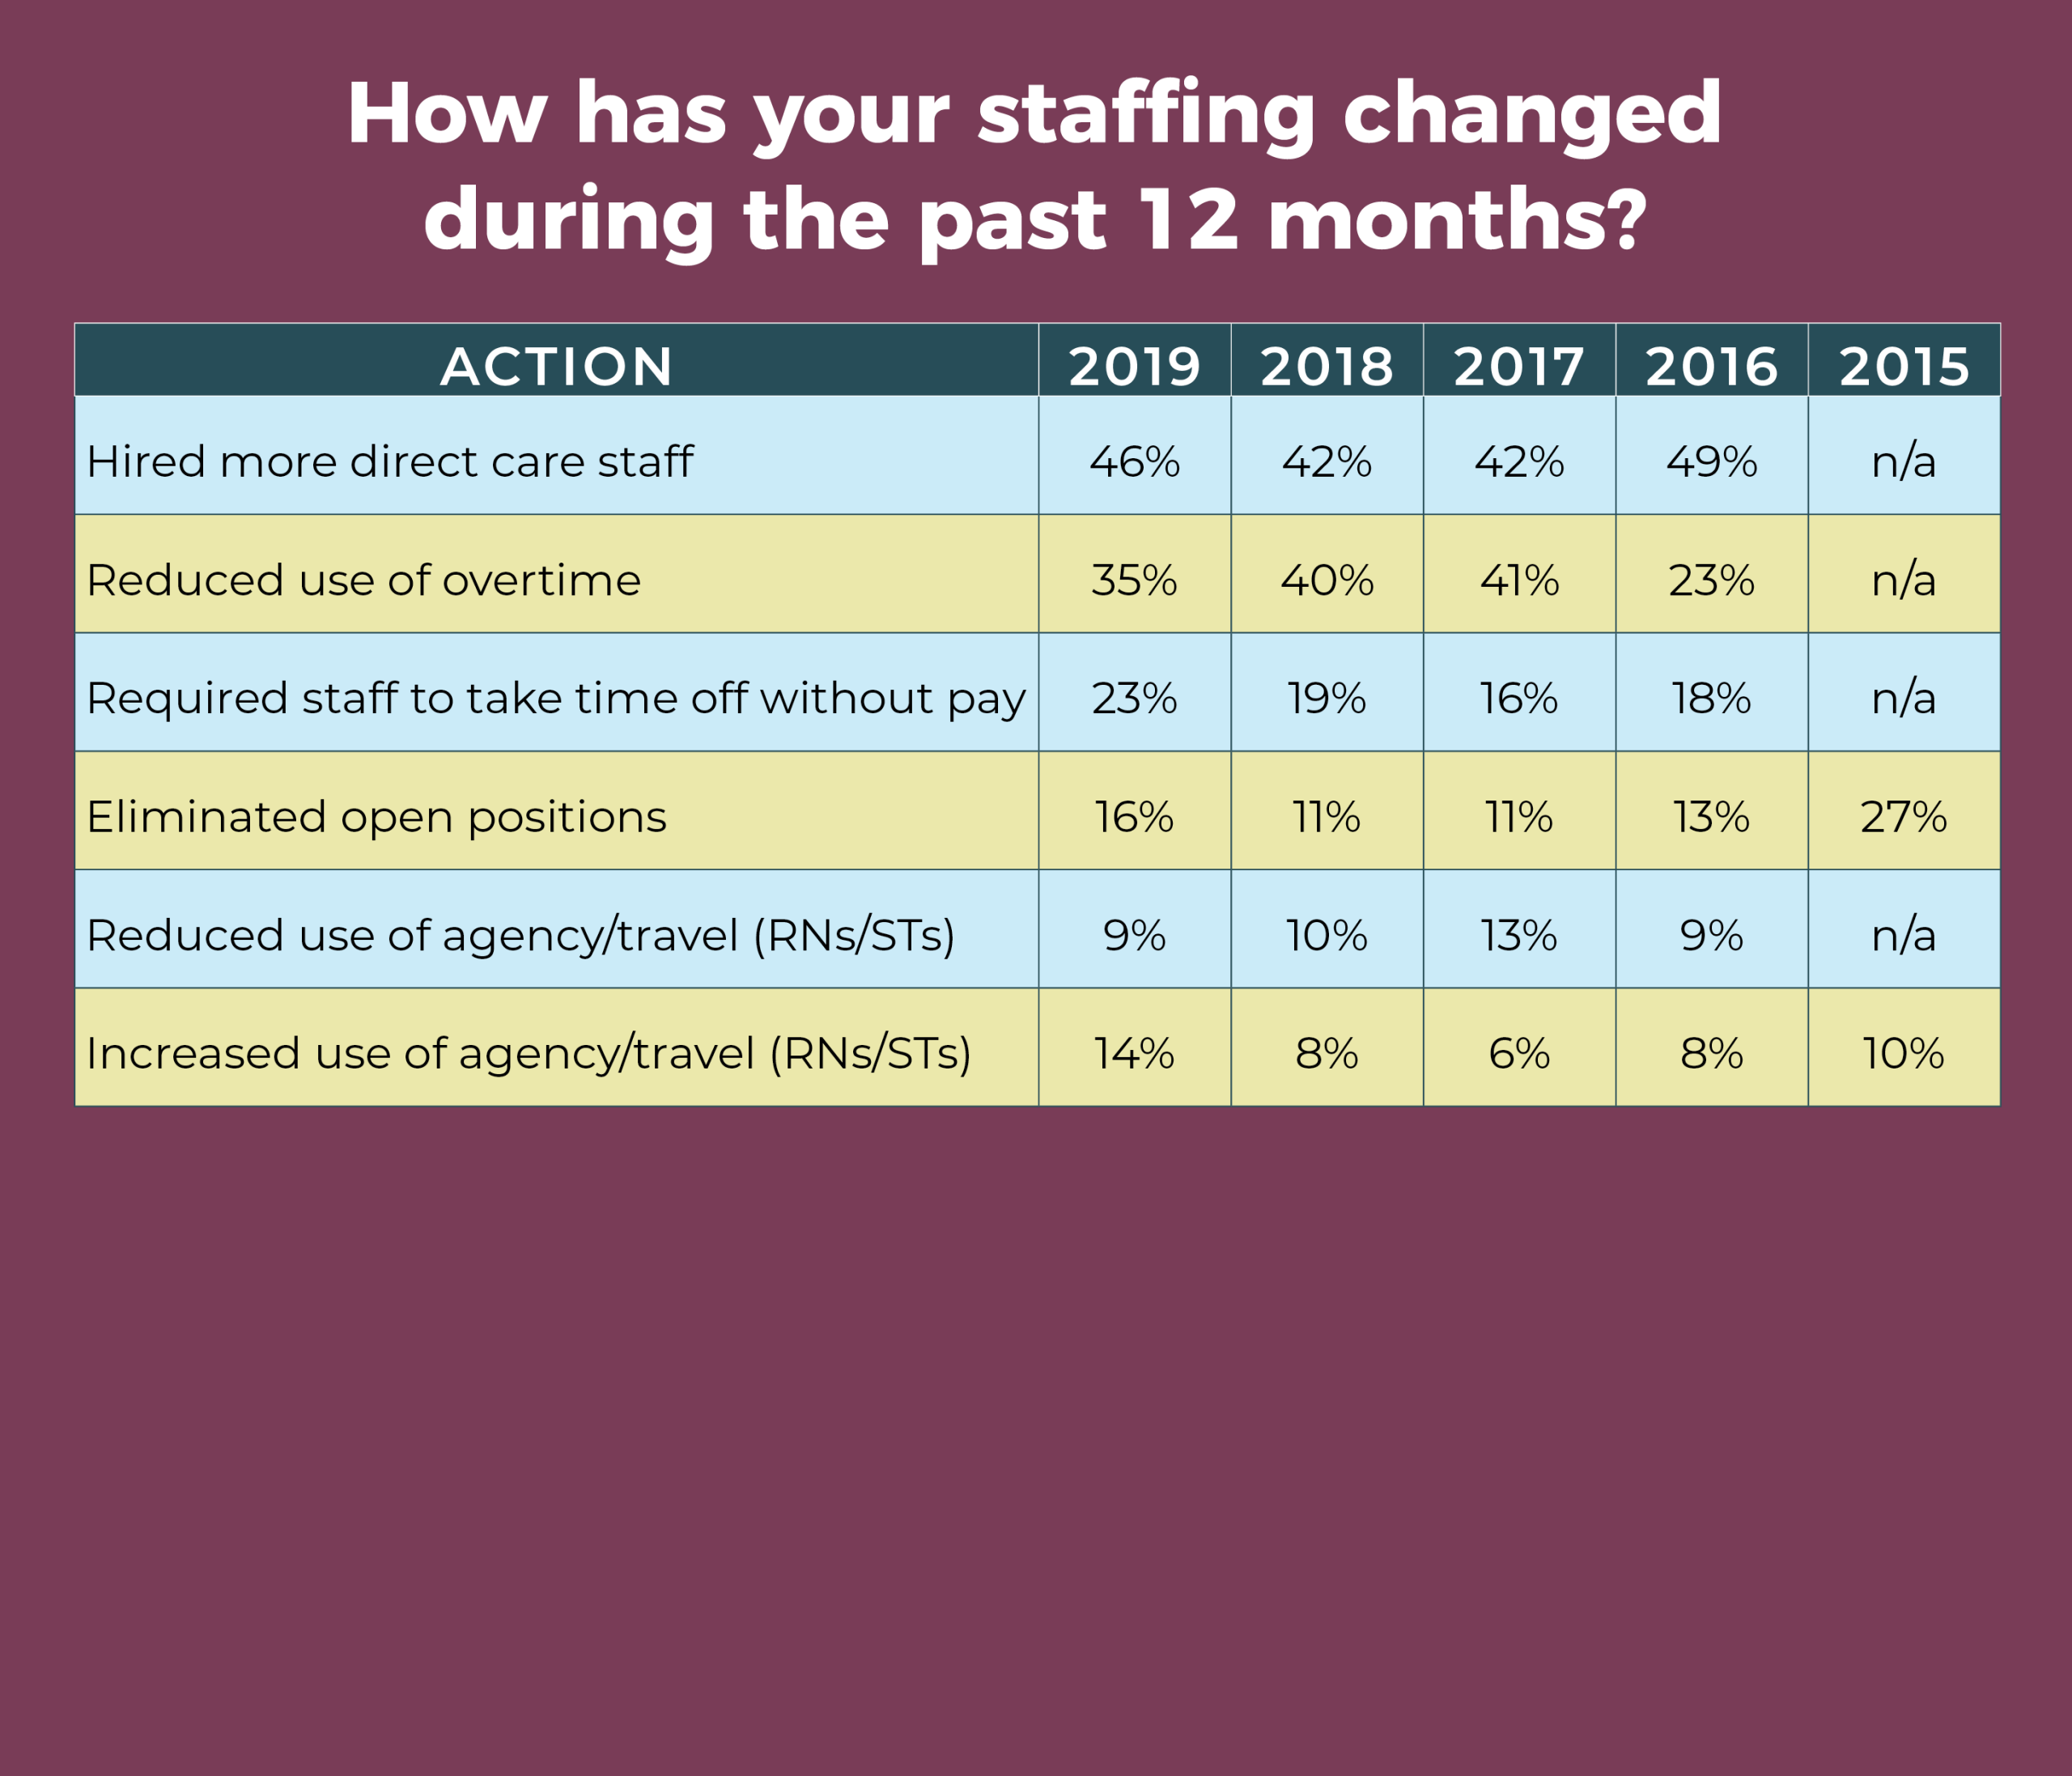
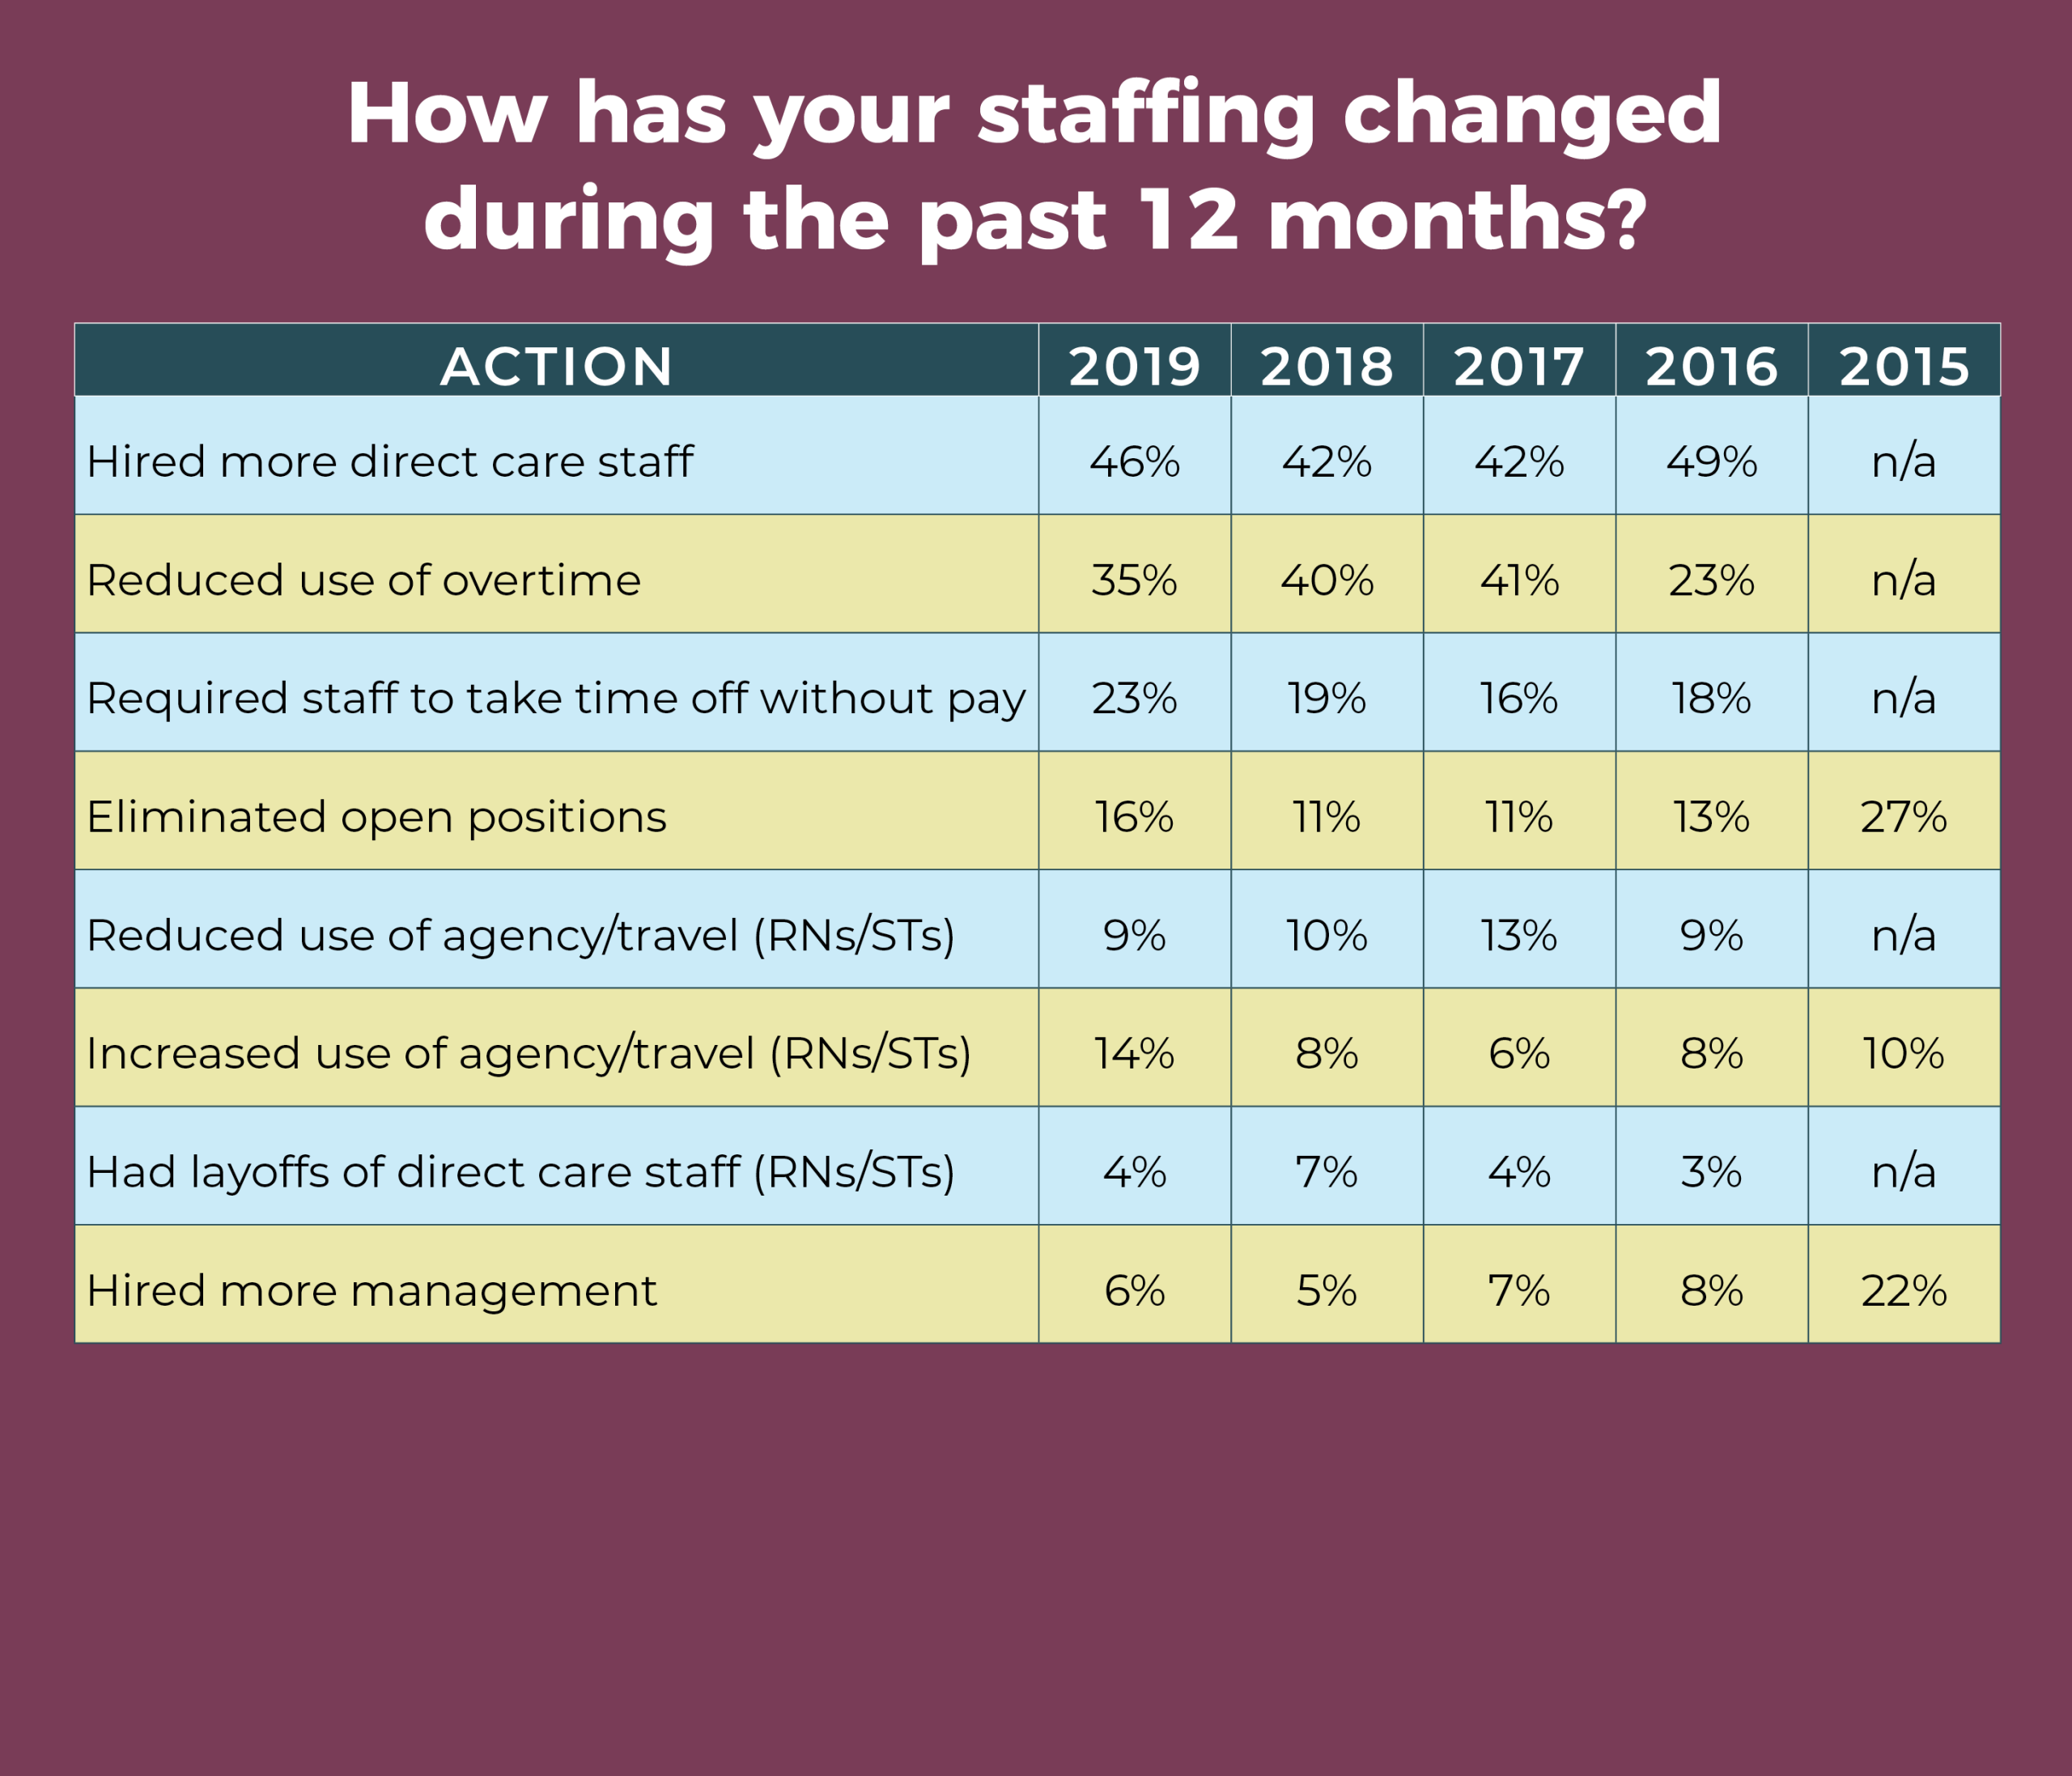
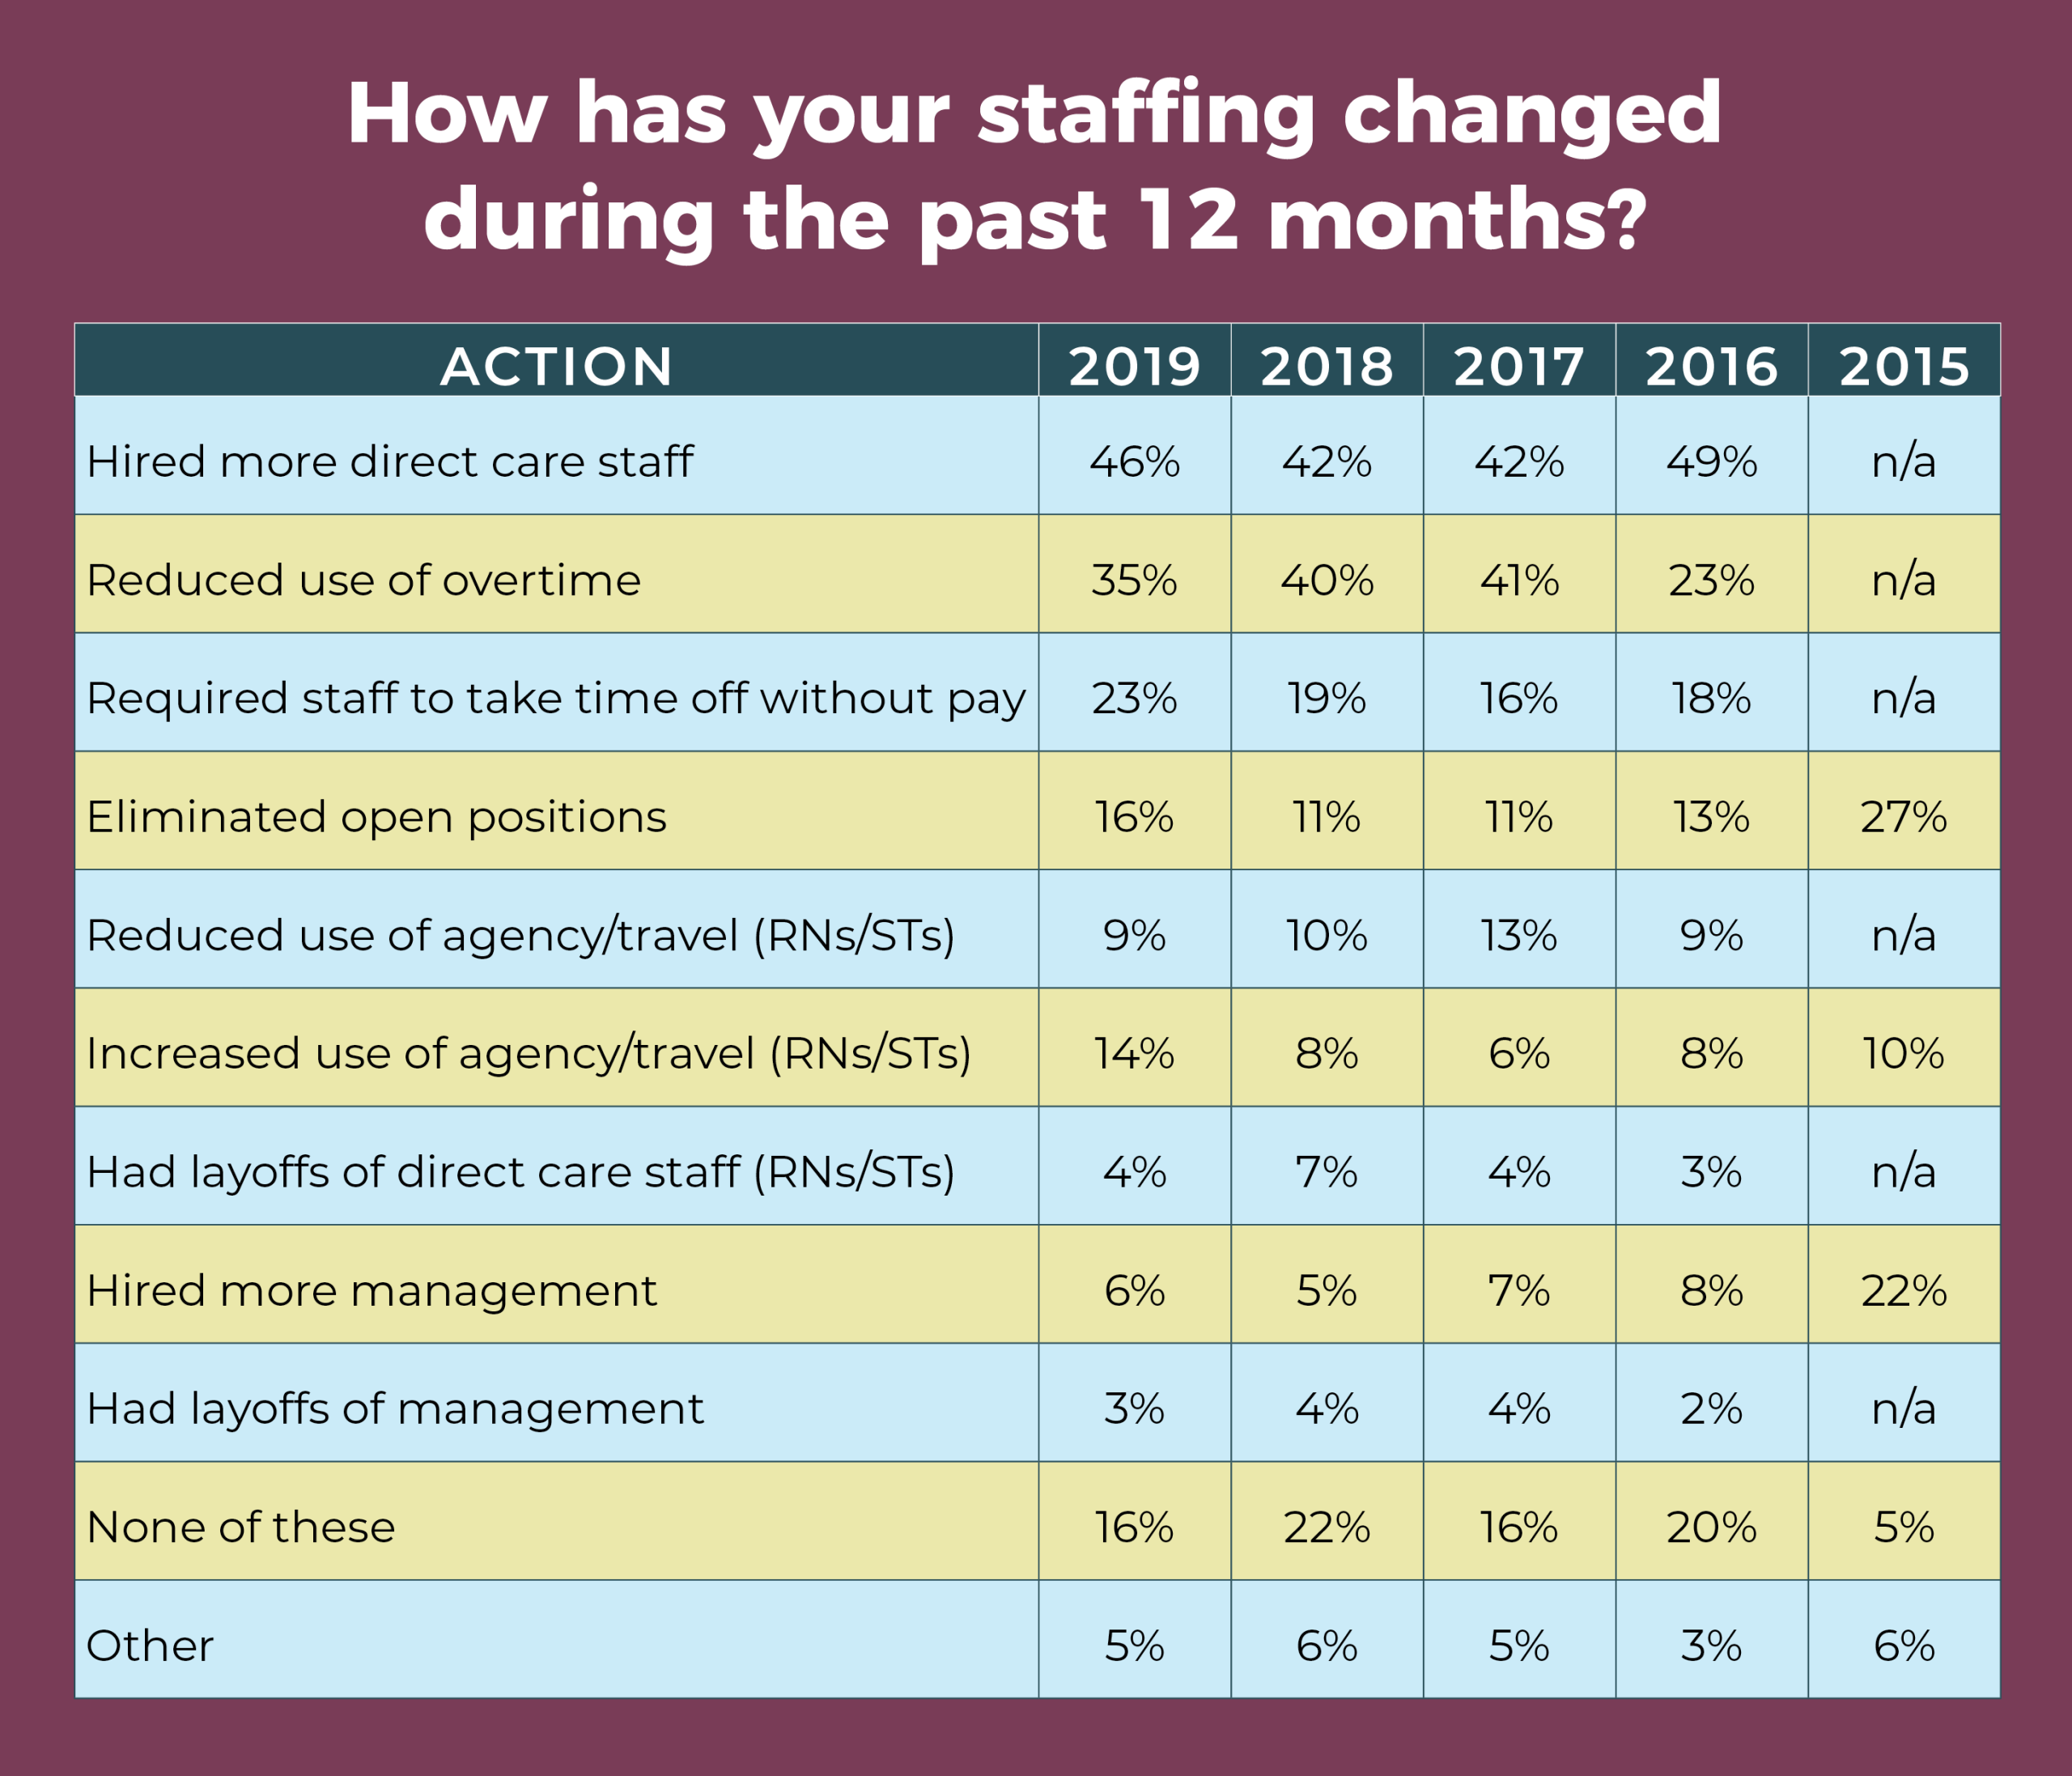
Consistent with the past 3 years, the most commonly reported staffing changes during the past 12 months were hiring more direct care staff (46%) and reducing overtime (35%).
As ASC leaders’ salaries dip,
so does satisfaction


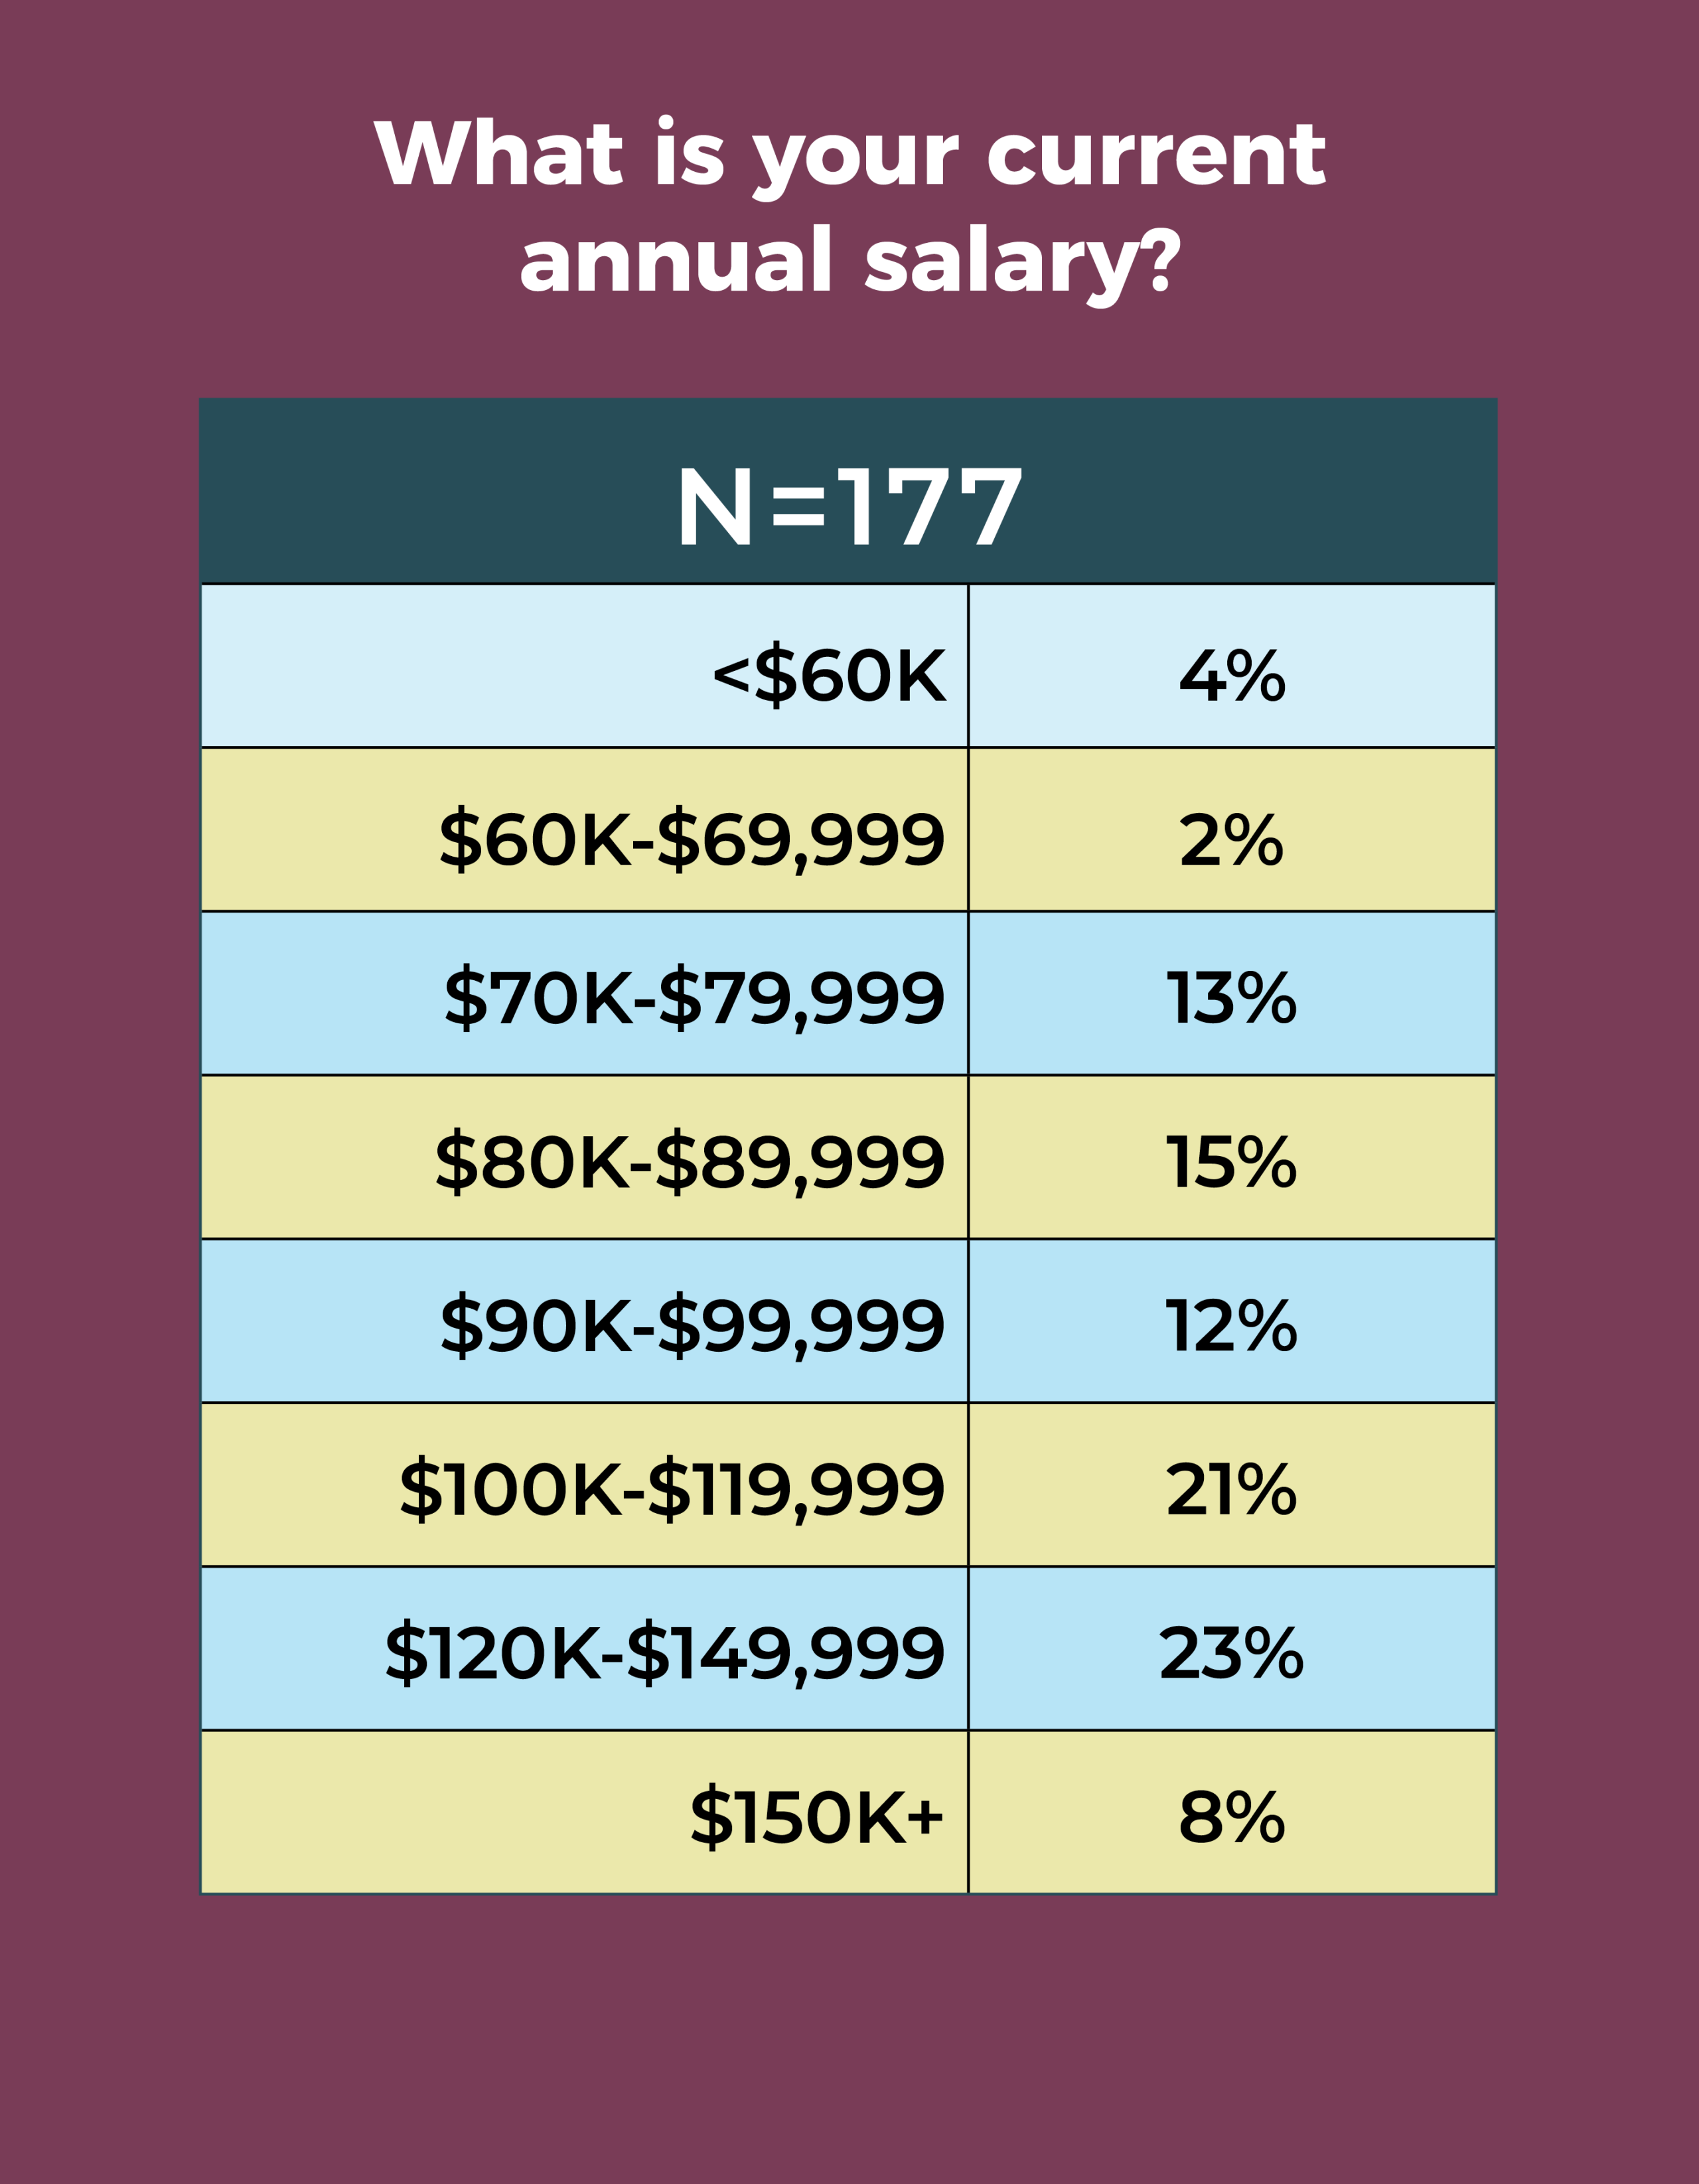
Salaries for ambulatory surgery center (ASC) leaders are down slightly, according to the OR Manager 2019 Salary/Career Survey, with slightly more than half of respondents (52%) earning $100,000 or more—a decline from 60% in 2018, 54% in 2017, and 53% in 2016.
That dip may be contributing to corresponding lower levels of satisfaction. Although most leaders (74%) are satisfied with their jobs, that percentage is down from 77% last year and far below the 83% reported in 2017. Satisfaction with benefits continued its downward trend, dropping from 69% in 2017 to 63% in 2018 and 58% in 2019. Satisfaction with support provided by the respondent’s boss also decreased from 69% last year to 62% this year.

Here are some other survey highlights:
- The average raise was 3.19% (higher than the 1.9% increase in the consumer price index for 2018), lower than the 3.63% reported last year and the 3.94% in 2017.
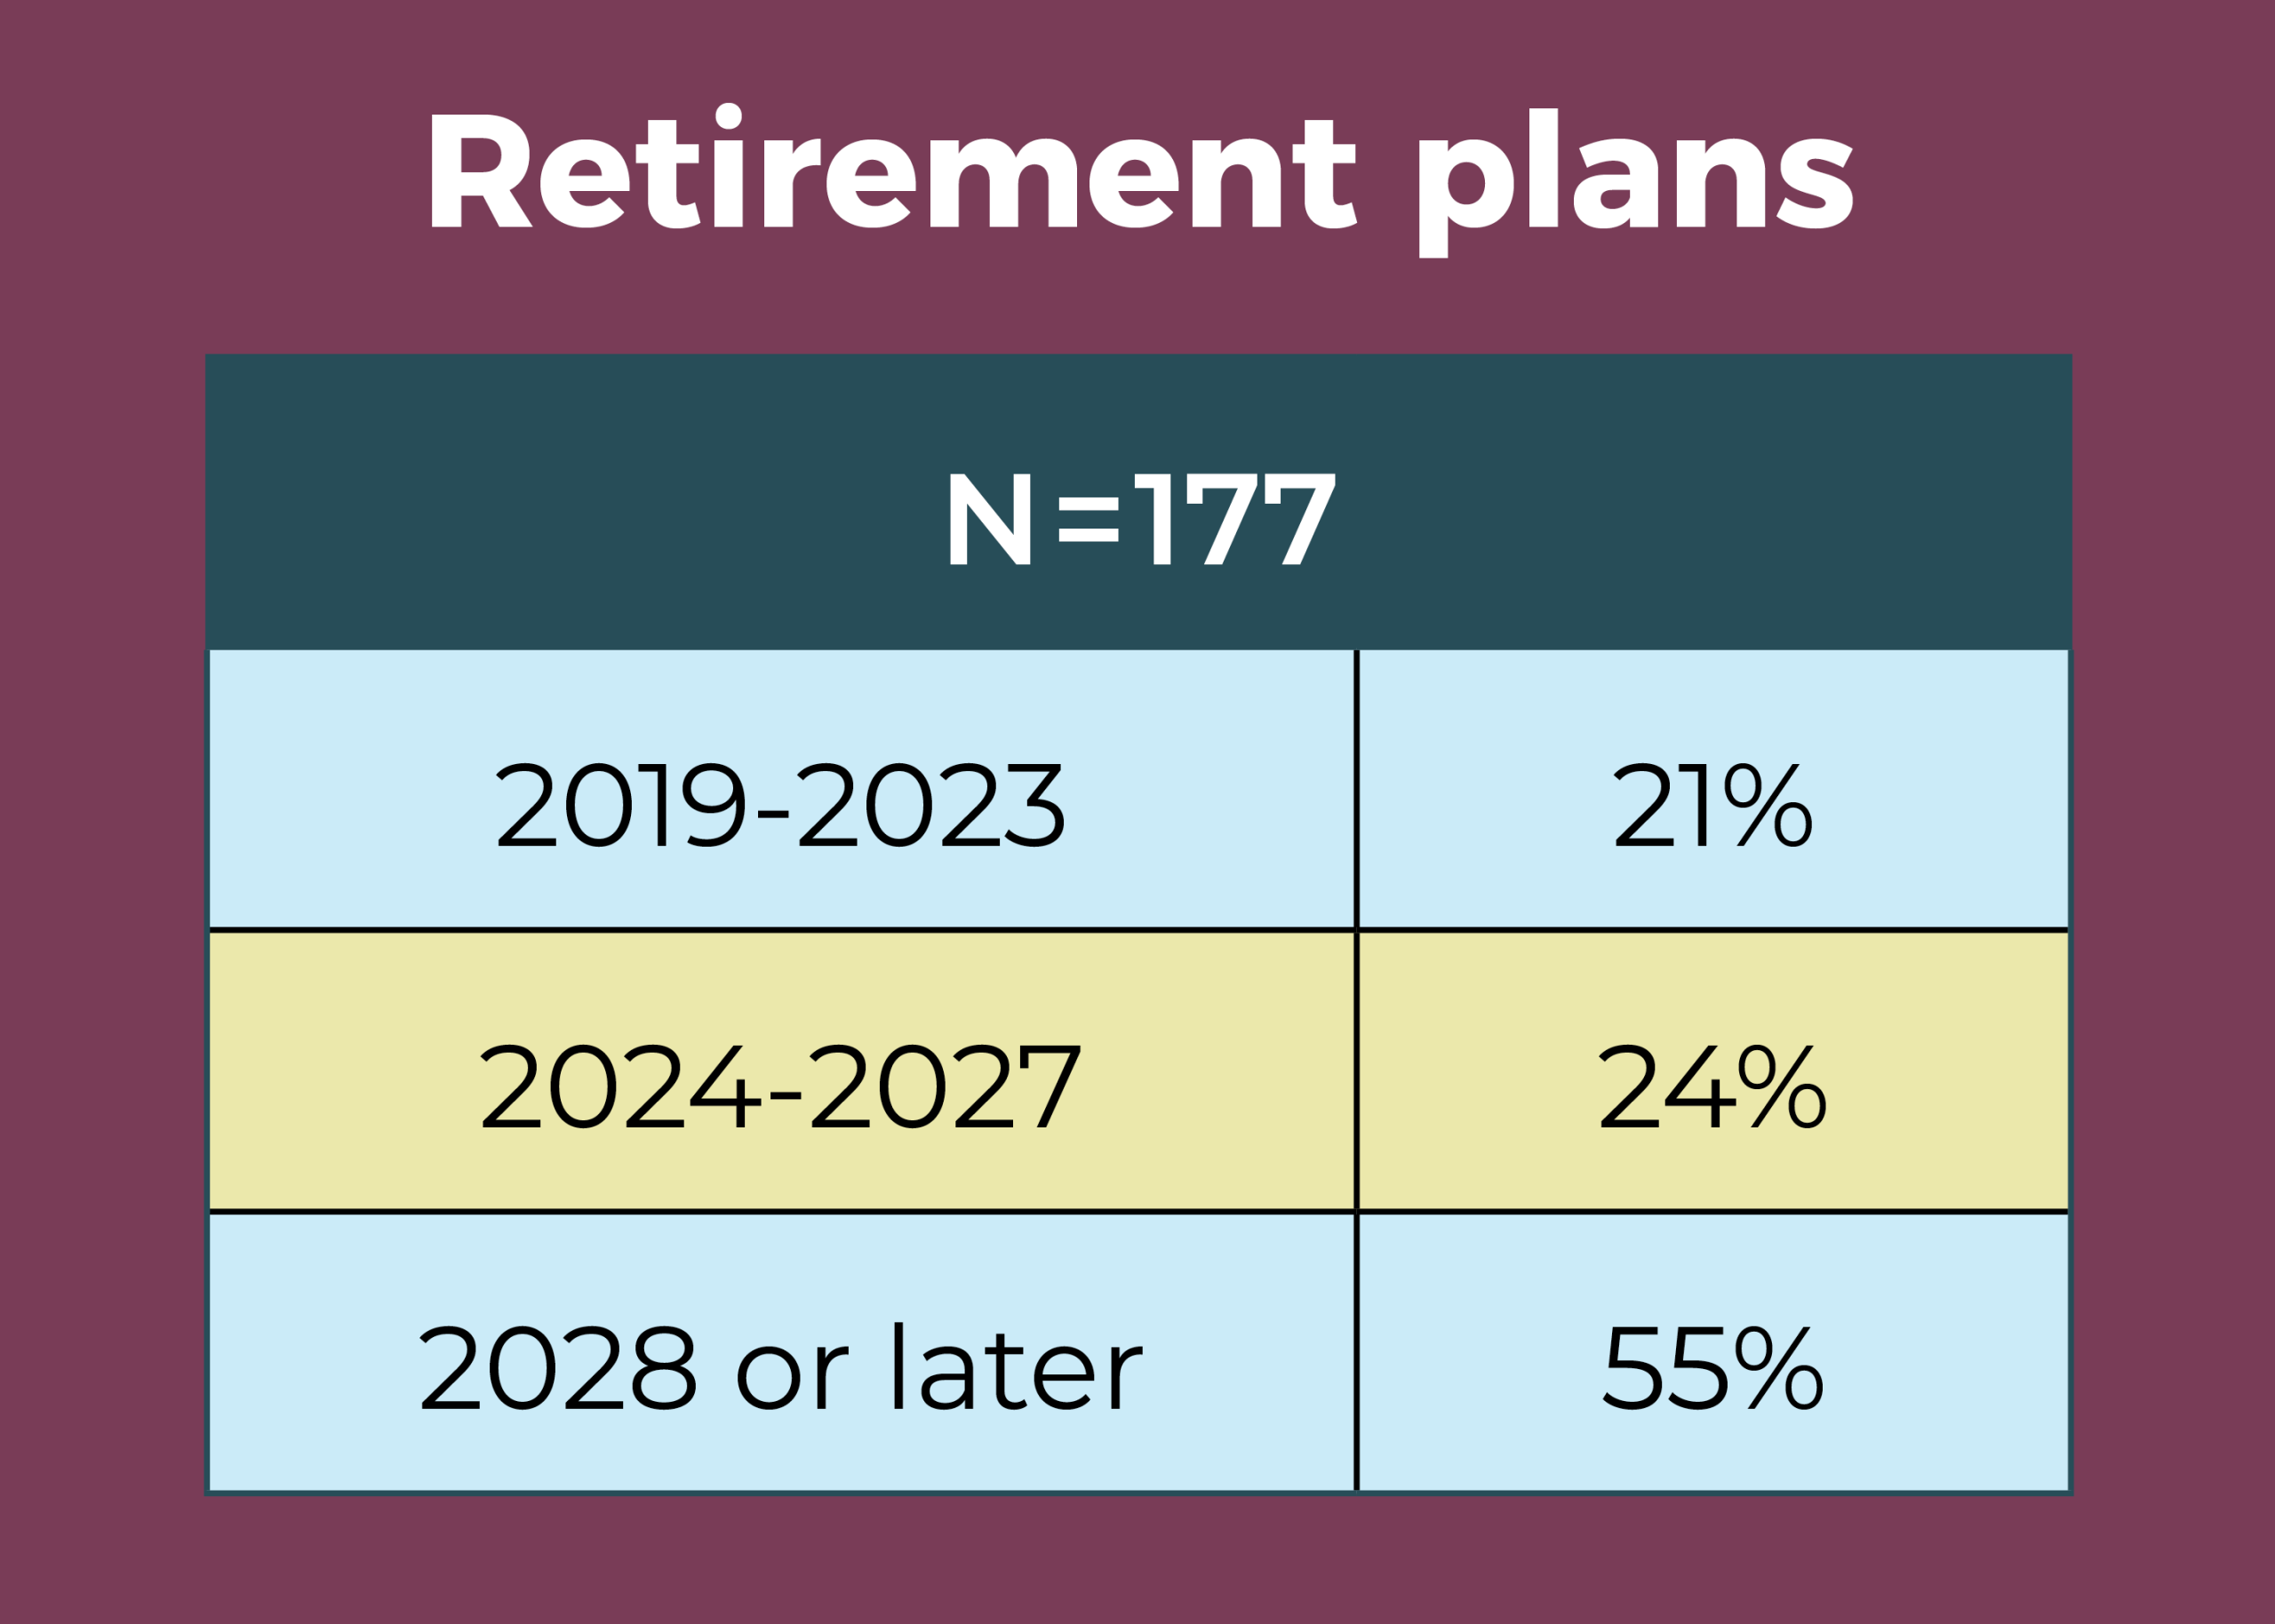
- Retirement plans will continue to reduce the number of experienced leaders, with 21% planning to retire between 2019 and 2023, and 45% expecting to retire before 2028. However, that percentage is lower than the 51% of respondents who said last year that they expected to be retired before 2027. The good news is that more than half (55%) plan to retire in 2028 or later.
- More than a third (37%) of respondents said they didn’t know their ASC’s annual operating budget, compared with 44% last year.

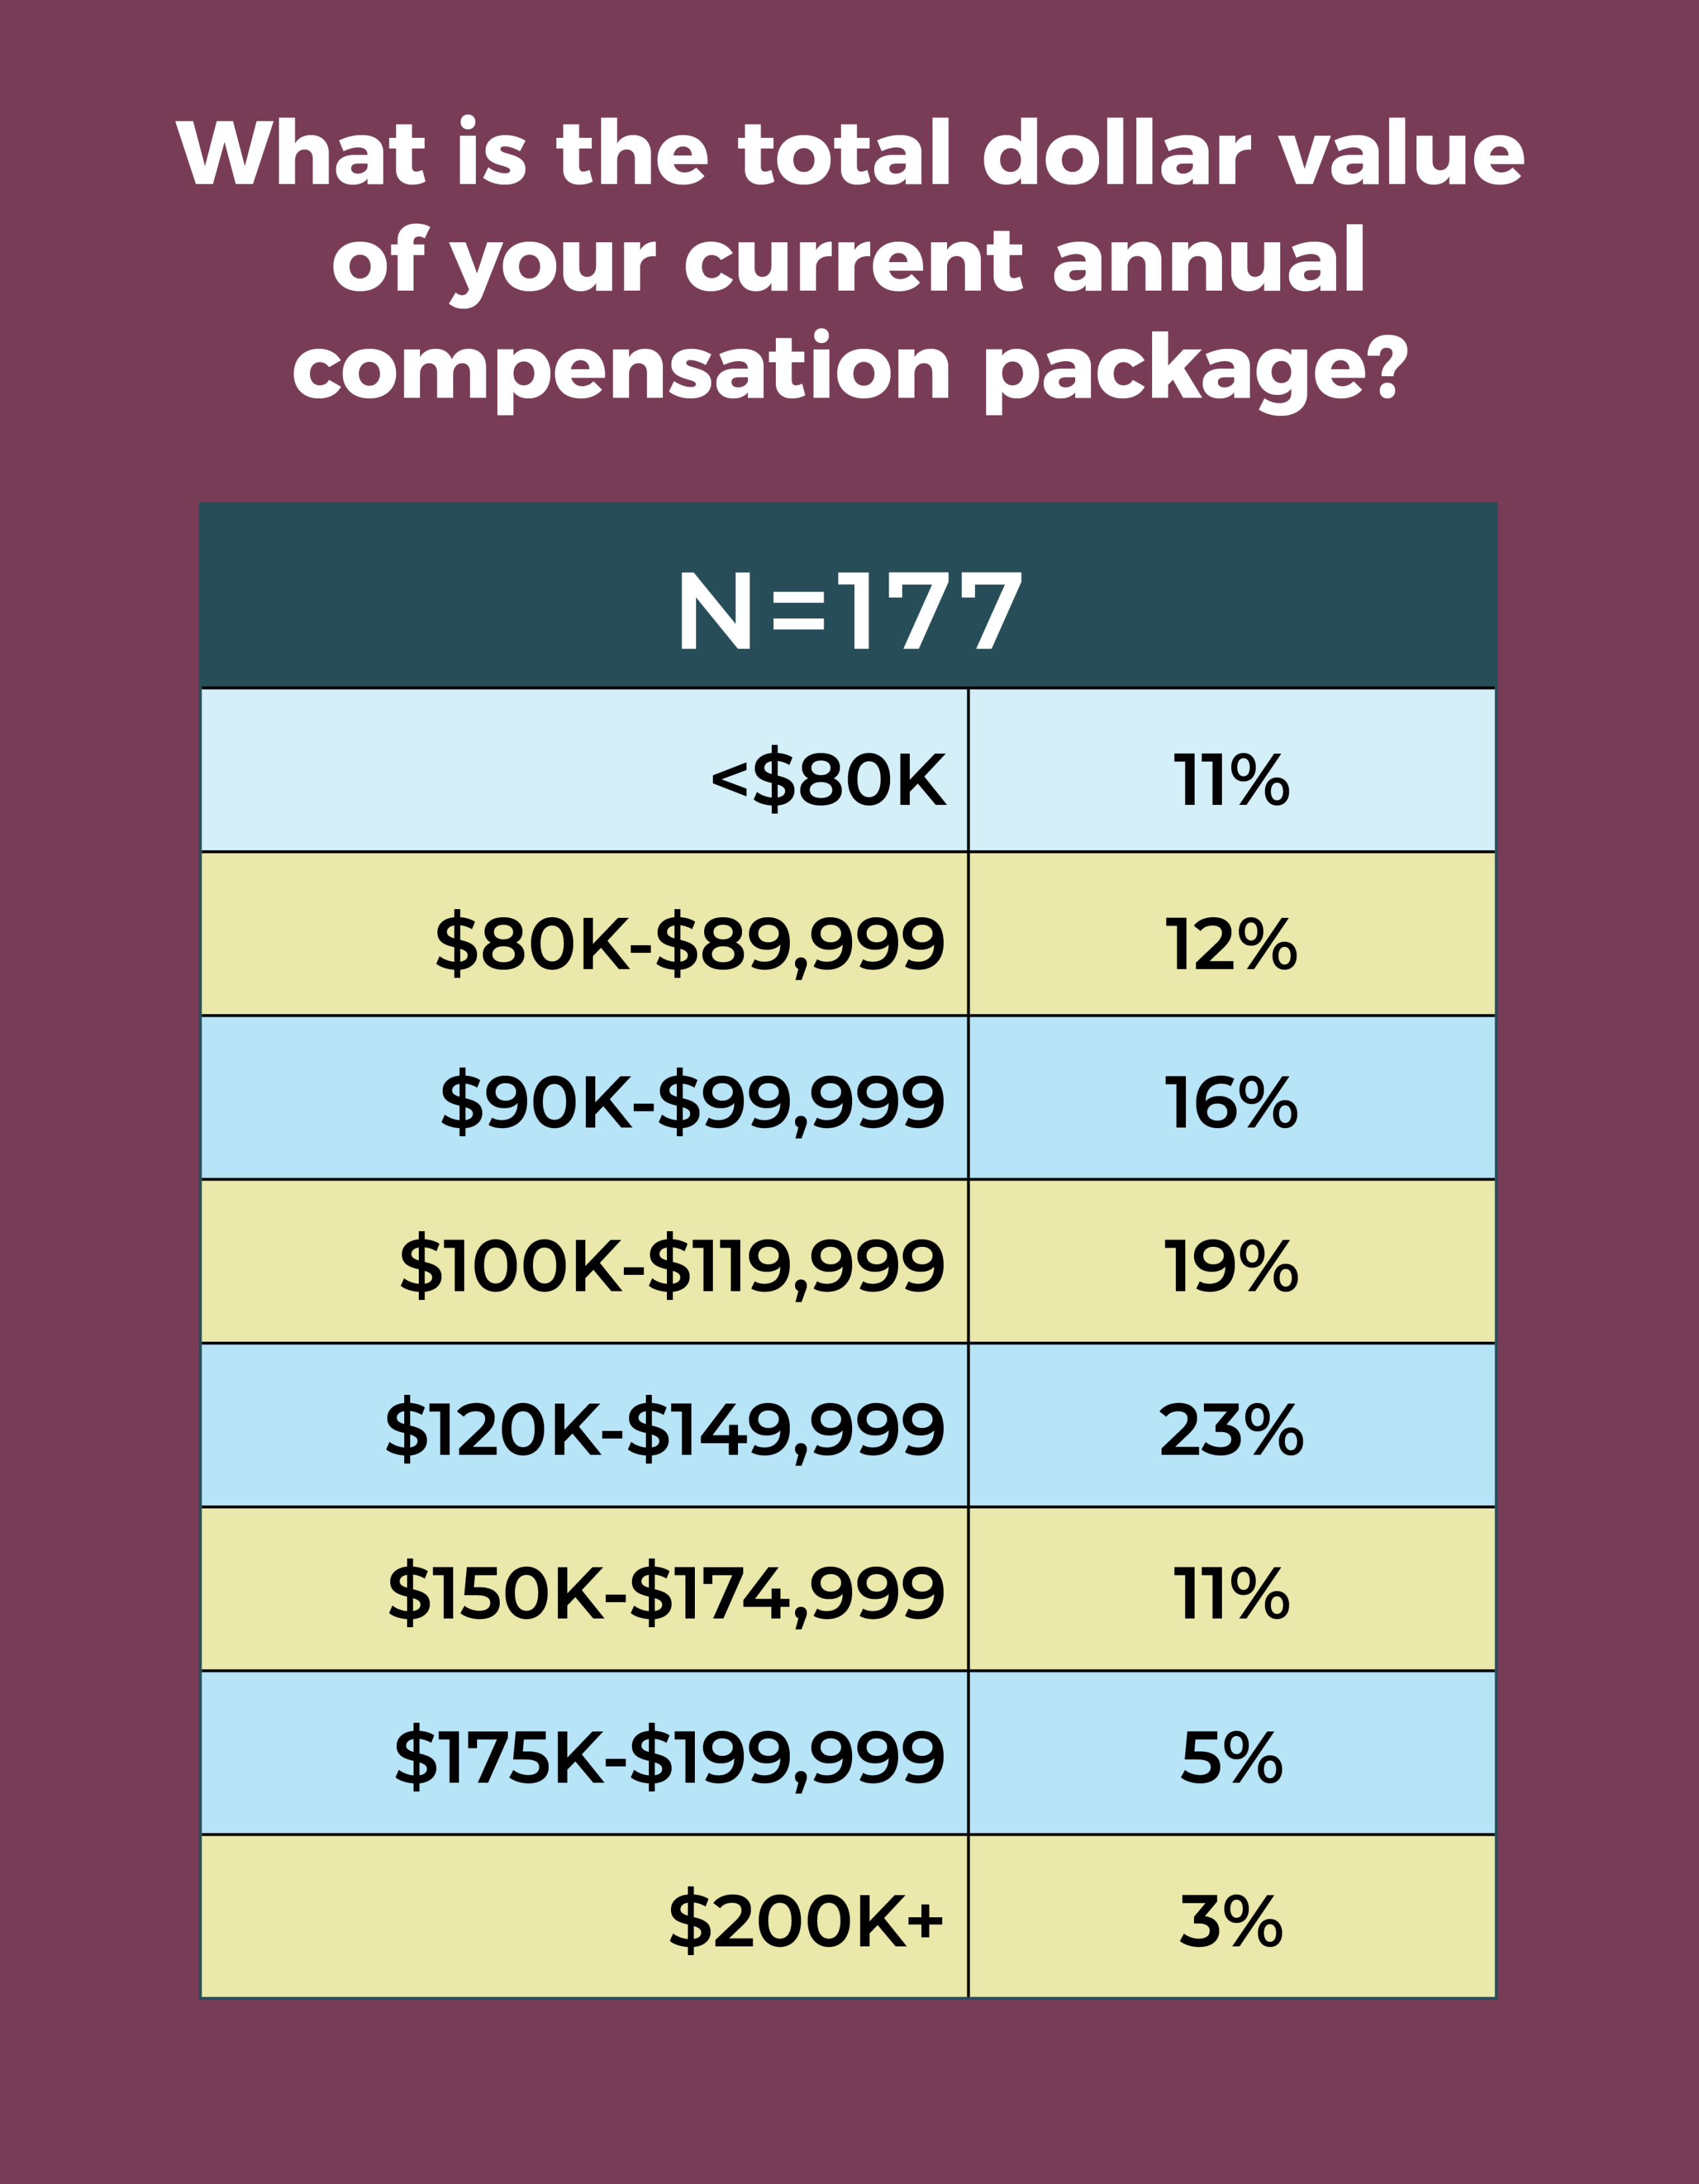
Total compensation, like salary, also declined slightly this year, although the most frequently reported annual total compensation range remained the same: $120,000 to $149,999 (reported by 23% this year and 28% in 2018). Fewer than half (42%) earn $120,000 or more, down from 51% in 2018, and only 3% earn more than $200,000.
Hospital OR leaders continue to earn more than their ASC counterparts. In all, 43% of hospital leaders earn salaries of $120,000 or more, compared with 31% of ASC leaders. Last year, these percentages were 43% and 37%, respectively. In the case of total compensation packages, 42% of ASC leaders earn $120,000 or more, far below the 60% of hospital OR leaders in that range.

The average number of full-time equivalent (FTE) employees that ASC leaders supervise is down from previous years (32 vs 37.34 in 2018 and 39.83 in 2017). They supervise an average of 25 clinical and 7 nonclinical staff. Most respondents (77%) manage one to five ORs, a slight uptick from the 73% reported in 2018. Overall, most (24%) manage two ORs, and 7% manage more than 10 ORs, up from last year’s 3%.
Nurse manager and director were the most common position titles (32% and 30% respectively), with 25% reporting titles of administrator or administrative director.
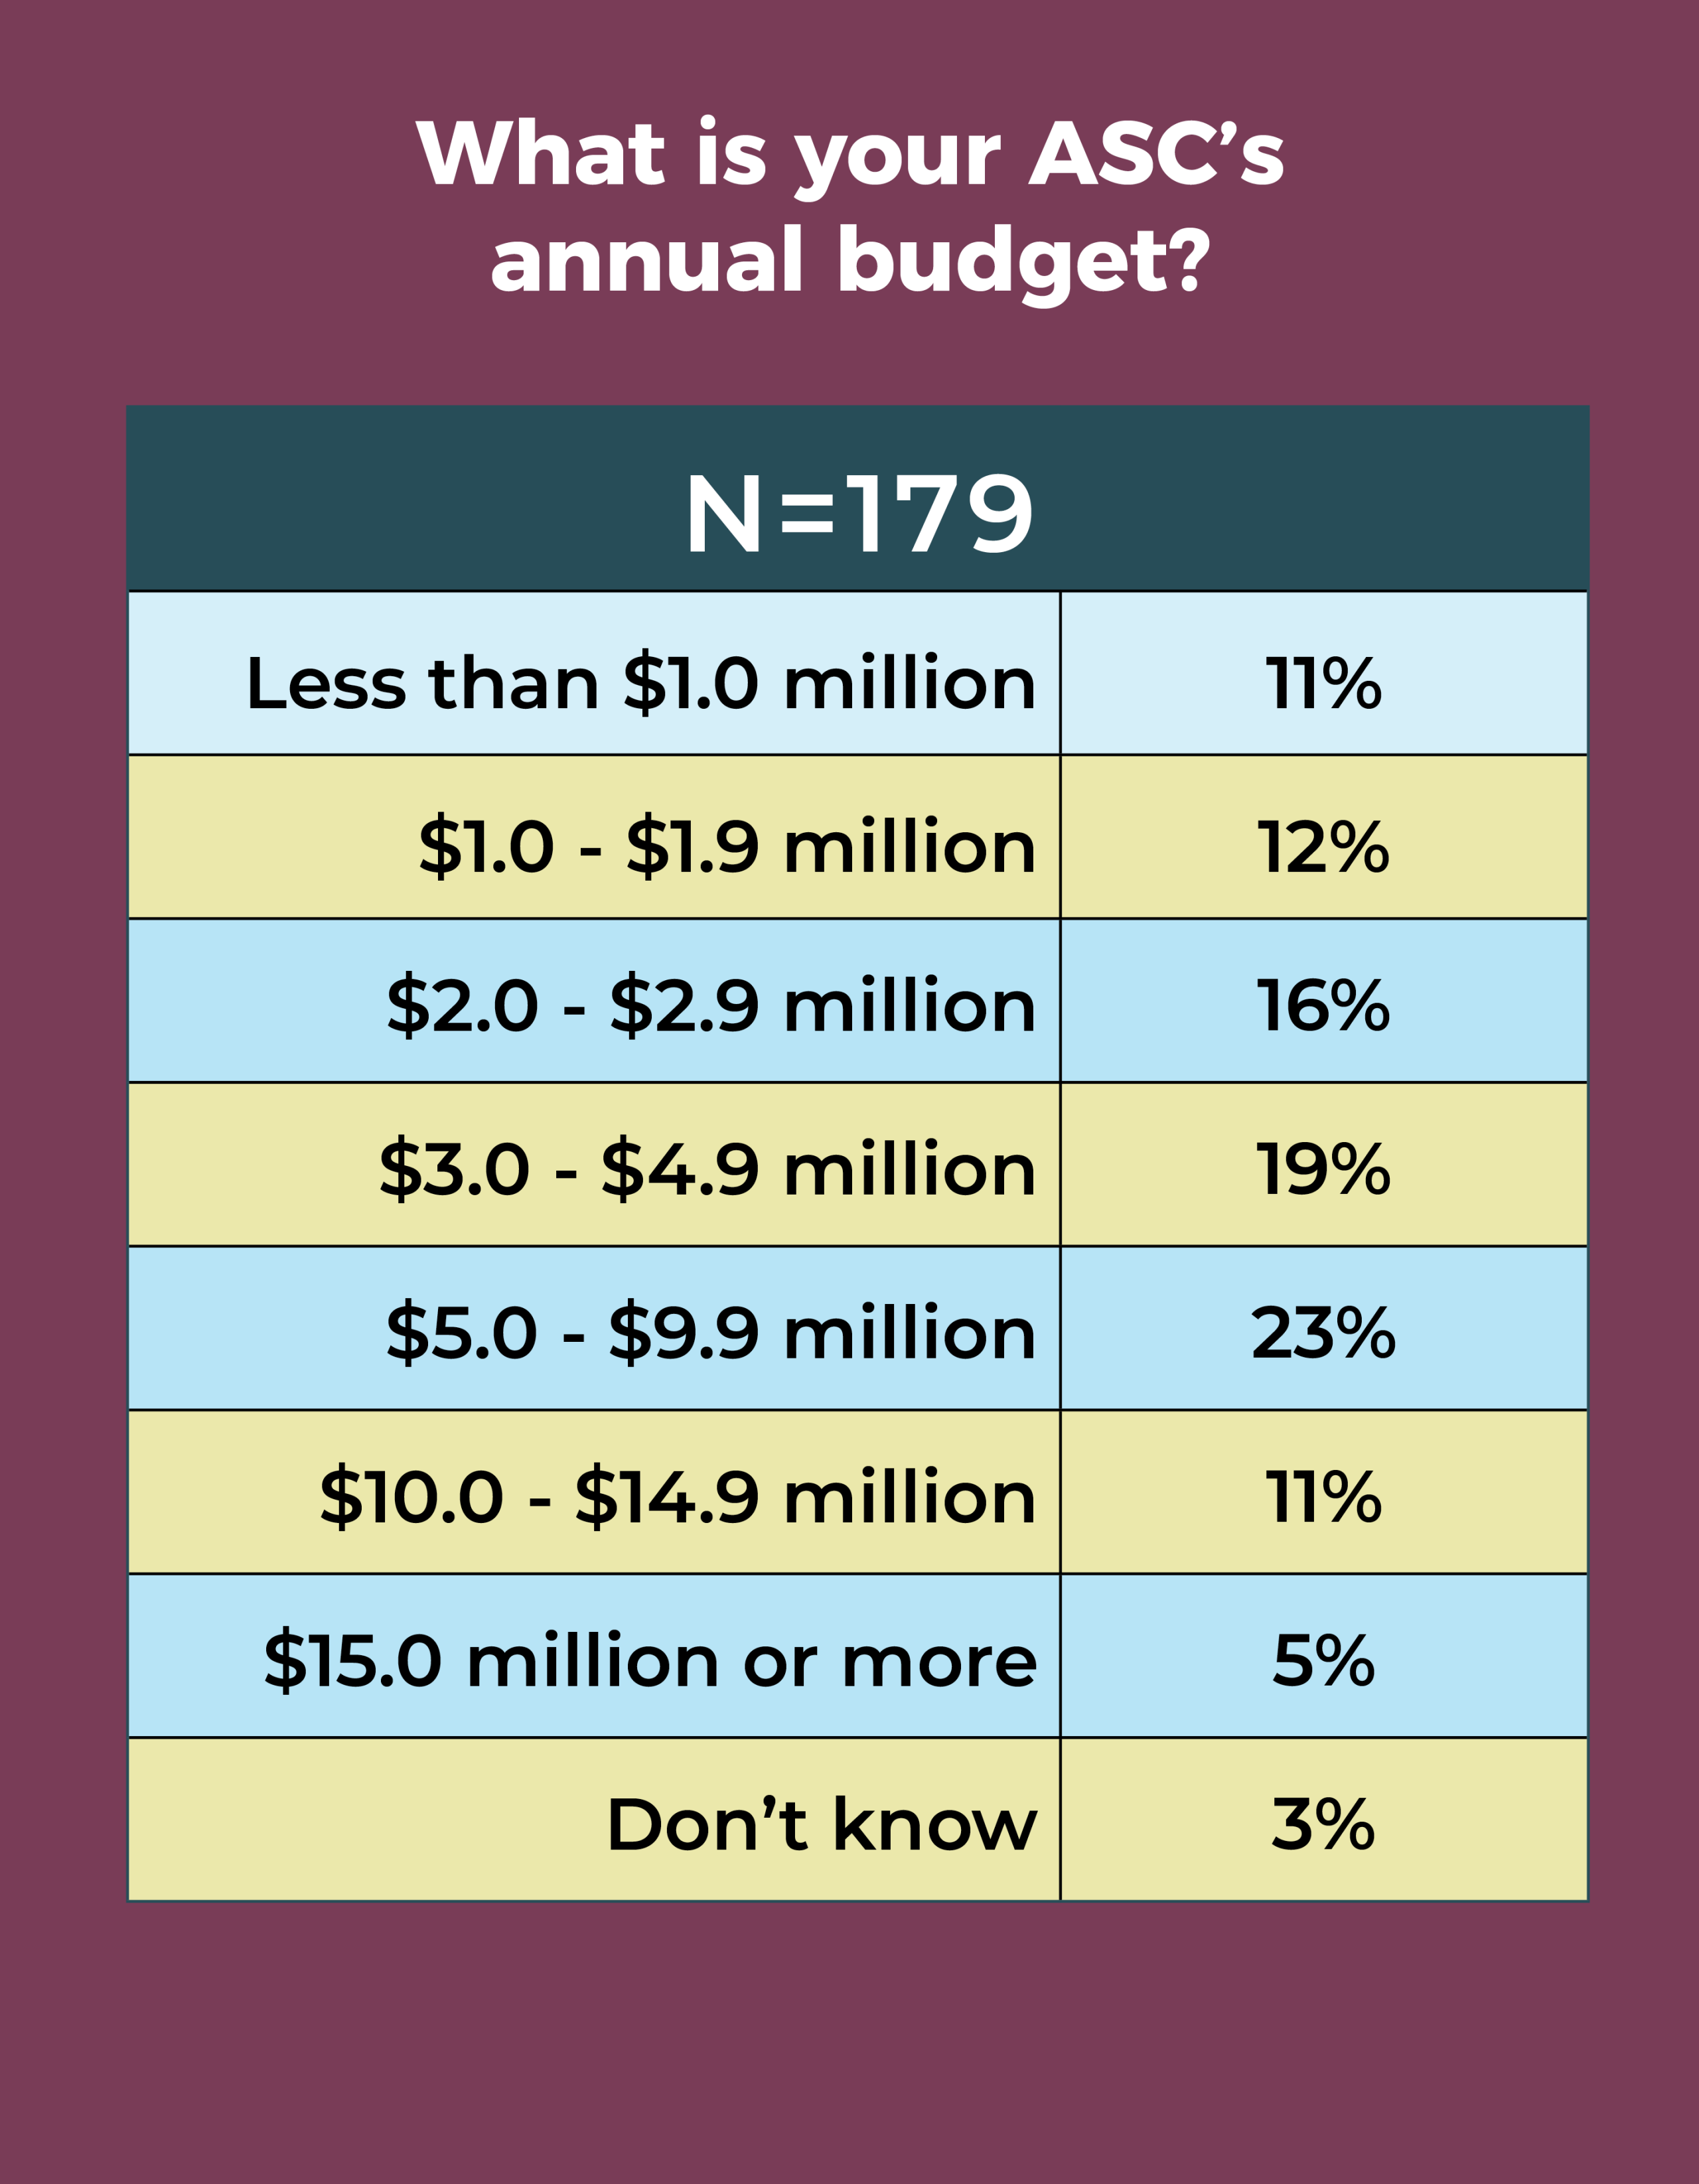
Most OR leaders (18%) report an annual operating budget of $1.0 million to $1.9 million, whereas in 2018, the most common choice was a range of $5.0 million to $9.9 million, cited by 14% of respondents. The second most frequently chosen option (12%) was $3.0 million to $4.9 million. More than two-thirds (67%) reported no change in the annual operating budget during the past 12 months, comparable to last year’s 70%, and 27% reported an increase (up slightly from 23% in 2018).


Concerns can dampen ASC leaders’ satisfaction. Like their hospital OR manager counterparts, ASC leaders ranked staffing as the main thing that keeps them up at night, with 33% of respondents citing this as a chief concern. The primary focus was on quantity, but other worries included staff behavior and training. Sample comments include:
- “Aging staff and finding experienced staff to replace them.”
- “Why can’t the OR staff get along?”
- “Worrying if staff will call in sick.”
- “Employees misbehaving.”
The second most frequent type of response fell into a category best described as feeling overloaded at work. These answers included con cerns about completing tasks and the possibility of overlooking something important. Sample comments are:
- “I wear entirely too many hats and am responsible for too many things, and do not have enough time to do all of them as well as they should be done.”
- “Being pulled in so many directions that I don’t feel as though I’m efficient in any area.”
- “The increasing amount of work being pushed down to my position. There is no room for a balanced work/life ratio. Constant access to email or text messaging means I am expected to be available 24/7.”
- “Did I remember to ______ today?”

Other categories that many responses related to were financial (eg, budgets, reimbursement), management (lack of support from organization leaders), and regulatory (such as keeping current on and meeting reporting requirements).
The survey also asked respondents to name their most important resource for becoming a better leader. Items that topped the list included more support from management, more time, and education.
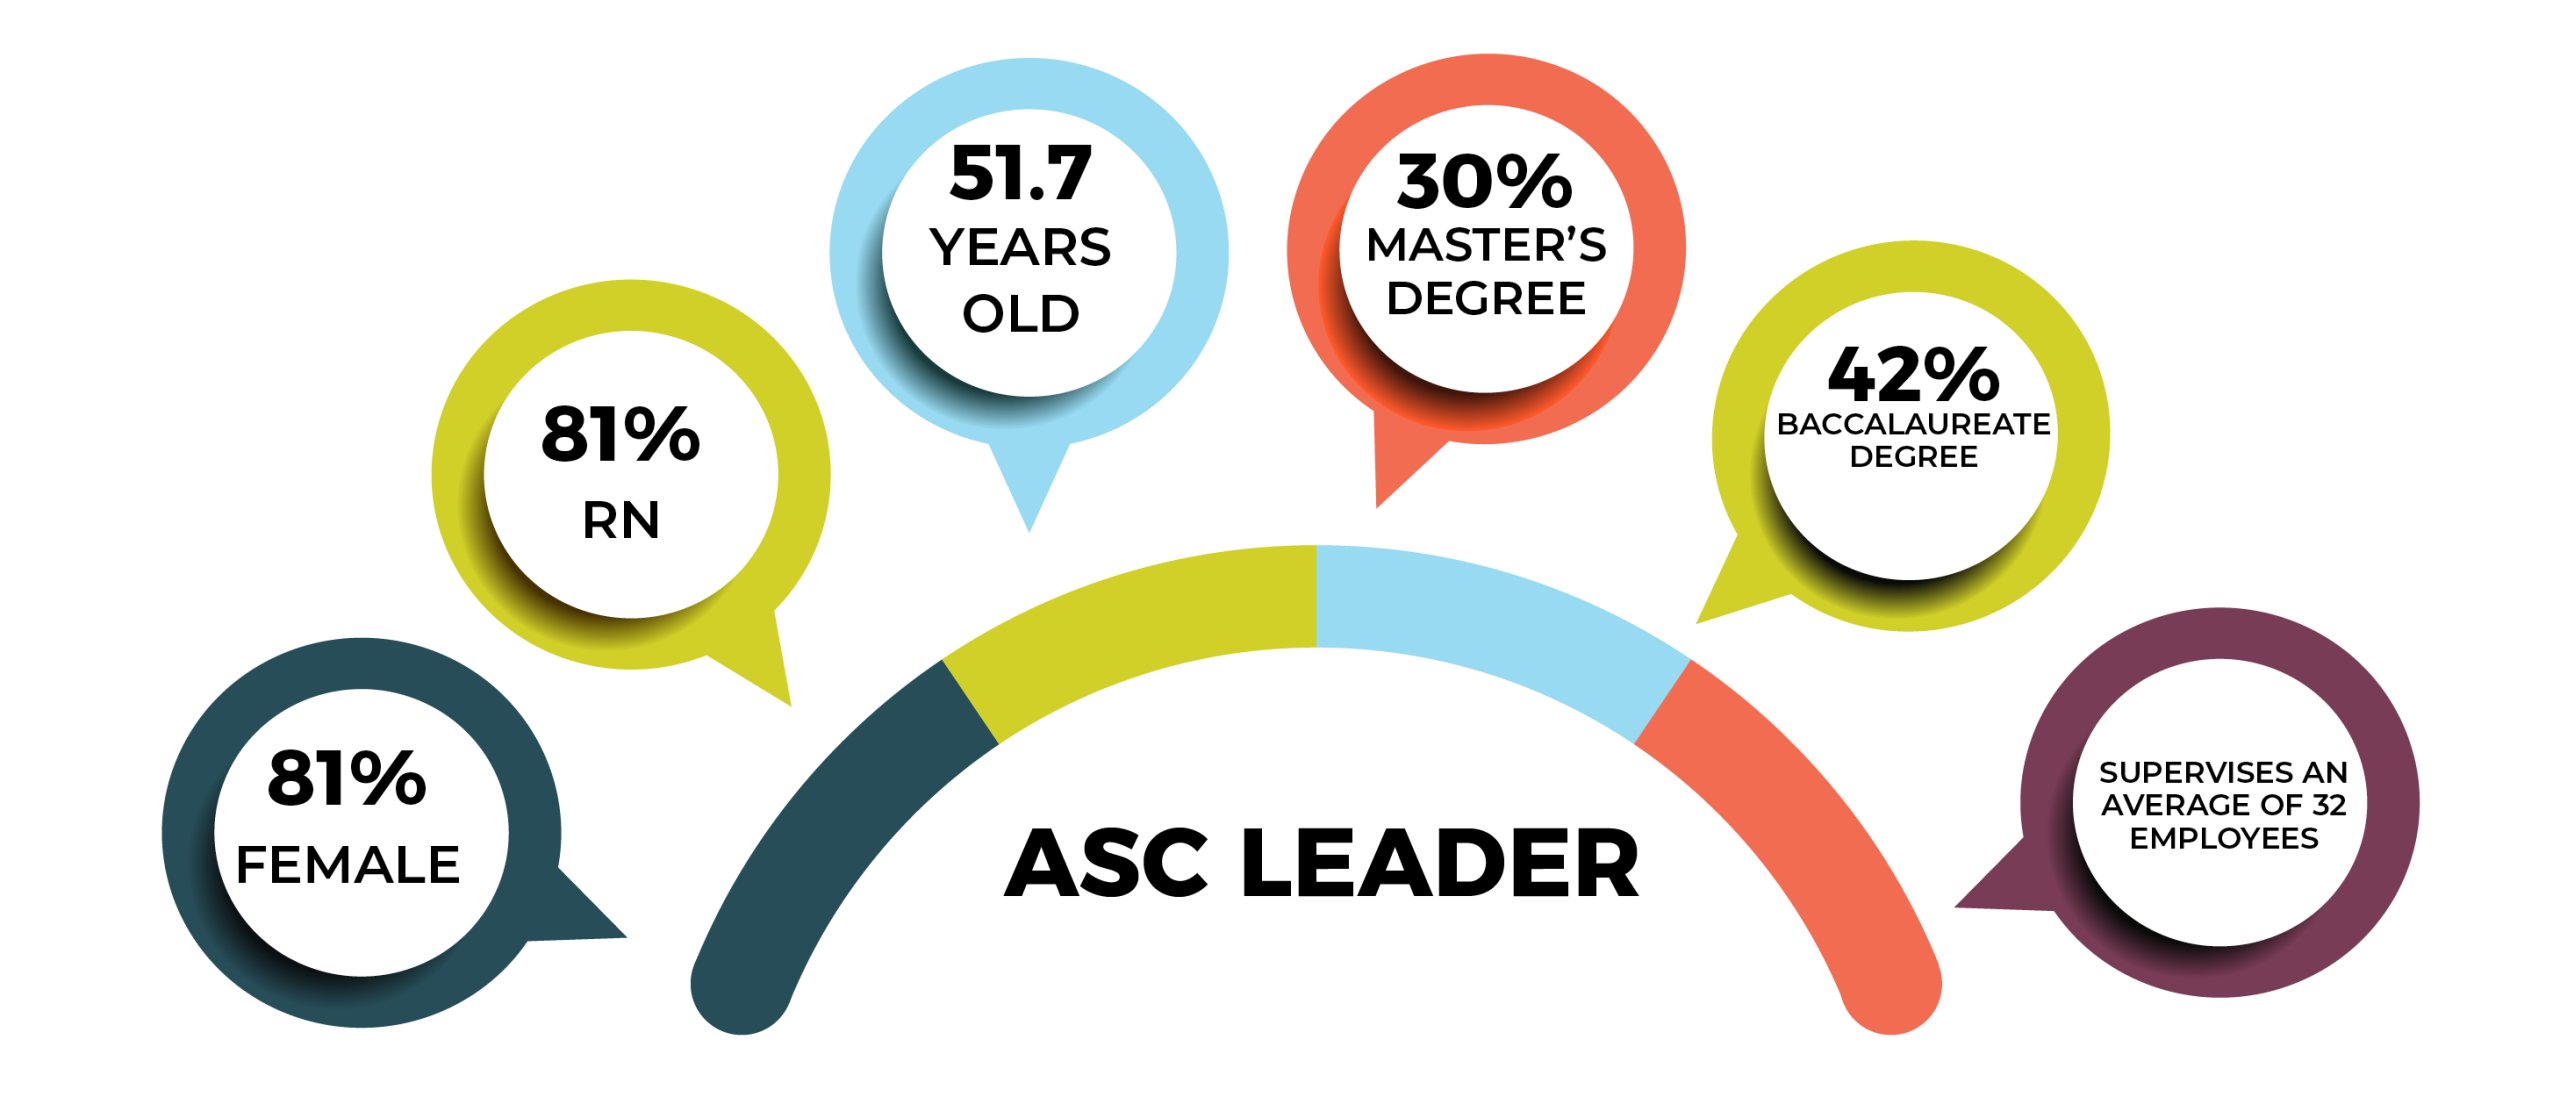
Overall demographics are listed in the infographic above. Last year, 34% of ASC leaders reported their highest level of education was a master’s degree (34%), whereas this year, 42% reported a bachelor’s degree (42%) and 30% a master’s degree as their highest level. Slightly fewer leaders reported an associate degree in nursing as the highest earned degree compared to 2018 (17% vs 20%).

Data for the OR Manager Salary/Career Survey were collected from March 28 to May 31, 2019. The survey list comprised OR directors, managers, or similar positions within hospital ORs, and nurse managers of ASCs who were either OR Manager subscribers or part of an external list. The survey was closed with 387 usable responses for hospitals and 196 usable responses for ASCs. The margin of error is ±5 percentage points at the 95% confidence level.
OR Manager thanks those who generously took time to complete this year’s survey. We appreciate your help in gathering this information, which will be useful to your colleagues around the country.